TFF3 facilitates dormancy of anti-estrogen treated ER+ mammary carcinoma
Introduction
Tumor dormancy is described as a period between clinical tumor remission and tumor recurrence wherein a cancer cell mass is present, however the tumor volume is below the clinical detection threshold1,2,3,4,5. In this state, both tumor mass dormancy and cellular dormancy co-exist and constitute tumor dormancy4,5. Tumor mass dormancy is an equilibrium of balanced cancer cell proliferation and cell death, modulated by angiogenesis and immune-surveillance4,5. A non-proliferative but surviving cancer mass, which is capable of repopulation, is defined as dormant tumor mass4,5. Cellular dormancy implies a quiescent state of cancer cells (dormant cells), exhibiting cell cycle arrest in the G0/G1 phase, inactive DNA replication and enriched stemness attributes6,7,8. Additionally, at the molecular level, a low p44/42MAPK/p38MAPK activity ratio (increased p-p38MAPK (Thr180/Tyr182)/total p38MAPK ratio with decreased p-p44/42MAPK (Thr202/Tyr204)/total p44/42MAPK ratio) has been identified as a key molecular characteristic of dormant cancer cells9,10,11,12.
As the predominant mammary carcinoma (MC) subtype, estrogen receptor positive (ER+) MC accounts for about 70% of all MC cases13. More than 70% of ER+MC recurs 5–20 plus years after clinical remission, thereof 20% are more than 15 years14. In contrast, most recurrences of other cancers, including estrogen receptor negative (ER-) MC, occur within 2 years15. Thus, ER+MC patients display a prolonged clinical dormancy state14 wherein anti-estrogen-therapy is the standard of care to abrogate the outgrowth of micro-metastatic deposits (recurrence)16. Once ER+MC metastatically colonizes or outgrows from the anti-estrogen induced dormancy state, the patient prognosis is dismal (OS < 3 years, PFS: 1–2 years)17. Thus, ER+MC is an interesting model to study therapy-induced tumor dormancy and with a clear unmet need. Hence, further investigation on the mechanisms of anti-estrogen-therapy induced dormancy are required in order to better impede metastatic colonization/outgrowth and thus improve prognosis of ER+MC patients.
As for anti-estrogens targeting ER in ER+MC patients, selective ER downregulators (SERDs) or selective ER modulators (SERMs) remain the most common18. The representative SERD, Fulvestrant (FUL)19, binds to ER to reduce its translocation into the nucleus causing ER degradation18. Tamoxifen (TAM), a commonly used SERM20, competitively inhibits estrogen binding to the ER, alters the conformation of ER and suppresses its transcriptional activity in ER+MC18.
In vivo therapy-induced dormancy models of MC are currently limited to ER-MC and to date, no in vivo ER+MC dormancy model has been generated for therapeutic investigation21,22,23,24,25,26. Therapy-induced tumor dormancy is a dynamic process interacting with environmental niches which are not fully mimicked by in vitro generated models21. Moreover, the in vivo ER- models established were limited to in vivo observations and MC cells within these models were not extracted for detailed evaluation22,23,24,25,26, which limited the potential applicability of such approaches in ER+MC. To address these deficits, an in vivo approach to generate dormancy-like ER+MC models induced by anti-estrogens was generated and the dormancy associated attributes validated. The establishment of in vivo dormancy-like models for ER+MC allowed the identification of TFF3 as a critical driver of ER+MC dormancy, and offered for consideration potential pharmacological combination approaches that may abrogate the clinical burden of this unmet need.
Methods
Animal studies
Xenograft studies were performed according to the Animal Research: Reporting In Vivo Experiments 2.0 guidelines, approved by the Laboratory Animal Ethics Committee (Certificate number: YW) at Peking University, and ethical approval was obtained from Tsinghua Shenzhen International Graduate School (Number:9, Year 2020). All animal experiments herein were performed using 5-week-old female BALB/c athymic mice (15–16 g/mouse). All mice were implanted subcutaneously with 0.72 mg of 90-day release 17β-estradiol pellets (Innovative Research of America, Sarasota, FL, USA) 1 week before the orthotopic xenograft or tail vein injection. Each group contained three mice to generate the in vivo FUL/TAM induced control, dormancy-like, and relapse models, or six mice per group for other in vivo evaluations. For animal experiments requiring statistical analysis, sample sizes were determined on the basis of expected effect sizes from pilot experiments. The animals were littermate, and inbred lines were used. The animals were randomly assigned to groups for experimental execution. No animals were excluded from the analyses.
Orthotopic xenograft
Mice were utilized to generate dormancy-like models induced by FUL or TAM. Orthotopic xenografts were created by injecting 1 × 10⁷ MCF7-Luciferase (Luciferase gene transfected) cells into the right fourth mammary fat pad of mice. With the development of xenograft-bearing mice (with a volume of 100–150 mm3), the animals were randomly assigned to six groups: FUL or TAM-induced control (FC/TC), dormancy-like (FD/TD), and relapse (FR/TR) groups (n = 3) 3 weeks post-injection of MCF7 cells. The FC group received weekly treatment with the vehicle (Table S7), whereas the FD or FR groups were treated with 250 mg/kg FUL per week subcutaneously for 4 weeks. The TC group received the corresponding vehicle twice a week (Table S7), and the TD or TR groups were treated with 30 mg/kg of TAM intraperitoneally twice a week for 4 weeks. The FD or TD group mice were euthanized at the end of the therapy period. The FC/TC and FR/TR group mice were sacrificed when the xenograft volume reached 1000 mm3. Throughout the study, xenograft volumes and mouse weights were measured on a daily basis, and bioluminescence imaging was performed weekly. The xenograft mass was dissected and divided into two parts: one for histology and IHC analysis (Fig. 1c, S2, S32), and the other half was cultured to establish primary cell culture on collagen-coated plates, following the methods described in the respective section.
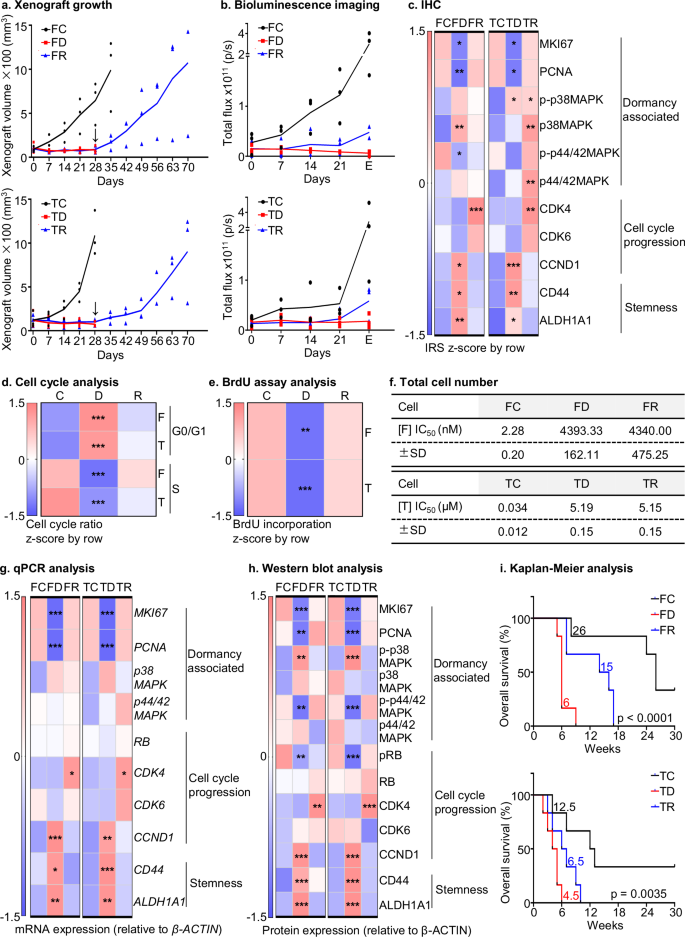
a Xenograft growth: The xenograft growth was monitored on a daily basis by measuring the volume of the xenograft (n = 3). The FD or FR groups were treated with 250 mg/kg Fulvestrant per week subcutaneously and the TD or TR groups were treated with 30 mg/kg of Tamoxifen intraperitoneally twice a week for 4 weeks. The FC and TC groups received the corresponding vehicles for 4 weeks. The arrow indicates the time point at which the therapy was ceased. The lines represent the mean of three animals (n = 3). b Bioluminescence imaging: Once a week, bioluminescence imaging was conducted to detect luminescence signals (n = 3). The FD or FR groups were treated with 250 mg/kg Fulvestrant per week subcutaneously and the TD or TR groups were treated with 30 mg/kg of Tamoxifen intraperitoneally twice a week for 4 weeks. The FC and TC groups received the corresponding vehicles for 4 weeks. The quantitative data from representative luminescence images in Fig. S1c. The lines represent the mean of three animals (n = 3). E denotes endpoint. c IHC: The heatmap illustrates the quantification of relative immunoreactivity scores (IRS) from the FC, FD, FR, TC, TD, or TR groups (n = 3) in Fig. S2. The standard method used was the z-score in the row direction. Statistical analysis was performed using a one-way ANOVA followed by Tukey’s multiple comparisons test. d Cell cycle analysis: The heatmap displays the representative G0/G1 and S ratio in FC1, FD1, FR1, TC1, TD1, or TR1 cells in 10% FBS containing medium in Fig. S3e. Statistical analysis was performed using a one-way ANOVA followed by Tukey’s multiple comparisons test. e BrdU assay: The heatmap displays the representative relative BrdU incorporation in FC1, FD1, FR1, TC1, TD1, or TR1 cells in 10% FBS containing medium in Fig. S4a. Statistical analysis was performed using a one-way ANOVA followed by Tukey’s multiple comparisons test. f Total cell number: The IC50 values were calculated for six cell lines by treatment with the indicated concentrations of Fulvestrant (F) or Tamoxifen (T) for 72 h (Fig. S4b). This analysis was performed using GraphPad Prism software (n = 3). g qPCR analysis: The qPCR heatmap displays the mRNA levels of various biomarkers associated with dormancy (MKI67, PCNA, p38MAPK, and p44/42MAPK), cell cycle (RB, CDK4, CDK6, and CCND1) and stemness (CD44, and ALDH1A1) in FC, FD, FR, TC, TD, or TR cells in 10% FBS containing medium. Statistical analysis was performed using a one-way ANOVA followed by Tukey’s multiple comparisons test (n = 3). h Western blot analysis: Heatmap using Western blot quantification (Fig. S5e, S34) displays the levels of dormancy-associated biomarkers (MKI67, PCNA, p-p38MAPK (Thr180/Tyr182), p38MAPK, p-p44/42MAPK (Thr202/Tyr204), and p44/42MAPK), cell cycle-associated biomarkers (pRB (Ser807/811), RB, CDK4, CDK6, and CCND1) and stemness-related biomarkers (CD44, and ALDH1A1) in FC, FD, FR, TC, TD, or TR cells in 10% FBS containing medium. Statistical analysis was performed using a one-way ANOVA followed by Tukey’s multiple comparisons test (n = 3). i Kaplan–Meier analysis: The median survival and surrogate survival of the FC, FD, FR, TC, TD, or TR groups were depicted using Kaplan–Meier analysis (n = 6). The log-rank test (χ2 = 18.56, p < 0.0001) was used to analyze the statistical differences between the groups. The symbols (*) indicate statistical significance compared to the corresponding control group. p < 0.05(*), p < 0.01(**) and p < 0.001(***) were considered statistically significant. Exact P values were included in Supplementary Data 1, unless indicated otherwise.
Tail vein injection
Mice were anesthetized with isoflurane. 100 µl of luciferase-labeled 1 × 10⁶ FC, FD, FR, TC, TD, or TR cells was slowly injected into the mouse tail vein. Mice were maintained on a warming pad until they recovered from anesthesia. Metastasis was monitored by bioluminescence imaging using the In Vivo Imaging System (IVIS, PerkinElmer) weekly. Briefly, mice were anesthetized with 3–4% isoflurane and injected with D-Luciferin (150 mg/kg, APExBIO) via intraperitoneal injection. The mice were then placed inside the PerkinElmer IVIS Spectrum Optical Imaging System for measuring bioluminescence. Total photon flux was calculated using Living Image 4.7.3. software (PerkinElmer). Mice were weighed and monitored daily. Following Guidelines for the welfare and use of animals in cancer research, mice with consistent or rapid body weight loss reaching 20% at any time or 15% maintained for 72 h compared with the pre-treatment weight of adult mice were criteria followed with prompt euthanasia. Survival curves and data analyses were performed with Prism 6 (GraphPad Software). For drug treatments, mice were randomized into treatment groups, and whole blood, brains, lungs, and livers were collected.
Regarding the IHC staining scoring method, the staining intensity was categorized into 4 grades (negative, 0; weak, 1; moderate, 2; strong, 3), whereas the extent of positive cell area was classified into 5 grades (0, 0%; 1, 1–25%; 2, 26–50%; 3, 51–75%; 4, 76–100%). The final staining scores were determined by multiplying these two parameters, yielding an overall score ranging from 0 to 1227. The corresponding antibodies used herein are listed and detailed information were summarized in Table S4, S5. The statistical differences between the treatment groups were compared using a one-way ANOVA followed by a Tukey’s multiple comparison test. All experiments were blinded where possible.
Cell culture and reagent
The human ER+MC cell line MCF7 was purchased from Procell Life Science & Technology Co. Ltd (China). MCF7 and the derived FC, FD, FR, TC, TD, and TR cell lines were cultured in RPMI 1640 media grown at 37 °C in a humidified CO2 incubator (5% CO2), whereas NIH3T3 cells were a gift from the laboratory of Professor Shaohua Ma and cultured in high glucose DMEM media under the same incubation conditions. For the generation of stable cell lines, FC, FD, FR, TC, TD, and TR were cultured on collagen-coated plates, and FD or TD cells were cultured in media containing 0.1 µM FUL or TAM respectively. All cell lines were tested for the absence of mycoplasma. All media were supplemented with 10% FBS and 100 IU/mL penicillin and 100 μg/mL streptomycin (Life Technologies). These cell models were transfected with empty pIRESneo3-vector (as control) or pIRESneo3-TFF3 plasmid, and the scrambled siRNA (as control) or siRNA targeting TFF3 or BCL228. siRNAs are tabulated in Table S6. Lipofectamine® 3000 Transfection Kit used for plasmid transfection was purchased from Invitrogen (USA).
Western blot analysis
Cells were lysed in RIPA buffer and proteins in the cell lysate were resolved using SDS polyacrylamide gel electrophoresis and visualized with Clarity™ and Clarity Max™ Western ECL Blotting Substrates (BIO-RAD, USA)27. β-ACTIN served as an input control for cell lysates. The primary antibodies used are tabulated in Table S4. The secondary anti-rabbit and anti-mouse horseradish peroxidase (HRP)-conjugated antibodies were obtained from Cell Signaling Technology and are tabulated in Table S5.
Serum, oncogenic, and immunofluorescence (IF) analyses
TFF3 concentrations were measured by Quantikine® ELISA Human TFF3 Immunoassay kit (R&D Systems, USA) according to the manufacturer’s protocol. The cell cycle assessment using Cell Cycle Analysis kit (Beyotime, China), BrdU cell proliferation assay (Millipore, USA), AlamarBlue® viability (Thermo Fisher, USA), total cell number counting using Trypan Blue (BBI, China), foci formation stained with 0.1% Crystal Violet (Sigma, USA), and growth in 3D Matrigel culture (Corning, USA) were performed following the protocols provided by the corresponding manufacturers27. Mammosphere formation was performed in serum free DMEM/F12 medium (EpiZyme, China), supplemented with 10 ng/ml bFGF (Abbkine, China), 20 ng/ml EGF (Abbkine, China) and B27 supplement (1:50) (Gibco, USA). 1000 cells were resuspended in 1 ml medium and seeded into each well of 24-well ultralow attaching plate (Corning, USA) for 10 days incubation. Fluorescence and luminescence were determined using a Tecan microplate reader (TECAN, Switzerland). Phosphatidylserine exposure and apoptotic cell death were assessed by CytoFLEX (Beckman Coulter, USA) using Annexin-V-AF (Alexa Fluor 488) and PI-stained (Neobioscience, China) cells. The gating strategies used herein are demonstrated in Fig. S33. CASPASE-Glo CASPASE 3/7 kit (Promega, China) was performed according to the protocol of Promega27. Live/Dead cell visualization assays were performed using LIVE/DEAD™ Cell Imaging Kit (Thermo Fisher, USA)27. Combination index (CI) analysis was performed using the Chou-Talalay CI method (https://www.combosyn.com/) and SynergyFinder (https://synergyfinder.org/)29. IF analyses were performed using confocal microscopy (Nikon, Japan)30. Information of primary/secondary antibodies used are tabulated in Table S4, S5. Cell nuclei were stained with mounting medium with DAPI (ab104193, Abcam). All functional experiments were performed in medium with 2% FBS unless indicated otherwise.
RNA-sequencing analyses
FC, FD, FR, TC, TD and TR cells were cultured at 80% confluency. Cells were washed with cold PBS and collected in TRIzol reagent (Thermo Fisher, USA) on ice. RNA-sequencing was subsequently performed by BGI (China) using the MGI2000 platform. The sequencing data were filtered with SOAPnuke (v1.5.2) followed by mapping to the reference genome using HISAT2 (v2.0.4). Differential expression analysis was performed using the DESeq2 (v1.4.5) with Q ≤ 0.05. Gene ontology (GO) and KEGG enrichment analysis were performed by Phyper based on a Hypergeometric test. Gene set enrichment analyses (GSEA) were performed using GSEA v3.0 software.
Quantitative PCR (qPCR), bisulfite modification, and chromatin immunoprecipitation (ChIP) assay
qPCR was performed using RNA Extraction kit (Zomanbio, China), Reverse Transcription kit (Yeasen, China), and qPCR kit (Yeasen, China)31. Genomic DNA was bisulfite-treated using the CpGenomeTM Turbo Bisulphite Modification kit from Millipore, USA32. For ChIP assay32, cells were fixed, harvested, and sonicated. 5 μg of SP1 monoclonal antibody (ChIP-grade), C-JUN monoclonal antibody (ChIP-grade), FOXA2 monoclonal antibody (ChIP-grade), SOX5 monoclonal antibody (ChIP-grade), or Rabbit IgG (as control) from Cell Signaling Technology (Singapore) was used. The precipitated DNA was purified and assessed by qPCR. The sequences of the oligonucleotide primers used herein are listed in Table S3.
ALDEFLUOR assay
ALDEFLUOR® assay from Stem Cell Technologies (Canada) is a fluorescent reagent system used for the identification, evaluation, and isolation of stem cells based on the enzymatic activity of ALDH33. After treatment with test compounds for 72 h, cells were harvested, washed and incubated in ALDHEFLUOR assay buffer containing an ALDH substrate (BAAA) with or without the addition of diethylaminobenzaldehye (DEAB), an ALDH inhibitor. Thereafter, percentage of ALDH-positive (ALDH+) cells were determined by flow cytometry. The DEAB-treated cells were used as negative control. The gating strategies used herein are detailed in Fig. S33.
Statistics and reproducibility
Statistical analysis was performed using GraphPad Prism 7.0 (GraphPad Software, San Diego, CA, USA). The statistical differences among subgroup analyses were compared using an unpaired two-tailed Student’s t-test or one-way ANOVA followed by Tukey’s multiple comparisons test. p < 0.05(*), p < 0.01(**) and p < 0.001(***) were considered statistically significant. Function assays were performed independently at least three times with control (DMSO-treated) groups, and quantitative data are expressed as mean ± SEM (n = 3), unless otherwise stated.
Reporting summary
Further information on research design is available in the Nature Portfolio Reporting Summary linked to this article.
Results
Generation of anti-estrogen-therapy induced dormancy-like ER+MC models
The detailed protocol for generation of dormancy-like conditions of ER+MC treated with anti-estrogens FUL and TAM in vivo is summarized in Fig. S1a. Xenograft growth was observed in vehicle-treated (FC and TC) and a drug response in treated groups. In the drug-treated group, half of the animals were randomly assigned to dormancy-like groups (FD and TD respectively) and in the other half, administration of drug was terminated and maintained for longer-term observation as relapse groups (FR and TR) as detailed in Supplementary Note 1. The consistency between xenograft volume and bioluminescent signals in FD or TD xenografts and their capacity to expand after cessation of therapy indicated dormancy during drug administration as demonstrated in Supplementary Note 1 (Figs. 1a, b, S1c)34,35,36,37,38. These observations indicate that the FD or TD xenografts exhibited characteristics of tumor mass dormancy34,35,36,37,38.
To further assess the dormancy-like characteristics of the FD or TD groups, the resected xenografts from all groups were divided into two parts, with one half used for immunohistochemistry (IHC) analysis (Figs. 1c, S2), and the other half cultured on collagen-coated plates to establish respective xenograft derived cell lines (Figs. S1a, S3a). IHC analysis revealed that the FD xenografts exhibited significantly lower percentages of MKI67-positive and PCNA-positive cells compared to either the FC or FR groups. In contrast, FR xenografts showed no significant changes in the percentage of MKI67- and PCNA-positive cells compared to the respective vehicle treated xenografts. These findings indicate that the dormancy-like xenografts exhibited lower proliferative activity whereas the relapse models displayed recovered proliferative capacity. A low p44/42MAPK/p38MAPK activity ratio (increased p-p38MAPK (Thr180/Tyr182)/total p38MAPK ratio with decreased p-p44/42MAPK (Thr202/Tyr204)/total p44/42MAPK ratio) was previously identified as a key molecular characteristic of dormant cancer cells9,10,11,12. Thus, the associated ratios were examined in resected xenografts. The FD xenografts showed an increase in the percentage of p-p38MAPK positive and total p38MAPK positive cells with an elevated p-p38MAPK/total p38MAPK ratio compared to the FC or FR xenografts. Consistently, the percentage of p-p44/42MAPK positive cells decreased and p44/42MAPK positive cells increased generating a reduced p-p44/42MAPK/total p44/42MAPK ratio in FD compared to FC or FR xenografts. This molecular feature was not observed when comparing FC and FR groups (Figs. 1c, S2). Thus, FD xenografts exhibited the molecular features of tumor dormancy compared to FC or FR groups.
Considering that the G0/G1 phase in cell-cycle progression is also associated with tumor dormancy39, the expression of related biomarkers including CDK4, CDK6, and CCND1 were determined39. No significant differences in the percentage of CDK4-positive cells were observed in FD compared to FC xenografts whereas FD xenografts displayed a significantly lower percentage of CDK4-positive cells than FR xenografts. Additionally, FR xenografts exhibited a significantly augmented percentage of CDK4-positive cells compared to FC xenografts. No significant changes in the percentage of CDK6-positive cells were observed between the FD, FC, and FR groups. Interestingly, FD xenografts exhibited a marked increase in the percentage of CCND1-positive cells compared to FC or FR xenografts, yet no significant differences were observed in the CCND1-positive cell percentages of the FR and FC groups.
Stemness-enrichment is another key attribute of ER+MC dormancy7,8. Thus, stemness-related biomarkers, including CD44 and ALDH1A140, were examined. FD xenografts exhibited a significant increase in the percentage of CD44 and ALDH1A1 positive cells compared to FC or FR xenografts (Figs. 1c, S2). No significant differences in the CD44 and ALDH1A1 positive cell populations were observed in FR compared to FC xenografts (Fig. 1c, S2). Similar directional changes were observed in the IHC results of TC, TD, or TR xenografts, with one exception that the TR xenografts exhibited a higher level of total p38MAPK and p44/42MAPK compared to the TD xenografts. Similar to the FD group, TD xenografts exhibited a increased ratio of p-p38MAPK/total p38MAPK and an decreased ratio of p-p44/42MAPK/p44/42MAPK compared to TC or TR xenografts, signifying the molecular feature of tumor dormancy. Hence, the dormancy-like model xenografts exhibited enriched dormancy features in vivo.
For xenograft primary cell culture in vitro, the respective isolated cell models were firstly confirmed to be composed of human-derived MCF7 cells using qPCR (Fig. S3b), immunofluorescence (IF) (Fig. S3c) and RNA sequencing (RNA-seq) analysis (Fig. S3d) as detailed in Supplementary Note 2. To further assess the dormancy attributes of FD and TD cell models at a cellular level, dormancy associated cell cycle features including G0/G1 phase arrest, reduced S phase, and inactive DNA replication6 were validated by cell cycle analysis (Fig. 1d, S3e) and BrdU incorporation assays (Figs. 1e, S4a). In the FD cell lines, there was a significant increase in the percentage of cells in the G0/G1 phase, a marked decrease in the S phase and a noticeable decrease in BrdU incorporation signifying a reduced S phase compared to the FC cell lines41. The G0/G1 or S phase ratios and the percentage of BrdU incorporation in FR cells was not significantly different compared to FC cells. Similar trends in cell cycle and BrdU incorporation analyses were observed in TC, TD, or TR cells.
Therapy-resistance is also a hallmark of therapy-induced dormancy21. Thus, anti-estrogen resistance was evaluated in all cell models (Figs. 1f, S4b). The most resistant FD cells displayed an ~2000-fold higher inhibitory concentration 50% (IC50) value for FUL compared to the most sensitive FC cells (IC50 = 4393.33 ± 162.11 nM vs. IC50 = 2.28 ± 0.20 nM) as determined by total cell number counting assay. Similarly, the most resistant TD cells exhibited an ~150-fold higher IC50 value compared to the most sensitive TC cells (IC50 = 5.19 ± 0.15 nM vs IC50 = 0.034 ± 0.012 nM). Notably, the most resistant FR cells also maintained therapy-resistance and exhibited an ~2000-fold higher IC50 value (IC50 = 4340.00 ± 475.25 nM) than FC cells. Consistently, TR also exhibited therapy resistance showing a 150-fold higher IC50 value (IC50 = 5.15 ± 0.15 nM) than TC cells (Figs. 1f, S4b). Similar directional changes were also observed in other FC, FD, FR and TC, TD, and TR cell sets (Fig. S4b). Based on the relatively similar cellular gene expression patterns within the two xenograft derived cell lines of each group, as observed in principle component analysis of RNA-seq data (Fig. S4c), one representative cell model was identified from each group for further cell and animal-based analyses. The selected FD or TD models exhibited the highest G0/G1 ratio, the lowest S ratio and DNA replication activity, and the highest level of drug resistance within their respective drug-treated groups. Also, the FR or TR models that displayed the most resistance to anti-estrogens within their corresponding groups were utilized. Hence, the representative FC or TC cells displayed the opposite attributes to their respective drug-treated cells.
Another key dormancy-related attribute, stemness-like behavior of these MC models was next assessed8. Larger mammosphere size and a significant increase in mammosphere number were generated by FD or TD cells compared to the respective FC/FR or TC/TR cells, whereas there were no such significant changes in FR or TR cells compared to the respective controls (Fig. S4d). The percentages of ALDH-positive cells were further determined in FC/FD/FR or TC/TD/TR cells using the ALDEFLUOR assay (Fig. S4e). The results showed that FD or TD cells exhibited a significantly higher population of ALDH-positive cells compared to their corresponding control and relapse cells (FD vs FC vs FR % = 10.27 ± 5.33 vs 2.37 ± 1.34 vs 1.01 ± 0.45, TD vs TC vs TR % = 20.37 ± 1.06 vs 5.94 ± 0.28 vs 6.73 ± 1.08), as demonstrated in Fig. S4e. No significant differences in ALDH-positive cell populations were observed in either FR or TR compared to their corresponding controls. The in vitro dormancy attributes of the cell lines induced by anti-estrogens at a molecular level were further determined by RNA-seq (Fig. S5a, S5b, S5c, S8), qPCR (Fig. 1g, S5d) and Western blot analyses (Fig. 1h, S5e, S34) as detailed in Supplementary Note 3.
After validation of the dormancy-related features of the FD or TD xenografts in vivo and in vitro above, the in vivo behavior of the respective cell lines was determined, as pertaining to metastasis, relapse, and survival1,2,3, by injecting the respective cell lines into immunocompromised mice via the tail vein. Ovariectomized female BALB/c athymic mice were injected with FC, FD or FR cells and animals with intact ovaries were injected with TC, TD, or TR cells, respectively (n = 6) (Fig. S1a). It was observed that mouse body weight in the FD and FR groups at the 5th or 7th week respectively or TD and TR at the 2nd or 3rd week respectively post tail vein injection decreased significantly compared to the FC or TC groups, respectively (Fig. S5f). Metastatic signals were determined using bioluminescence imaging. The FD or TD groups exhibited stronger metastatic signals in the lung and brain compared to the other respective groups at 2 weeks post tail vein injection before the first natural death (Fig. S5g). FR or TR groups did not display greater metastatic signals than the corresponding FC or TC groups. Kaplan–Meier curves were plotted for the mice utilizing natural death or a humane endpoint (rapid body weight loss) to estimate overall survival (OS). The median OS of the FD or TD groups was significantly worse than that of the FC/FR or TC/TR groups, respectively (FD-OS = 6 weeks vs. FC-OS = 26 weeks or FR-OS = 15 weeks, TD-OS = 4.5 weeks vs. TC-OS = 12.5 weeks or TR-OS = 6.5 weeks, p < 0.01) (Fig. 1i). FR or TR group mice exhibited shorter median OS than the respective FC or TC groups. Hence, the FD or TD models exhibited a greater metastatic burden resulting in worse survival outcomes. Therefore, the FD or TD cell models generated by in vivo anti-estrogen treatments exhibited enriched dormancy associated attributes21,34,35,36,37,38, producing a worse survival outcome in vivo compared to the FC/FR or TC/TR groups, respectively.
Epigenetic regulation of TFF3 maintains a dormancy-associated phenotype
During clinical tumor dormancy, tumor mass dormancy and cellular dormancy co-exist in vivo and are functionally associated with proximate microenvironmental niches4,5. Secreted proteins in the extracellular space have been reported to maintain the dormancy state and play pro-survival roles in dormant cancer cells6. To identify potential extracellular-space-related protein candidates, which may function in FD or TD models, a detailed RNA sequencing analysis was performed as outlined in Fig. S6a. By employing a Venn plot (Fig. 2a), six genes were initially identified that were commonly upregulated in FD or TD cells compared to their respective FC or TC cells (Standard: Fold change ≥ 2, Q ≤ 0.001, in the BGI extracellular space gene set). Among these genes, TREFOIL FACTOR 3 (TFF3) was observed to exhibit the highest differential expression in FD or TD cells compared to the corresponding FC or TC cells, as depicted in the heatmap (Fig. 2b). Consistently, TFF3 was upregulated with the greatest significance in FD compared to FC cells, as indicated in the differential gene expression volcano plot (Fig. 2c). Similarly, TFF3 showed significant upregulation in TD cells compared to TC cells (Fig. 2c). Furthermore, the expression level of TFF3 in FR or TR cells also surpassed that in their corresponding control cells yet TFF3 expression remained lower than in FD or TD cells (Fig. S6b), suggesting a potential continued function of TFF3 in disease progression in the relapse phase. TFF3 mRNA levels measured by qPCR were observed to be significantly increased in FD or FR compared to FC cells whereas no significant difference was observed between FD and FR cells (Fig. S11a). Consistently, cellular TFF3 protein expression in vitro and secreted TFF3 in the culture medium supernatant, were markedly elevated in FD or FR compared to FC samples (Figs. 2d, S11c, S34) whereas the TFF3 protein level did not exhibit significant difference between FD and FR cells. Similar directional changes were observed in qPCR and Western blot in TC, TD, or TR cells (Figs. 2d, S11a, S11c, S34). Subsequently, the expression of TFF3 was analyzed using IHC in orthotopic xenografts. TFF3 immunoreactive score (IRS) and TFF3-positive cell percentage were both significantly elevated in FD or FR xenografts compared to FC xenografts whereas FD did not display a significant difference in TFF3 IRS or TFF3-positive cell percentage compared to FR xenografts (Fig. 2e, S11b). Additionally, serum levels of human (h)TFF3 were measured in serum derived from host animals (Fig. S11d). Relative hTFF3 levels, normalized to xenograft volume, increased in the FUL-treated groups (FD or FR), whereas the vehicle-treated group (FC) exhibited relatively stable normalized hTFF3 serum levels (Fig. 2f). FD and FR models exhibited significantly higher normalized hTFF3 serum levels than the FC group at the collection endpoint. No significant difference was observed in normalized hTFF3 serum levels between FD and FR models. Moreover, serum was also collected two weeks after injection of the respective cell lines into host mice via the tail vein and the serum levels of hTFF3 were determined. The FD and FR group exhibited significantly higher serum hTFF3 levels than the FC group (Fig. 2g). hTFF3 levels did not exhibit significant differences between the FD and FR groups. Similar directional changes were observed in IHC and ELISA in the TC, TD, or TR groups. These analyses identified TFF3 as a candidate target which may play crucial roles in the dormancy-like models. TFF3-associated transcriptional changes specific to FD or TD cells were further examined compared to other cell models as detailed in Supplementary Note 4.
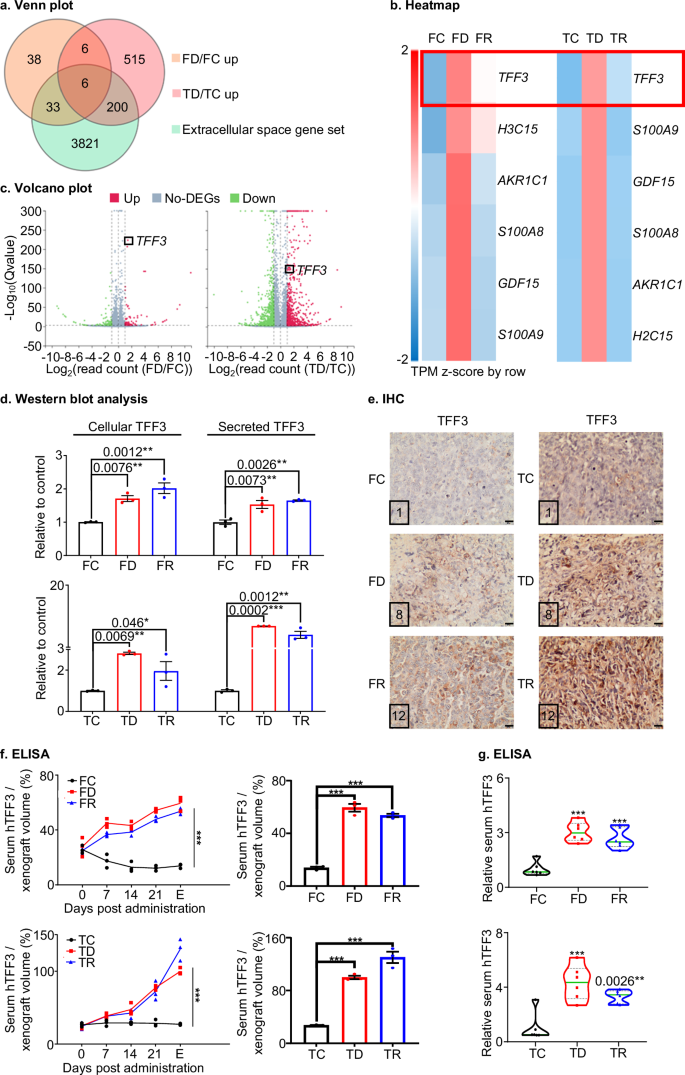
a Venn plot: A Venn plot was generated by identifying common genes in upregulated FD/FC or TD/TC gene sets with extracellular space gene sets. The genes were considered with fold change ≥2 and false discovery rate (FDR)/Q value ≤ 0.001. Cells were cultured in 10% FBS containing medium (b) Heatmap: A heatmap was constructed to cluster gene expression (mRNA TPM) of the six common genes (identified in a) in control (FC/TC), dormancy-like (FD/TD), or relapse (FR/TR) cells. The data were standardized using the z-score method in the row direction. c Volcano plot: A volcano plot was created to show differentially expressed genes (DEGs) between FD/FC or TD/TC cells with fold change ≥2 and FDR/Q value ≤ 0.001. The X-axis represents Log2 transformed difference multiplier values, and the Y-axis represents -Log10 transformed significance (Q) values. Red represents up-regulated DEGs, blue represents down-regulated DEGs, and gray represents non-DEGs. d Western blot analysis: The densitometric analysis of protein blots was performed using ImageJ software (https://imagej.nih.gov/ij/) to assess the statistical changes between the groups in Western blot analysis in Fig. S11c (Fig. S34). Statistical analysis was performed using a one-way ANOVA followed by Tukey’s multiple comparisons test (n = 3). e IHC: The expression of TFF3 was assessed in resected xenografts of FC, FD, FR, TC, TD, or TR groups using IHC and the immunoreactive score of each representative figure is presented in their bottom left corner. The images were captured at a magnification of ×200, with a scale bar of 20 μm. f ELISA: ELISA was performed for host animal serum levels of human (h)TFF3 (derived from xenografts) (n = 3). The FD or FR groups were subcutaneously treated with 250 mg/kg Fulvestrant per week and the TD or TR groups were treated intraperitoneally with 30 mg/kg of Tamoxifen twice a week for 4 weeks. The FC and TC groups received the corresponding vehicles for 4 weeks. Blood was collected weekly during administration. Serum hTFF3 concentration (pg/ml) normalized to xenograft volume (mm3) is represented in a folding line chart. The right bar chart represents the normalized serum hTFF3 levels of host animal at the endpoint (E). Statistical analysis was performed using a one-way ANOVA followed by Tukey’s multiple comparisons test. g ELISA: ELISA was used to determine the serum levels of human (h)TFF3 in mice injected with FC/FD/FR and TC/TD/TR cells through the tail vein (n = 6). All measurements were normalized to the average of hTFF3 levels in the corresponding control groups as relative serum hTFF3. Statistical analysis was performed using a one-way ANOVA followed by Tukey’s multiple comparisons test. The symbols (*) indicate statistical significance compared to the corresponding control group. p < 0.05(*), p < 0.01(**) and p < 0.001(***) were considered statistically significant. p < 0.0001, unless indicated otherwise.
To determine if TFF3 is associated with dormancy-related attributes induced by anti-estrogen therapy in FD or TD cells, experiments were conducted involving the forced expression of TFF3 or the depletion of TFF3 in FD or TD cells using three TFF3-targeted siRNAs (Fig. S11e, S11f, S12a, S12b, S13a, S34). The efficiency of TFF3 depletion or forced expression and the impact on TFF3 mRNA and intra- and extra-cellular protein levels were assessed using qPCR and Western blot, respectively (Fig. S11e, S11f, S12a, S12b, S13a, S34). Assessing dormancy-associated biomarkers, the forced expression of TFF3 in FD or TD cells led to increased mRNA and protein levels of the proliferation biomarkers MKI67 and PCNA whereas depletion of TFF3 in FD or TD cells reversed the effect. Moreover, forced expression of TFF3 elevated the levels of phosphorylated p38MAPK and p44/42MAPK, whereas total p38MAPK and p44/42MAPK mRNA and protein expression remained relatively unaffected in these cells. Consistently, depletion of TFF3 reduced p-p38MAPK and p-p44/42MAPK levels without significantly altering total p38MAPK and p44/42MAPK mRNA and protein expression in FD or TD cells. As to cell cycle biomarkers, forced expression of TFF3 increased the level of pRB and also the expression CCND1. In contrast, TFF3 did not significantly alter RB, CDK4, or CDK6 mRNA or protein expression in FD or TD models. Conversely, TFF3 depletion suppressed the level of pRB and CCND1 expression, whereas RB, CDK4, and CDK6 expression were not significantly changed in the dormancy-like models. Forced expression of TFF3 increased the mRNA and protein levels of CD44 and ALDH1A1, whereas the levels decreased in TFF3-depleted cells (Figs. S11f, S12b, S13a, S34). These findings demonstrated a positive association between TFF3 expression with dormancy-related biomarkers in the dormancy-like models.
As tumor dormancy contributes to metastatic outgrowth and worse survival outcomes1,2,3, the correlations of TFF3 levels with host animal metastasis and survival or patient prognosis under anti-estrogen therapy were further analyzed and as detailed in Supplementary Note 5. The data indicated elevated TFF3 expression predicted a greater metastatic burden and shorter survival time in the animals hosting dormancy-like models (Fig. S13b). Similarly, higher TFF3 mRNA levels were positively correlated to worse prognosis in ER+ patients on/post anti-estrogen treatment including a worse distant metastasis- and recurrence- free survival (Fig. S13c). Thus, increased TFF3 expression was associated with clinical dormancy behavior.
The retention of dormancy-like behavior associated with increased TFF3 expression in dormant cancer cells isolated from the respective xenografts suggested a stable phenotypic change compared to cells in vehicle treated controls. Given that TFF3 transcription is CpG island methylation regulated32,42, potential epigenetic regulation of TFF3 was examined in all cell models. It was previously reported that TAM-induced hypomethylation of the TFF3 proximal promoter (transcriptional regulatory region) enhanced transcription of TFF3 in endometrial carcinoma cells32. The methylation status of the proximal TFF3 promoter was therefore examined in all cell models using methylation-specific PCR after genomic bisulfite modification. It was observed that the TFF3 promoter was significantly hypomethylated in FD and FR cells as compared to FC cells (Fig. S14a). Considering that hypomethylation of the TFF3 promoter may enhance transcription of TFF3 by influencing the binding of transcription factors (TFs), the TFs which may regulate TFF3 expression were further determined32. The binding sites of four TFs including c-JUN, SP1, FOXA2, and SOX5 were identified in the TFF3 promoter sequence in a previous study32. Chromatin immunoprecipitation (ChIP) assays were performed to determine the interaction between the four TFs with the TFF3 promoter32. c-JUN and SP1 proteins demonstrated significantly increased interaction with their respective binding sites on the TFF3 promoter in FD and FR cells compared to FC cells (Fig. S14b). FOXA2 and SOX5 proteins exhibited a slight but not significantly enhanced interaction in FD and FR cells compared with FC cells. Similar directional changes in methylation status and transcription factor interaction of the TFF3 promoter were observed in TC, TD, or TR cells under the same conditions (Fig. S14a, b). These observations suggested that the epigenetic change via TFF3 promoter hypomethylation allowed maintenance of TFF3 expression and potentially the phenotypic alterations associated with cancer cell dormancy. To further examine potential methylation-associated epigenetic factors, the genes of DNA methyltransferases such as DNMT1, DNMT3A, DNMT3B, and histone methyltransferases EZH1, EZH2 were examined in RNA-seq data from all cells (Fig. S14c). Only DNMT1 or EZH1 were commonly down-regulated in FR or TR cells whereas no such changes were observed in FD or TD cells compared to FC or TC cells, respectively (Fig. S14c).
TFF3 promotes the survival of dormancy-like ER+MC models in a BCL2-dependent manner
TFF3 has previously been demonstrated to promote cancer cell survival in ER+MC43. Hence, the potential functional roles of TFF3 in cell survival in dormancy were further determined. The efficiency of TFF3 depletion or forced expression at the protein level were assessed in all cell models using Western blot (Figs. S12a, S34). Forced expression of TFF3 led to an increase in total cell number (Fig. 3a). Conversely, siRNA mediated TFF3 depletion reduced total cell number in all cell lines examined. The total cell number of TFF3-depleted FD or TD cells, as assessed by using three different siRNAs, decreased more significantly over time compared to respective FC/FR or TC/TR cells. (Fig. 3a). Furthermore, total cell number counting assays showed that forced expression of TFF3 rendered anti-estrogen sensitive FC and TC cells more resistant to both FUL and TAM. The IC50 values for FUL and TAM were ~1600 and ~100-fold higher than vector-transfected FC and TC cells (FC: IC50 = 3667.67 ± 166.06 nM vs IC50 = 2.34 ± 0.10 nM, TC: IC50 = 8.14 ± 0.22 µM vs IC50 = 0.078 ± 0.010 µM) (Figs. 3a, S15a), respectively. Furthermore, TFF3-depleted anti-estrogen-resistant FD or TD cells showed ~2000 and ~60-fold lower IC50 values than corresponding vehicle-treated cells (FD: IC50 = 0.48 ± 0.035 nM vs IC50 = 970.32 ± 31.76 nM, TD: IC50 = 0.086 ± 0.021 µM vs IC50 = 4.81 ± 0.16 µM) (Figs. 3a, S15a). These findings suggested that TFF3 contributed to cell survival under anti-estrogen treatment.
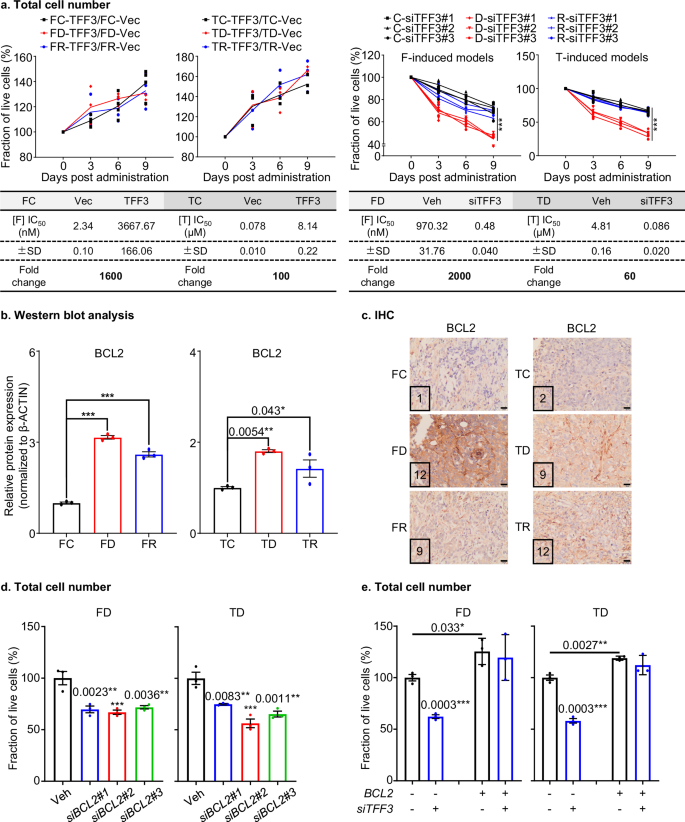
a Total cell number: Top: For live cell fraction analysis, dose-response curves were generated for FC, FD, FR, TC, TD, or TR cells with forced expression or siRNA-mediated depletion of TFF3 (n = 3). The fraction (%) of live cells was assessed by counting the total number of cells. Additionally, the IC50 values were calculated for the indicated cells by treatment with the indicated concentrations of Fulvestrant (F) or Tamoxifen (T) for 72 h (Fig. S15a) (n = 3). Statistical analysis was performed using a one-way ANOVA followed by Tukey’s multiple comparisons test. b Western blot analysis: A densitometric analysis of Western blot was performed as described in Fig. S16a (Fig. S34). Protein blots were analyzed using ImageJ software (https://imagej.nih.gov/ij/) to determine the densitometric measurements. Statistical analysis was performed using a one-way ANOVA followed by Tukey’s multiple comparisons test (n = 3). c IHC: IHC was performed to evaluate the expression of BCL2 in resected xenografts of the FC, FD, FR, TC, TD, or TR groups, following the described methods. The Immunoreactivity scores (IRS) of each representative figure is shown in the bottom left corner. The images were captured at a magnification of ×200, with a scale bar of 20 μm. d Total cell number: The FD or TD cells were treated with scrambled siRNA (Vehicle=Veh) and three siRNA depleting BCL2 for 72 h. The fraction (%) of live cells was assessed by counting the total number of cells. Statistical analysis was performed using a one-way ANOVA followed by Tukey’s multiple comparisons test (n = 3). e Total cell number: The FD-BCL2, TD-BCL2 cells or the corresponding control cells were treated with scrambled siRNA (Vehicle) or siRNA depleting TFF3 for 72 h. The fraction (%) of live cells was assessed by counting the total number of cells. Statistical differences between groups were analyzed using an unpaired two-tailed Student’s t-test (n = 3). The symbols (*) indicate statistical significance compared to the corresponding control group. p < 0.05(*), p < 0.01(**) and p < 0.001(***) were considered statistically significant. p < 0.0001, unless indicated otherwise.
To further investigate the pro-survival mechanism of TFF3 in anti-estrogen-therapy induced dormancy-like ER+MC models, an enriched KEGG pathway analysis was performed, to identify differentially expressed genes in TFF3 associated gene sets (defined by BGI) in FD or TD models compared to their corresponding control and relapse models (Fig. S15b). Among these pathways, the PI3K/AKT pathway, known for mediating cancer cell survival, showed enrichment of the most differentially expressed genes44. Enhanced AKT activation (as indicated by elevated pAKT (Thr308) and pAKT (Ser473)) was reported to contribute to cancer cell survival under anti-estrogen therapy45,46,47,48. FD or FR cells exhibited significantly elevated pAKT (Thr308) and pAKT (Ser473) level compared to FC cells, whereas FD cells did not display significant differences in AKT phosphorylation compared to FR cells (Fig. S15c, S34). There were no significant differences in total AKT expression amongst these cell lines. Similar directional changes in pAKT (Thr308 and Ser473) and AKT levels were observed in TC, TD, or TR cells. Considering that PI3K/AKT signaling enhances the expression of the anti-apoptotic protein BCL249, which mediates TAM resistance50, and TFF3 has been shown to promote cell survival in human mammary epithelial and carcinoma cells by enhancing BCL2 expression51, BCL2 expression was analyzed in RNA-seq data (Fig. S15d). Increased BCL2 expression was observed in FD and FR cells in the RNA seq analysis compared to FC cells (Fig. S15d). qPCR assay also confirmed elevated BCL2 mRNA levels in FD or FR cells compared to FC cells (Fig. S15e) and no significant changes between FD or FR cells. As shown in Figs. 3b, S16a (Fig. S34), BCL2 protein levels were significantly increased in FD and FR cells compared to FC cells with no marked differences in FD compared to FR cells. Similarly, BCL2 expression was significantly elevated in the FUL-treated orthotopic xenografts, including FD or FR, compared to the vehicle-treated FC group and FD did not exhibit significant differences in BCL2 expression compared to FR xenografts using IHC analysis (Fig. 3c, S16b). Similar directional changes were observed in RNA-seq, qPCR, Western blot and IHC results in TC, TD, or TR groups. These consistent changes in BCL2 and TFF3 levels suggest a functional relationship between TFF3 and BCL2 in FD/TD or FR/TR cells. In addition, the expression of other related BCL2 family members, including anti-apoptotic BCL-XL and pro-apoptotic BAX, BAK, BID, and BIM50 were analyzed in RNA-seq data from all cell models. However, no consistent trends between the expression of these genes and TFF3 levels were consistently observed in either FUL or TAM induced groups (Fig. S16c).
Forced expression of TFF3 elevated pAKT (Thr308) and pAKT (Ser473) levels in FD and TD cells, and TFF3 depletion reversed this effect (Fig. S12b, S13a, S34). No significant changes in total AKT expression were observed after TFF3 forced expression or depletion (Figs. S12b, S13a, S34). BCL2 is a downstream pro-survival effector of AKT signaling and BCL2 mRNA and protein levels were positively correlated with TFF3 levels, as demonstrated through forced expression and siRNA depletion assays in FD or TD cells (Figs. S11f, S12b, S13a, S34). Therefore, it was further determined whether TFF3 contributed to cell survival in a BCL2-dependent manner. FD or TD cells were transiently transfected with three siRNAs to deplete BCL2 or scrambled siRNA as control (Fig. S16d, S34). siRNA-mediated depletion of BCL2 significantly decreased cell number in FD or TD cells (Fig. 3d). FD or TD cells treated with ABT-199 or ABT-263 (BCL2 inhibitors) demonstrated similar effects as siRNA mediated depletion of BCL2, exhibiting a decreased cell number (Fig. S16e). FD or TD cells exhibited decreased cell number and augmented apoptotic cell percentages after siRNA mediated TFF3 depletion, whereas no significant reduction in cell number or increase in apoptotic cell percentages was observed in FD or TD cells with TFF3 depletion after forced expression of BCL2 (Fig. S16f, S34), indicating that BCL-2 mediates TFF3 promoted cell survival (Fig. 3e, S16g). The correlations of BCL2 levels with cell cycle biomarkers in all cell models were further analyzed and as detailed in Supplementary Note 6, which indicated an association of cell survival with cell cycle progression (Fig. S16h).
Pharmacological inhibition of TFF3 decreases survival of dormancy-like ER+MC models
The possibility of depleting residual dormancy-like FD or TD cells was next examined by exploring the pharmacological inhibition of TFF3 alone or in combination with various anticancer agents as potential treatment strategies. A small molecule inhibitor of TFF3 (AMPC) has been characterized43. Therefore, AMPC was utilized to examine the effect of pharmacological inhibition of TFF3 in FD or TD cells (Figs. 4a, S17). Using Western blot analysis (Figs. S18a, S34), AMPC exhibited dose-dependent effects to decrease the levels of intracellular and secreted TFF3 in FD or TD cells. Treatment of FD or TD cells with AMPC triggered apoptosis, exhibiting increased CASPASE(CASP)3/7 activity (Fig. S18b), and enhanced apoptotic cell percentages as determined by flow cytometry analysis (Fig. S18d). Moreover, AMPC treatment decreased cell number on monolayer determined by total cell number counting (Figs. 4a and S17) and impaired foci formation (Fig. S18c). AMPC also inhibited 3D colony growth in Matrigel as indicated by increased red fluorescence and decreased green fluorescence (Fig. S19a) and reduced cell viability in 3D culture using an AlamarBlue assay (Fig. S19a). Additionally, AMPC suppressed the percentage of the ALDH-positive cell population in FD or TD cell lines (Fig. S19b).
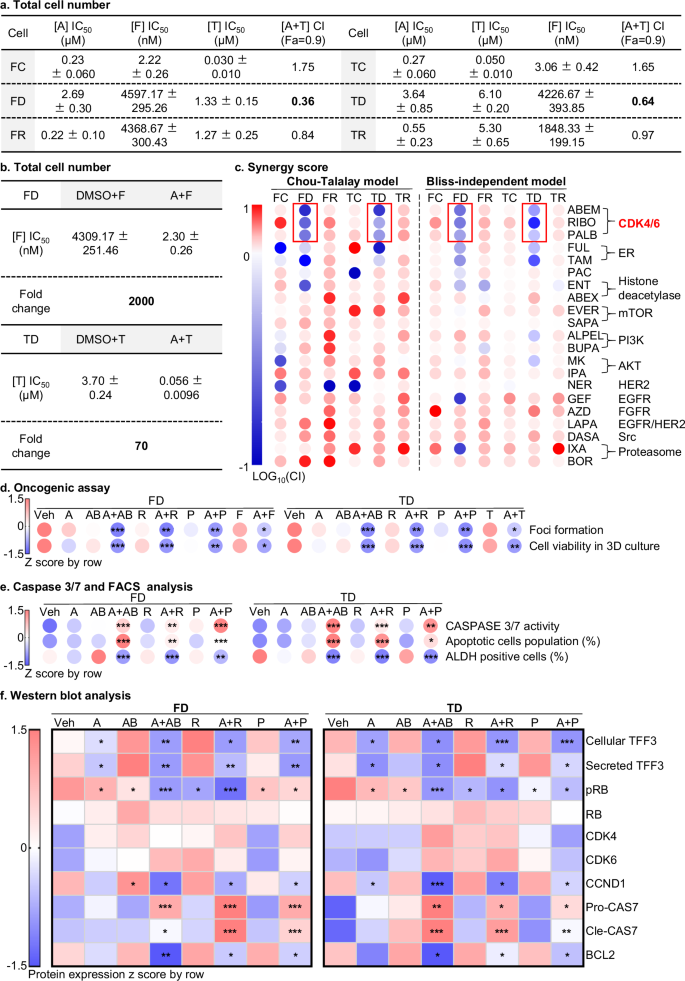
a Total cell number: GraphPad Prism was used to generate an IC50 and combination index (CI) table for FC, FD, FR, TC, TD, or TR cells treated with the indicated concentration of AMPC, Fulvestrant (F), or Tamoxifen (T) for 72 h (Fig. S17) (n = 3). Chou-Talalay analysis assessed the combination of AMPC (A) with FUL or TAM. The fraction (%) of live cells was determined by counting the total number of cells. CompuSyn software was used to calculate the logarithmic CI values corresponding to the cell fraction affected (Fa) as described in the methods section. CI value of <1 indicated synergism, =1 indicated additive synergy, and >1 indicated antagonism. b Total cell number: Using GraphPad Prism software, the IC50 values and fold change were calculated for FD or TD cells treated with indicated concentrations of Fulvestrant (F) or Tamoxifen (T) for 72 h (Fig. S20c) (n = 3). c Synergy score: The heatmap represents the combination index of AMPC with all drugs in the Table S1 drug list (Fa=0.9) using Chou-Talalay (left) and Bliss-independent models at 1 µM AMPC (right) in FC, FD, FR, TC, TD, or TR cells treated with indicated concentration of agents for 6 days (Fig. S21, S22) (n = 3). d Oncogenic assay: the heatmap shows foci formation of Fig. S26a, cell viability fraction in 3D growth determined by AlamarBlue assay. FD or TD cells were treated with vehicle (Veh), 1 µM AMPC (A), 1 µM Tamoxifen (T), 1 µM Fulvestrant (F), CDK4/6 inhibitors (Abemaciclib = AB 1 µM, Ribociclib = R 10 µM, Palbociclib = P 1 µM) and combinations thereof for 10 days. Statistical analysis was performed using a one-way ANOVA followed by Tukey’s multiple comparisons test (n = 3). e Caspase 3/7 and FACS analysis: The heatmap represents CASPASE 3/7 activity, fluorescence-activated cell sorting (FACS) analysis of annexin-V and propidium iodide (PI) staining of apoptotic cell death and ALDH-positive cell population in FD or TD cells. CASPASE 3/7 activity was evaluated using the ApoTox-Glo Triplex Assay Kit in FD or TD cells treated with vehicle (Veh), 1 µM AMPC (A), 1 µM Abemaciclib (AB), 10 µM Ribociclib (B), 1 µM Palbociclib (P) and combinations thereof for 10 days in 3D Matrigel culture. Cells were treated for 72 h to measure apoptosis. The ALDH-positive cell population was determined using the ALDEFLUOR assay after exposure to the treatments for 48 h. Statistical analysis was performed using a one-way ANOVA followed by Tukey’s multiple comparisons test (n = 3). f Western blot analysis: A heatmap was generated using quantification data of Western blot analysis to evaluate the levels of markers as shown in Fig. S29 (Fig. S34). The data were standardized using the z-score method in the row direction. Statistical analysis was performed using a one-way ANOVA followed by Tukey’s multiple comparison tests (n = 3). The quantitative data are expressed as mean ± SD. The symbols (*) indicate statistical significance compared to the corresponding control group. p < 0.05(*), p < 0.01(**) and p < 0.001(***) were considered statistically significant.
The efficiency of TFF3 inhibition mediated by AMPC in all models was assessed using Western blot (Fig. S20a, S34). Next, the effect of AMPC was further determined using total cell number counting assay (Figs. 4a, S17). The FD and TD cell lines exhibited higher IC50 values for AMPC compared to the corresponding FC/FR or TC/TR models (FD: IC50 = 2.69 ± 0.30 µM vs FC: IC50 = 0.23 ± 0.060 µM, FR: IC50 = 0.22 ± 0.10 µM; TD: IC50 = 3.64 ± 0.85 µM vs TC: IC50 = 0.27 ± 0.060 µM, TR: IC50 = 0.55 ± 0.23 µM) (Fig. 4a, S17). As limitation of AMPC efficacy in FD or TD models was observed, the efficacy of AMPC in combination with anti-estrogen treatments was further determined using the total cell number counting assay. Synergy, as determined by both Chou-Talalay and HAS analyses, were observed only in FD or TD cells as detailed in Supplementary Note 8 (Figs. 4a, S20b). Based on the synergy of AMPC-FUL or AMPC-TAM combinations observed in FD or TD cells, the effect of AMPC on the IC50 values of FUL in FD cells and TAM in TD cells were further evaluated. Total cell number counting assay was performed (Figs. 4b, S20c) and the combination of AMPC (1 µM) with FUL significantly increased the efficacy of FUL compared to FUL mono-treatment in FD cells. Similarly, treating TD cells with AMPC (1 µM) and TAM resulted in increased TAM efficacy compared to TAM treatment alone as detailed in Supplementary Note 9. These results demonstrate that AMPC sensitizes FD or TD cells to FUL or TAM, respectively. Furthermore, AMPC attenuated FUL-resistance or TAM-resistance observed in the respective FR or TR cells, whereas the IC50 fold change of these agents effected by AMPC were smaller compared to the corresponding FD or TD cells, as detailed in Supplementary Note 9.
To further explore AMPC-based therapeutic strategies, the most commonly used drugs or clinical-trial agents, for the treatment of advanced and anti-estrogen-therapy-progressed ER+MC patients, were listed (Table S1). Screening of AMPC in combination with the listed drugs (Table S1) was performed to assess combination efficacy in FD or TD cells. By employing Chou-Talalay analysis (Fig. 4c), a Log10(CI) heatmap was generated at Fa=0.9. Of the 21 small molecules examined, only the 3 CDK4/6 inhibitors (CDK4/6is) (Abemaciclib (ABEM), Ribociclib (RIBO), and Palbociclib (PALB)) and anti-estrogen-therapy agents (FUL and TAM) demonstrated synergy with AMPC in both FD and TD models. From the CI curve, the median combination value of combined doses of the AMPC-CDK4/6is and AMPC-FUL/TAM was lower than 1, indicating a synergistic effect within the Fa 0.5–0.95 range in both FD and TD models (Figs. 4c, S21, S24). Notably, among all the three CDK4/6is, ABEM combined with AMPC, demonstrated the lowest CI, indicating the highest synergy (CI = 0.75 in FD, CI = 0.70 in TD, Fa = 0.9) compared to the other two CDK4/6is (Fig. 4c, S21). Moreover, using the Bliss-independent model, the synergy of various combination therapies was further analyzed (Fig. 4c). Consistently, the three CDK4/6is and the anti-estrogenic compounds (FUL/TAM) exhibited synergy with 1 µM AMPC in both FD and TD models (Fig. 4c). The dose-response curves (Fig. S22), IC50 values (Fig. S23), and combination index curves (Fig. S24) of other drugs listed in Table S1 are presented. siRNA-mediated TFF3 depletion sensitized the response of FD or TD cells to the three CDK4/6is and respective anti-estrogen agents, signified as lower IC50 (Fig. S25). AMPC did not significantly further influence cell survival at concentrations ranging from 0.001 to 10 µM in TFF3-depleted FD or TD cells. Additionally, there was no observed synergy between AMPC and CDK4/6is or anti-estrogen therapy agents in TFF3-depleted FD or TD cells (Fig. S25). Thus, the synergy observed between AMPC and the CDK4/6is is dependent on TFF3 expression.
The effect of single agents and combined AMPC-CDK4/6i treatment on 2D anchorage independent growth and 3D growth of FD or TD cells were evaluated by foci formation and 3D-matrigel growth respectively (Figs. 4d, S26a, b). Compared to vehicle-treated FD cells, the treatment of FD cells with single agents (AMPC, CDK4/6is, or FUL) reduced the capacity for foci formation (Figs. 4d, S26a), and decreased 3D growth as indicated by enhanced red fluorescence and reduced green fluorescence and decreased viability in FD cells in 3D culture (Figs. 4d, S26b). Notably, the AMPC-CDK4/6i or AMPC-FUL combined treatments in FD cells further abrogated foci formation and growth and cell viability in 3D culture when compared to treatment with AMPC, CDK4/6is or FUL alone (Figs. 4d, S26a, b). Amongst the combination treatments, the improved efficacy of AMPC-CDK4/6is was more significant than that of AMPC-FUL/TAM compared to the respective vehicle-treated cells, and among the three CDK4/6is based combination, AMPC-ABEM was particularly significant in FD cells across the two functional assays examined compared to vehicle-treated group as detailed in Supplementary Note 10.
The treatment of FD cells, either singly with AMPC or CDK4/6is enhanced CASPASE 3/7 activity, increased the population of apoptotic cells, and reduced the percentage of ALDH-positive cells compared to vehicle-treated FD cells (Figs. 4e, S27, S28). The combination of AMPC-CDK4/6is in FD cells further increased CASPASE 3/7 activity, augmented apoptosis, and decreased the percentage of ALDH-positive cells compared to single treatments (Figs. 4e, S27, S28). Similar directional changes were observed in CASPASE 3/7 activity, apoptosis, and ALDH activity in TD cells. Consistently, the improved efficacy of AMPC-ABEM was particularly significant in FD or TD cells across these assays (Fig. 4d, e).
Western blot analysis was then employed to investigate the underlying mechanism of the AMPC-CDK4/6i combination synergy observed in FD or TD cells (Figs. 4f, S29, S34). In FD cells, treatment with AMPC resulted in significantly decreased levels of both cellular and secreted TFF3 compared to vehicle-treated cells as expected43 whereas no significant changes in TFF3 levels were observed in FD cells treated with CDK4/6is. When FD cells were treated with the AMPC-CDK4/6i combination, the levels of TFF3 in both cells and the medium were further reduced compared to cells treated with either AMPC or CDK4/6is alone. CDK4/6is function by inhibiting CDK4/6 kinase activity, thereby suppressing the phosphorylation of the downstream Retinoblastoma (RB) protein signified as a decreased pRB (Ser807/811) level and a reduced pRB (Ser807/811)/RB ratio52. Hence, the levels of pRB (Ser807/811), total RB protein, CDK4 and CDK6 were assessed. Single treatment of FD cells with AMPC or CDK4/6i significantly decreased the pRB level whereas total RB expression was not significantly altered producing a reduced ratio of pRB/RB compared to vehicle-treated cells. The combination of AMPC with CDK4/6 inhibition further decreased the pRB level and the ratio of pRB/RB in FD cells. Notably, no significant changes were observed in the levels of CDK4 and CDK6 in all FD samples. Given that TFF3 was reported to increase expression of CCND1 in ER+MC cells51, CCND1 expression was next determined. Treatment of FD cells with AMPC led to a significantly reduced CCND1 level compared to vehicle-treated cells. However, there were no significant changes in CCND1 levels in CDK4/6i-treated cells (Fig. 4f, S29, S34). Importantly, the combined AMPC-CDK4/6i treatment of FD cells exhibited further decreased levels of CCND1 protein compared to FD cells treated with either AMPC or CDK4/6i alone (Fig. 4f, S29, S34).
Treatment of FD cells with AMPC and a CDK4/6i (RIBO) resulted in increased pro-CASPASE7 (CASP7) levels whereas the other two CDK4/6i (ABEM and PALB) slightly decreased pro-CASP7 levels compared to vehicle-treated FD cells. Both AMPC and CDK4/6i treatments elevated the levels of cleaved-CASP7. Combined AMPC-CDK4/6i treatment of FD cells provoked a further increase in both pro-CASP7 and cleaved-CASP7 protein levels compared to FD cells treated with either AMPC or CDK4/6is alone (Figs. 4f, S29, S34).
Considering that TFF3 stimulated MC cell survival is mediated by BCL251, and TFF3 promotes FD or TD cell survival in a BCL2-dependent manner, the expression of BCL2 was further assessed. AMPC treatment of FD cells led to decreased levels of BCL2 protein, whereas CDK4/6is treatment did not significantly reduce BCL2 expression compared to vehicle-treated cells (Figs. 4f, S29, S34). Notably, the combined AMPC-CDK4/6i treatment of FD cells exhibited further decreased BCL2 protein levels compared to FD cells treated with either AMPC or CDK4/6i alone (Figs. 4f, S29, S34). Similar directional changes were observed in TD models treated with AMPC, CDK4/6is, or their combination treatments with one exception that all the three CDK4/6is elevated pro-CASP7 levels in TD cells compared to vehicle-treated samples.
Thus, utilizing CDK4/6 inhibition in combination with TFF3 depletion may represent a rational approach to reduce the dormant ER+MC cell population consequent to anti-estrogen treatment.
Co-administration of AMPC and Abemaciclib suppresses the metastatic colonization of dormancy-like ER+MC cells and improves prognosis
The efficacy of AMPC or ABEM was next evaluated in vivo, both singly or in combination, using a mouse model of dormant ER+MC cell metastasis as explained in Supplementary Note 11. The animal body weight was monitored daily and weekly bioluminescence imaging was performed to assess metastatic signals (Figs. 5a, S30b). After 3 weeks of treatment, single AMPC or ABEM treated mice exhibited a reduction in total metastatic burden compared to the vehicle-treated groups. Additionally, the FD cell-injected mice treated with combined AMPC-ABEM exhibited further suppression of metastatic signals compared to the animals treated with either AMPC or ABEM alone. (Figs. 5a, S30b). Similar directional changes were observed in the TD model.
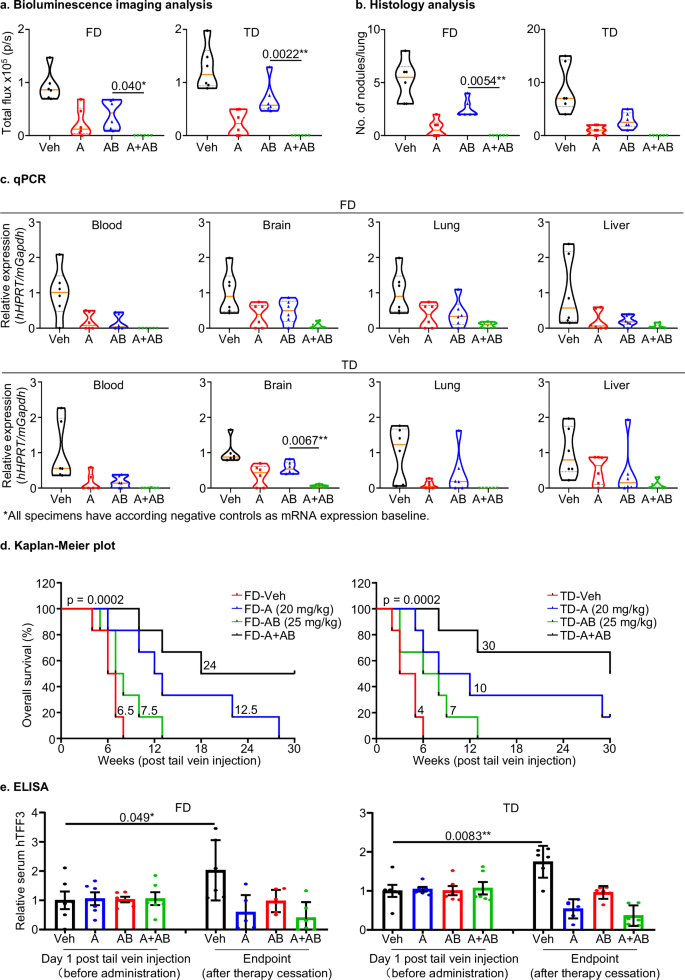
Female BALB/c athymic mice were injected with 1 × 10⁶ FD or TD cells via the tail vein and treated with vehicle (Veh), 20 mg/kg AMPC (A), 25 mg/kg Abemaciclib (AB), or a combination of A and AB as indicated for 6 days as the 1st cycle of treatment. Administration was ceased for 6 days and subsequently started for another cycle of 6 days treatment. a Bioluminescence imaging analysis: The quantification of bioluminescence images to visualize the metastatic burden of mice that received a tail vein injection of 1 × 10⁶ FD or TD cells. Bioluminescence imaging was conducted weekly. Statistical analysis was performed using a one-way ANOVA followed by Tukey’s multiple comparisons test (n = 6). b Histology analysis: Lung specimens from mice without tail vein injection (or treatment) were devoid of metastatic nodules. MCF7-derived orthotopic xenograft specimens were used as positive controls. Metastatic nodules on lung were quantified and shown in a violin plot. Statistical analysis was performed using a one-way ANOVA followed by Tukey’s multiple comparisons test (n = 6). c qPCR: Total RNA was isolated from the whole blood, brain, lung, and liver tissue of individual mice that received a tail vein injection of FD or TD cells under the indicated treatments. qPCR was performed to measure the mRNA expression of human HYPOXANTHINE-GUANINE PHOSPHO-RIBOSYL TRANSFERASE (hHPRT) in the blood and organs of mice, with mouse Glyceraldehyde 3-phosphate dehydrogenase (mGapdh) as an internal control. The relative expression of hHPRT vs. mGapdh was calculated. Statistical analysis was performed using a one-way ANOVA followed by Tukey’s multiple comparisons test (n = 6). d Kaplan–Meier analysis: Kaplan–Meier survival curves were used to depict the indicated group median and surrogate survival rates, each comprising six animals. The log-rank test (χ2 = 18.56, p < 0.0001) was used to analyze the statistical differences between the groups (n = 6). e ELISA: Serum levels of human (h)TFF3 in mice that received a tail vein injection of FD or TD cells were determined by ELISA at 1st day post-injection and the endpoint after therapy cessation. All the measurements were normalized to the average of hTFF3 levels in the corresponding control groups as relative serum hTFF3. Statistical differences were analyzed using an unpaired two-tailed Student’s t-test (n = 6). The symbols (*) indicate statistical significance. p < 0.05(*), p < 0.01(**) and p < 0.001(***) were considered statistically significant.
The gross anatomical appearance (Fig. S31a) and weight (Fig. S31b) of vital organs including heart, lung, liver, spleen, kidney, as well as the length of the colon, in the drug-treated mice, did not exhibit any significant difference compared to those of the vehicle-treated mice. These observations indicated tolerance of the drug treatments. Three weeks post tail vein injection, whole blood samples were collected to detect mRNA indicative of circulating tumor cells. Considering the propensity of ER+MC cells to metastasize to the brain, lung, and liver53, these organs were dissected into two parts along the midline. The concordant half was used for qPCR analysis to detect human-specific mRNA derived from metastatic cells, whereas the other half was subjected to histology and IHC analysis to quantify micro-metastatic nodules. qPCR assays were performed to analyze the mRNA expression of mouse Glyceraldehyde 3-phosphate dehydrogenase (mGapdh), human HYPOXANTHINE-GUANINE PHOSPHO-RIBOSYL TRANSFERASE (hHPRT)54 and human CYTOKERATIN 8 (hCK8)55 in mouse NIH3T3 cells (negative control for metastasis) and human MCF7 cells (positive control for metastasis) (Fig. S31c). The expression of mGapdh mRNA was detected only in NIH3T3 cells. In contrast, there was no or minimal expression of hHPRT or hCK8 mRNA in NIH3T3 cells compared to MCF7 cells (Fig. S31c). Therefore, mGapdh mRNA was used as an internal control for hHPRT and hCK8 mRNA levels. The hHPRT and hCK8 mRNAs were used to indicate the presence of and quantify metastatic human-derived FD or TD cells. The qPCR Ct values of all organ samples are presented in Table S2. The relative mRNA expression of hHPRT versus mGapdh and hCK8 versus mGapdh was calculated (Figs. 5c, S31c). hHPRT and hCK8 mRNA in whole blood and organ samples was reduced in AMPC or ABEM treated animals compared to the vehicle-treated group. Furthermore, animals treated with the AMPC-ABEM combination exhibited a further decrease in hHPRT and hCK8 mRNA levels in all samples compared to animals treated with either AMPC or ABEM alone (Figs. 5c, S31c). Similar trends in the expression of hHPRT and hCK8 mRNAs in whole blood and organ samples were observed in TD cell-bearing mice treated with AMPC, ABEM, or AMPC-ABEM.
Histology analysis of resected organs using H&E staining was performed to identify metastatic nodules (Figs. 5b, S32a)54, and IHC using CK8 staining was utilized to detect metastatic human-MCF7-derived cells in these organs from FD or TD cell-bearing mice (Fig. S32b)55. Primary orthotopic xenograft specimens derived from MCF7 cells were positive controls and the organ specimens obtained from mice without injection of FD or TD cells functioned as a negative control for the identification of metastatic nodules and cells (Figs. 5b, S32a, S32b). Xenograft cells in the positive control group were CK8-positive whereas those in the negative control specimens were CK-8 negative. In FD cell-bearing mice, metastatic nodules identified by H&E staining and CK8-positive cells were only observed in lung sections. Lung specimens resected from animals treated with AMPC or ABEM exhibited a substantial decrease in pulmonary metastatic nodules compared to animals treated with vehicle. The combination of AMPC-ABEM further reduced the percentage of metastatic nodules compared to specimens treated with either AMPC or ABEM alone (Figs. 5b, S32a). Consistently, lungs from AMPC- or ABEM- treated groups showed a reduced population of CK8-positive cells compared to the respective vehicle-treated group. The combination of AMPC-ABEM further reduced the population of CK8-positive cells compared to corresponding groups treated with either single AMPC or ABEM (Fig. S32b). Similar directional changes in the number of metastatic nodules identified by H&E staining and the CK8-positive cell population were observed in TD model-bearing mice treated with AMPC, ABEM, or AMPC-ABEM.
The survival of the remaining FD or TD model-bearing mice was monitored daily based on the survival endpoint standard as detailed in Fig. S30a. Using Kaplan–Meier analysis, all mice in the vehicle-treated group reached endpoint after 8 weeks post tail vein injection, the AMPC-treated group within 28 weeks and the ABEM-treated group within 13 weeks, whereas 50% of mice did not achieve endpoint in the combined AMPC-ABEM-treated group after 30 weeks of observation (Fig. 5d). Similarly, in TD cell-bearing groups, all mice in the vehicle-treated group reached endpoint 6 weeks post tail vein injection. 17% of mice in AMPC-treated group did not satisfy endpoint criteria after 30 weeks of observation. The ABEM-treated group achieved endpoint within 13 weeks, and 50% of mice in the combined AMPC-ABEM-treated group did not reach endpoint after 30 weeks of observation (Fig. 5d). Additionally, the median survival of animals in the vehicle-treated group was 6.5 weeks, the AMPC-treated group was 12.5 weeks, the ABEM-treated group was 7.5 weeks, and the combined AMPC-ABEM-treated group was 24 weeks. Similarly, in the TD cell-injected mice, the median time to reach endpoint for the vehicle-treated group was 4 weeks, the AMPC-treated group was 10 weeks, the ABEM-treated group was 7 weeks, and the combined AMPC-ABEM-treated group was 30 weeks (Fig. 5d). Importantly, the combination therapy significantly prolonged the median survival time of both FD or TD cell-bearing animals (p < 0.001) (Fig. 5d). Corresponding body weight changes are detailed in Supplementary Note 12.
The serum level of human (h)TFF3 derived from FD or TD cell injected mice was analyzed using ELISA (Fig. 5e). After tail vein injection of FD or TD cells into host animals, serum samples were collected before the start of therapy (baseline) and after therapy cessation (3 weeks post tail vein injection). Compared to baseline, hTFF3 levels were elevated in the vehicle-treated mice after 3 weeks of treatment. The AMPC-treated group exhibited a lower serum level of hTFF3 at 3 weeks of treatment compared to either vehicle or ABEM treated animals. ABEM-treated mice exhibited decreased hTFF3 serum levels compared to the vehicle treated animals. Combination therapy further reduced hTFF3 serum levels compared to either single AMPC or ABEM treated mice (Fig. 5e). Similar directional changes in the serum hTFF3 level were observed in the AMPC, ABEM, or AMPC-ABEM treated TD cell-bearing mice.
To determine the association between serum hTFF3 and the therapy efficacy in reducing metastasis and prolonging survival of host animals in vivo, Pearson correlation analysis was performed in FD or TD cell-bearing animals. The analysis revealed a negative correlation between metastasis signals and overall survival defined by endpoint standard (Fig. S30a) in FD (r = −0.784 < 0, p < 0.001) or TD (r = −0.856 < 0, p < 0.001) cell-hosting mice, as demonstrated in Fig. S32d. Moreover, the serum level of hTFF3 was positively associated with metastasis (FD: r = 0.864 > 0, p < 0.001; TD: r = 0.905 > 0, p < 0.001) and negatively correlated with the survival endpoint of mice (FD: r = −0.814 < 0, p < 0.001; TD: r = −0.858 < 0, p < 0.001) (Fig. S32d). These findings indicate that decreased serum hTFF3 levels consequent to therapy is highly associated with therapy efficacy in reducing metastatic outgrowth and improving survival outcomes in mice bearing dormant ER+MC cells.
Discussion
Anti-estrogen-therapy induced tumor dormancy and subsequent relapse largely limits the prognosis of ER+MC patients. To address the imperative need for improved understanding of this phenomenon, three predominant findings are reported herein.
Firstly, this study reported an in vivo approach to generate models to mimic clinical scenarios of anti-estrogen-induced ER+MC dormancy. To the best of our knowledge, no in vivo generated therapy-induced-dormant ER+MC preclinical models have been previously reported. Tumor dormancy is highly associated with surrounding micro-environmental niches, and thus in vitro approaches would be expected to produce limited understanding21. For example, in ER+MC, anti-estrogens exert multiple endocrine effects such as modulation of the IGF-1 axis56, reported to promote dormant cancer cell survival57. Hence, to validate the in vivo models herein, multiple metrics were evaluated to assess tumor dormancy features demonstrated in various previously generated models7,9,10,11,12,21,58,59,60,61,62,63,64,65. For tumor mass dormancy, tumor volume58 or luminescent imaging was utilized to observe a constant dormant tumor mass59. Consistently, the FD or TD xenografts herein exhibited constant tumor size and luminescent signals during drug administration. A dormant tumor mass should also be capable of repopulation/relapse as a distinguishing feature compared to a senescent tumor mass60. Concordantly, the FD and TD xenografts herein relapsed after cessation of drug administration. Moreover, low expression of proliferation-associated proteins including MKI67 and PCNA61, an elevated p-p38MAPK (Thr180/Tyr182)/total p38MAPK ratio and a reduced p-p44/42MAPK (Thr202/Tyr204)/total p44/42MAPK ratio have also been delineated as molecular features of tumor dormancy9,10,11,12. Consistent with these findings, the FD and TD xenograft specimens exhibited these molecular features of dormancy compared to vehicle treated or relapsed xenografts. In terms of cellular dormancy, G0/G1 cell cycle arrest62, inactive DNA replication59,63, drug resistance21, and enhanced stemness7 have been reported as hallmarks of cellular dormancy. Compatible with these studies, the isolated FD and TD cells also exhibited these characteristics and displayed molecular features of dormancy. Moreover, FD- and TD-cells injected through the tail vein of host animals, exhibited enhanced metastatic outgrowth along with significantly worse survival outcomes compared to the respective FC/FR or TC/TR groups, in accordance with previous work demonstrating the contribution of tumor dormancy in metastasis and relapse1,2,3. Therefore, the dormancy-like models generated herein exhibited tumor mass dormancy, cellular dormancy, and features of clinical dormancy commonly defined in previous studies, and thus comprehensively satisfied the relevant criteria to be designated as anti-estrogen induced ER+MC dormancy-like models. These preclinical models would be anticipated to reveal additional mechanisms and candidate therapeutic targets for dormant-cell-targeted drug development. One limitation of the generated dormancy models is the potential loss of the dormancy-like phenotype over time in vitro after extraction from host animals. As the dormancy state is a dynamic process which cannot be fully replicated in in vitro culture4,5, it was noted that the xenograft-derived dormancy-like cell lines exhibited gradually diminished dormancy-like features with increased passage number. Hence, to maintain the dormancy attributes generated in vivo, FD or TD cell lines were cultured in collagen-coated plates with the respective FUL or TAM containing medium in an attempt to better replicate in vivo conditions. Dormancy features such as G0/G1 cell cycle arrest were determined for each generation of FD or TD cells62 and experimentation was executed at limited passage number to minimize potential loss of dormancy features.
The second finding identified TFF3 as an epigenetically regulated driver of the in vivo generated dormancy models herein. In previous reports, TFF3 was identified as a pivotal marker of chemotherapy-resistance being enriched in residual MC (which may be considered as a dormant tumor mass66) after chemotherapy67,68 and functionally promotes intrinsic and/or acquired resistance to chemotherapeutics69,70, and anti-estrogens28,50,71. Hence, given that TFF3 also enhances ER+MC stemness attributes50 with increased invasion and metastasis72, and predicts poor survival outcomes of ER+MC patients treated with anti-estrogen therapy28, it is entirely consistent that TFF3 also drives anti-estrogen induced tumor dormancy as observed herein. Furthermore, hypoxia is a critical micro-environmental variable that promotes tumor dormancy73, and hypoxia has been further reported to promote TFF3 gene expression through hypoxia-inducible factor-174,75, again indicative of a pivotal function of TFF3 in the dormancy state. Of note, the retention of dormancy-like attributes associated with elevated TFF3 expression in ER+MC dormancy-like cells isolated from the respective xenografts, indicated relatively stable molecular alterations supporting this phenotype. The critical role of reversible epigenetic modification altering gene expression, in regulating the onset, maintenance, and reactivation from the dormancy state has been previously reported76,77. Additionally, estrogen stimulates broad epigenetic modifications78, and TAM has been reported to enhance TFF3 expression in ER+ endometrial carcinoma by promoting TFF3 promoter hypomethylation32,42. It is, therefore, pertinent that the hypomethylation of the TFF3 transcriptional regulatory region maintained elevated TFF3 expression and consequent cell phenotype in dormancy-like and relapse models. However, for such regulatory hypomethylation described, there are currently no targeted agents clinically available79, which may reverse TFF3 dependent dormancy, and hence targeting TFF3 directly may offer a potential vulnerability. Furthermore, this study further reinforced BCL-2 dependent ER+MC cell survival functions of TFF3 in the generated dormancy-like models43,51, yet currently available BCL2 family inhibitors exhibit limited efficacy in ER+MC80,81. Hence, TFF3 may again serve as an alternate actionable target in anti-estrogen induced dormancy to abrogate dormancy, resistance, and subsequent relapse.
Thirdly, this study proposed a novel and effective combination of TFF3 inhibition (AMPC) with CDK4/6is to ablate both FD or TD models. CDK4/6is are currently standard of care for ER+MC patients after progression on/after anti-estrogen-therapy82,83 with reported increases in both PFS and OS84,85. One mechanism of synergy between AMPC and CDK4/6is may relate to RB phosphorylation, since TFF3 upregulates CCND1 expression51,54,72,86 and CDK4/6 directly binds to CCND1 as the activated CCND1-CDK4/6 complex to enhance pRB levels52, and thus promote cell cycle progression. Indeed, the AMPC-CDK4/6i combined treatment produced a dual suppression of CCND1 expression and CDK4/6 kinase activity to decrease pRB levels more effectively than single agent treatment. An additional effect of AMPC is the reduction of BCL2 expression in FD and TD cells to promote apoptosis as expected28,50. Hence, the identified combination of TFF3 depletion and CDK4/6 inhibition, by concurrently reducing both ER+MC cell proliferation and survival and abrogating metastatic outgrowth of dormant cancer cells, provides a mechanistically rational therapeutic strategy. Of note, hyperactivating alterations of PI3K/AKT and RAS/MAPK pathways, with consequent upregulation of CCND1 are reported as a mechanism of resistance to CDK4/6is87,88. In studies to date, the combinations of CDK4/6 and PI3K/AKT inhibitors did not add clinical survival benefit nor remain in clinical development87, and no such combinations of CDK4/6is with inhibition of RAS/MAPK signaling in ER+MC have been clinically explored88. Hence, the dual-inhibition of both kinase pathways by targeting a common upstream effector such as TFF354,72,86 may significantly augment CDK4/6is efficacy.
Collectively, using an in vivo model of ER+MC dormancy induced by anti-estrogens, epigenetic regulation of TFF3 was identified to drive a stable dormancy phenotype and promote dormant cell survival in a BCL2-dependent manner. Combined inhibition of TFF3 and CDK4/6 produced both synergistic molecular interactions with complementary mechanisms resulting in concurrent-inhibition of cell cycle progression and cell survival and was efficacious in the generated preclinical models. Hence, such or equivalent approaches may be useful to abrogate dormancy responses and ameliorate clinical outcomes of ER+MC patients.
Responses