The 2023 Türkiye-Syria earthquake disaster was exacerbated by an atmospheric river
Introduction
Natural hazards such as earthquakes, hurricanes, floods, and landslides can cause tremendous destruction, especially in low- and middle-income countries1. The risk that estimates future losses may become even more elevated when multiple hazardous events overlap, amplifying impacts in previously overlooked or even unrecognized ways. As weather extremes increase with rapid atmospheric warming2, the likelihood of such disastrous cascading hazards is expected to increase globally3.
Cascading hazards are a sequence of events where each subsequent event exacerbates the effects of the previous one4,5. These events are often interconnected through cause-and-effect relationships. For instance, the 2011 Tohoku disaster involved an earthquake that triggered a tsunami, which subsequently led to a nuclear meltdown6. Similarly, the April 2015 Gorkha earthquake in Nepal triggered landslides that were further exacerbated by the following monsoon rains (May-September)7,8. In that case, hillslopes became more susceptible after strong ground shaking, leading to an increased landslide frequency months later compared to pre-earthquake levels, whereas monsoon rainfall also triggered landslides on hillslopes largely unaffected by the earthquake.
Similar patterns have been observed in other regions affected by major earthquakes9,10. In these cases, coseismic landslide debris was further remobilized by strong runoff or snowmelt, feeding widespread debris flows. Such hazard cascades may also involve the formation and failure of landslide dams, which in turn alter river channels and increase the risk of flooding and slope undercutting that may trigger even more landslides long after the initial earthquake11. These protracted hazard cascades can lead to elevated damage potential, able to last hundreds of years following strong earthquakes12.
This complexity of cascading earthquake hazards means that numerical approaches that integrate coseismic and post-seismic hydro-geomorphic processes have remained much less well developed than those to models tailored towards individual hazards13. Moreover, our understanding of complex, rain-bearing atmospheric phenomena like atmospheric rivers (ARs) and their potential to trigger hazards remains limited, especially in areas where hazard cascades remain understudied, such as in the Middle East. In recent years, the frequency of AR-triggered weather extremes has been increasing in the Middle East and northern Mesopotamia14,15,16,17. Yet, studies focusing on extreme precipitation events caused by atmospheric systems originating from the Red Sea and moving northeast—thereby increasing humidity in the Zagros or Taurus Mountains—are rare. Furthermore, detailed research into cascade events that combine seismic hazards, ARs, and resultant landslides is rare. This knowledge gap arises largely from the scarcity of comprehensive data on cascading hazards5, and limits our ability to build and validate accurate hazard models for more realistic disaster scenarios.
We report here the hazard cascade set in motion by the 2023 Türkiye-Syria earthquake sequence. Numerous coseismic landslides were subsequently reactivated and reworked, with their deposits feeding debris flows, river aggradation, and prompting widespread flooding in unstable channels overloaded with sediment. This process chain unfolded within 36 days through a series of hydroclimatic drivers including snowfall, increasing temperature and snowmelt, before reaching a peak in activity when a major AR that brought record amounts of rainfall to the earthquake-impacted area, causing further loss of lives and damage to buildings, infrastructure, and ongoing rescue operations.
An AR is defined as a ‘long, narrow, and transient corridor’ of strong horizontal water vapor transport typically associated with a low-level jet stream ahead of the cold front of an extratropical cyclone18. ARs are pathways for significant poleward water vapor and heat transport from the Tropics, influencing precipitation patterns, temperature variability, and storm activity and often triggering severe weather events like floods and landslides at mid-latitudes19,20. The hazard chain we studied here is the result of a series of extreme events concentrated in our study area, underscoring the need to consider rare weather events like ARs in assessing earthquake hazard cascades and planning hazard assessments. The coincidence of an AR with one of the most intense earthquakes recorded in recent times highlights the intricate and compounded dynamics of the resulting disaster, offering an unprecedented perspective on the interplay between seismic and atmospheric extremes.
The February 6, 2023, Türkiye-Syria earthquake sequence
The February 6, 2023, Türkiye-Syria earthquake sequence was the strongest earthquake doublet ever recorded in continental strike-slip fault systems21, with two powerful earthquakes (Mw 7.8 and Mw 7.5) occurring nine hours apart along the East Anatolian Fault Zone (Fig. 1A). The first earthquake had the same magnitude as the largest recorded earthquake in Türkiye, the 1938 Erzincan earthquake. The rupture involved two fault sections of 270 km ± 10 km and 167 km ± 12 km in the first22 and second23 earthquake, respectively. The earthquake doublet was followed by thousands of aftershocks, four of which had magnitudes greater than 624.
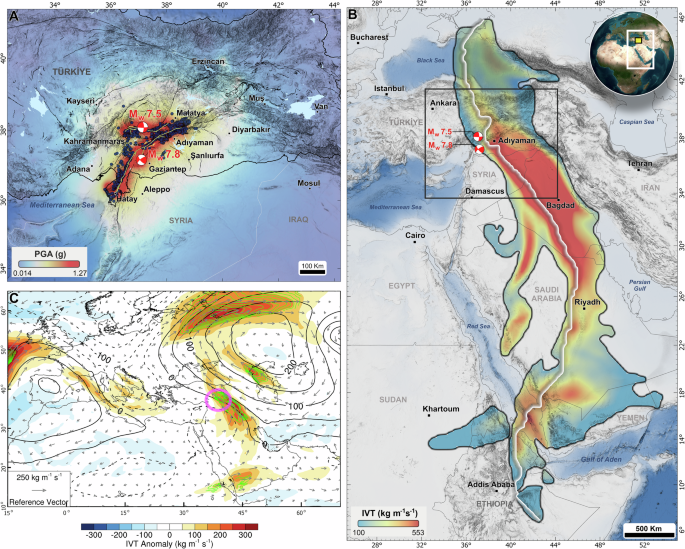
A Spatial distribution of coseismic landslides25 plotted over the USGS composite peak ground acceleration (PGA) map, showing maximum PGA recorded at each location for all earthquakes with a magnitude ≥5.5 of the sequence66. Red beachballs indicate the two main earthquake epicenters67,68 and yellow lines show fault rupture69. Active faults (not involved in the rupture)70 are indicated by black lines. B Spatial distribution of Integrated Vapor Transport (IVT) on March 15, 2023 at 06 UTC, highlighting the area of the detected atmospheric river shape boundaries (see Methods). White line shows the main path of the atmospheric river. C Atmospheric anomalies on March 15, 2023 relative to the March climatology (1991–2020). Shaded areas are mean daily IVT anomalies (kg m−1 s−1), and black contour lines are 500 hPa geopotential height anomalies (m, at intervals of 50 m). Vector arrows illustrate anomalies in the zonal and meridional components of IVT. Green contours indicate IVT anomalies ≥4 standard deviations. The magenta circle corresponds to the earthquake site.
The complex rupturing mechanism featuring multiple fault segments resulted in an exceptionally high moment magnitude and rupture length21. Strong ground shaking triggered more than 3500 landslides, according to initial assessments25 (Fig. 1A). Based on Türkiye’s Disaster and Emergency Management Presidency (AFAD), the earthquake sequence directly affected 11 cities within an area of 100,000 km2. Over 59,000 people lost their lives; 107,204 were injured, and 3 million have been displaced by the earthquake and its cascading hazards. The sequence of hazards and impacts took place so quickly that authorities struggled to attribute specific losses to individual processes.
Results
Atmospheric river and its influence on post-seismic hazards
ARs have been extensively documented across South Africa, North America, Europe, Japan, and New Zealand. However, the impacts of ARs on geohazards have rarely been studied in the Near East and Mediterranean regions20. Instances of AR-triggered landslides and floods have been more commonly observed along the west coast of the United States26,27,28,29,30 and the Appalachian Mountains31,32, as well as in Southeast Brazil33, western Japan34, Alaska35, British Columbia36, and Norway37 and in the Mediterranean, reported events focused on high rainfall events in the Italian Alps38,39, and flash flooding in Lisbon40,41.
In the case of the 2023 Türkiye-Syria earthquake, an AR hit the affected area from March 14 to 16, 2023. This AR originated from the Red Sea and moved toward the earthquake-impacted area with a mean Integrated Vapor Transport (IVT) of 170 km m−1 s−1. On March 15, within and surrounding the quake-affected area, the IVT values rose to >300 km m−1 s−1, with anomalies exceeding 4 standard deviations, placing them in the extreme tail of the IVT frequency distribution, making it an unprecedented and remarkable AR event that drew substantial moisture from tropical and extratropical sources (Fig. 1C). Such intense IVT values, especially when uplifted by topography, led to heavy precipitation and elevated impact of hydrological and sedimentary hazards in the earthquake-affected area.
This AR was associated with a cut-off low over the eastern Mediterranean and a blocking anticyclone over the Aral-Caspian Basin (Fig. 1C). This dynamic setup instigated southerly and southeasterly flow patterns and channeled the AR directly toward the earthquake area: town center of Tut (Adiyaman) was hit the hardest, with cumulative rainfall totals of up to 183 mm within 20 h (Fig. 2A, B) by one of the most intense rainfall events (exceeding the 95th percentile) recorded in the past three decades.
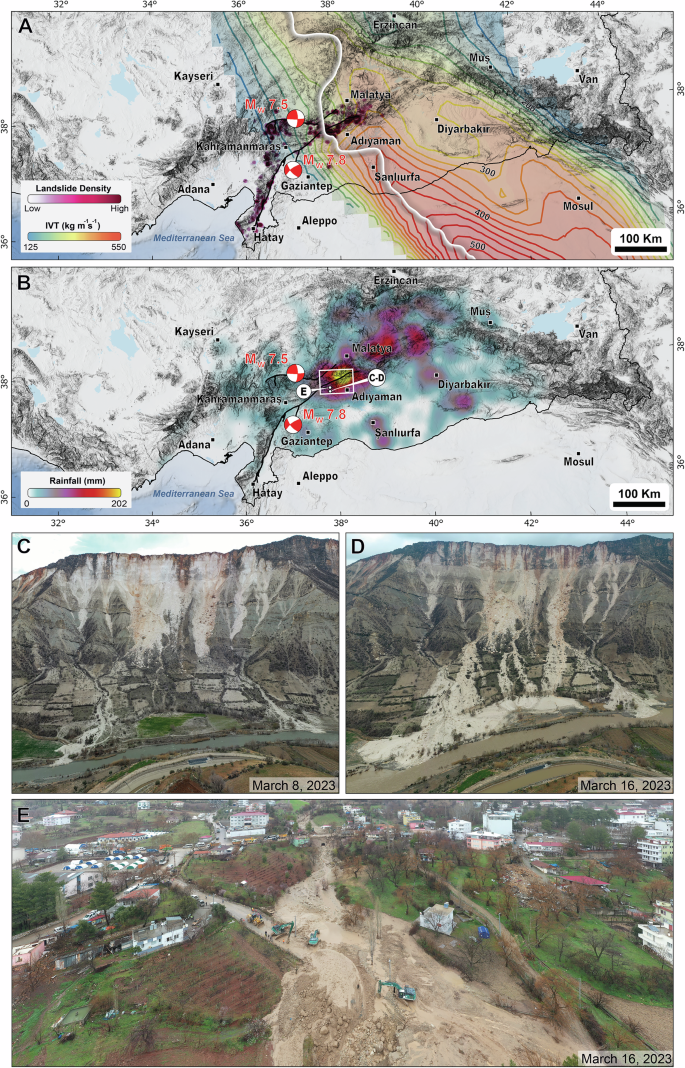
A Landslide density overlain by IVT contour lines. B Rainfall map interpolated from rain gauge measurements between 14 and 15 March 2023. C, D South of Tut Adiyaman, where coseismic landslides were reactivated and remobilized due to rainfall. E Center of Tut, where debris flows buried river channels and houses nearby. Rainfall data are from the archive of the Turkish State Meteorological Service. The white rectangle in B is area of interest used to generate the meteorological conditions in Fig. 4. Landslide density map was interpolated using an inverse distance weighted method.
Given that hillslopes were considerably weakened by strong seismic shaking, the estimated additional shear strength reduction in hillslopes is between 52% and 77%42,43 in the Tut-Çelikhan region, where we observed the highest precipitation on March 14 and 15, 2023 (Supplementary Fig. 1). Hillslopes were already substantially more prone to failure because of the ground disturbance caused by the earthquake sequence. The AR caused excess precipitation, and elevated hydrological and sedimentary impacts in Tut province of Adiyaman, triggering further landslides and debris flows mainly through reactivation and remobilization of coseismic landslides (Fig. 2C, D). Several houses close to river channels were hit by debris flows, claiming four lives (Fig. 2E). Overall, twelve people died because of this AR event.
To further illustrate the temporal evolution and impact of the AR, Fig. 3 shows two distinct phases affecting the earthquake-impacted region. From March 10 to 14, an initial AR, carrying moisture primarily from the eastern Mediterranean, had a zonal (east-west) orientation with limited interaction with the Taurus Mountains and moderate rainfall (Fig. 3A). This was driven by a negative 500-hPa geopotential height anomaly (Z500) over Europe and a positive anomaly extending from the western Mediterranean to the Caspian-Aral basins, resulting in east-west flow (not shown). However, on March 15, the AR shifted to a south-north alignment, drawing substantial moisture from the Red Sea, as the negative Z500 anomaly penetrated further into the eastern Mediterranean and interacted with a persistent blocking pattern over the Caspian-Aral basin (see Fig. 1C). This reorientation put the AR perpendicular to the Taurus Mountains, significantly enhancing orographic lift and concentrating precipitation, particularly around points A and B where IVT values peaked. The precipitation time series reflects this pattern, showing a marked increase in rainfall on March 15 (Fig. 3B).
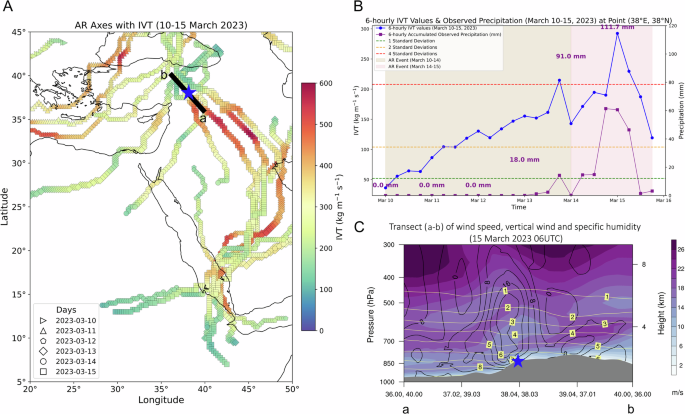
Panels A and B display the evolution of maximum 6-hourly IVT values at each day, with color shading representing the intensity of daily IVT. The blue star (~38°N, 38°E) marks the location of observed peak precipitation, closely following the AR’s core path. In panel B, the blue line shows 6-hourly IVT values, and purple line shows the 6-hourly accumulated observed precipitation at Malatya (Kurucuova) station. The labeled values along the purple line show daily total accumulated precipitation. The horizontal dashed lines are the standard deviations of March IVT (1991–2020), providing historical context for the observed AR event. Panel C is a transect (A-B) along the AR’s core on 15 March at 06UTC. The shaded colors represent ERA556 wind speed (m s−1), black contour lines illustrate vertical wind speed (cm s−1) and yellow lines indicate specific humidity (g kg−1). Positive vertical velocity values represent upward motion.
A transect analysis (points A-B, Fig. 3C) from March 15 at 06 UTC highlights strong low-level winds along the AR axis and a high moisture concentration, both aligned with the Taurus Mountains. This setup favored efficient horizontal moisture transport and intensified vertical motion as moist air was forced to rise over the mountainous terrain. The combination of AR structure, moisture source, wind alignment, and steep topography created optimal conditions for enhanced orographic lift, driving the concentrated and intensive rainfall event on March 15. (Supplementary Fig. 2).
The antecedent hydrometeorological conditions of the region might have also exacerbated the scale of the observed geomorphic response (Fig. 4). Air temperatures in the days before the earthquake were slightly above the 95th percentile for February and this warm spell ended sharply with a passing cold front that brought snowfall for three days, including the days of the earthquake. Air temperatures after the earthquake began to rise by late February, reaching above ~10 °C at some locations. This warming trend caused snowmelt and elevated soil moisture in the mountains shortly before the arrival of the AR event on the night of March 14 (Fig. 4). Rain-on-snow events can be more impactful by increasing pore pressure and reducing effective friction angle more than does rainfall alone44,45. The combination of rapid snowmelt, elevated soil moisture, and hillslope disturbance due to ground shaking likely made the slopes more susceptible to further landslides just before the AR event. Moreover, rain-on-snow events significantly increase runoff due to combined rainwater input and snowmelt, often triggered by warm, moisture-laden ARs14,46,47,48 that raise snowline altitudes, introduce warm rain into snow-covered areas, and thus enhance snowmelt rates and runoff49.
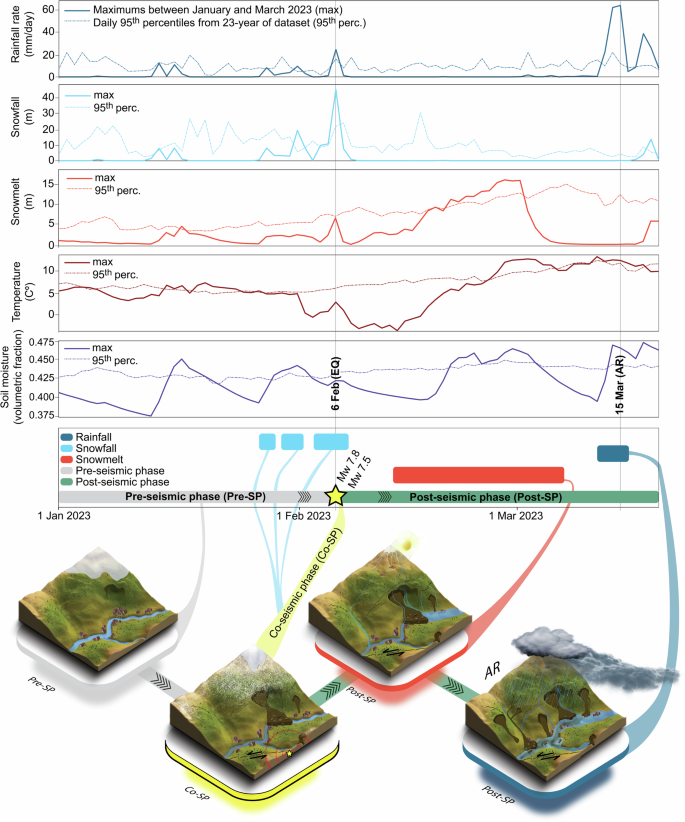
Rainfall, snowfall rate, snowmelt, surface air temperature, and soil moisture are expressed as maximum values and the 95th percentiles for Tut Adiyaman region in pre-, co-, and post-seismic phases. The meteorological variables are from the ERA5 reanalysis dataset56 between March 1993 and March 2023. The study area is indicated by the white rectangle in Fig. 2B.
Persistence of the AR in the study area
The climate in the earthquake-affected area ranges from sub-humid Mediterranean in the southwest to semi-arid continental in the northeast. In the semi-arid northeast, where the AR event occurred, extreme rainfall is rare but tends to be intense and convective when it happens50,51.
From 1979 to 2019, Anatolia has had a statistically significant increase in AR frequency (around +1 AR days per decade, Fig. 5A). Similarly, spatial trends in mean IVT on AR days (see Method) have shown a similar trend (around +6 kg m−1 s−1 per decade), indicating a consistent link between AR presence and IVT intensity (Fig. 5B). AR frequency and associated IVT also show growing inter-annual variability (Fig. 5C, D). We observe less pronounced trends for the March-April-May season, and find that the contribution of ARs to all March precipitation slightly increased from 60% to 68% (not shown).
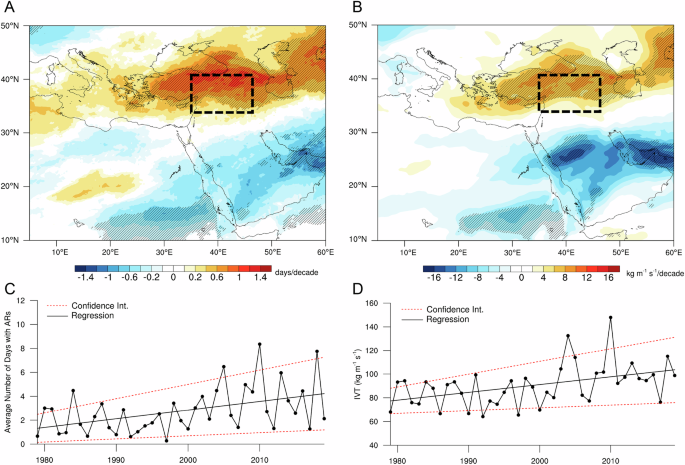
A Spatial distribution of AR frequency trends. Panel B is the same as A, but for Integrated Vapor Transport (IVT) trends on AR days (see Methods). Statistically significant trends at the 95% confidence level, determined by a two-tailed Student’s t test, are hatched. C Trend and interannual variability in AR frequency for our target area outlined by the dashed box. D Trend and interannual variability in AR intensity (IVT) for the same region marked by the dashed box.
We found a statistically significant correlation between extreme precipitation events, defined here as daily precipitation values exceeding the 90th and 95th percentiles, and AR conditions in the atmosphere over southeastern Anatolia (34-41 N; 35-47E) at a 95% confidence level using a binomial test (see Methods). We find that 94% of the most extreme daily precipitation events (P95) were associated with ARs in this region, underscoring the potential contribution of ARs to landslides and floods.
The increasing trend in frequency and intensity trends of ARs may be further exacerbated by anthropogenic climate change. Previous studies have projected similar patterns of globally and regionally, with warming climates expected to drive increases in extreme AR events and their impacts52,53,54. In this respect, Massoud et al.55 projects an increase in AR frequency in the Middle East and the Arabian Peninsula by 2100, emphasizing the growing importance of ARs in the region’s climate. Our findings also reveal consistent AR patterns at high elevations in the Near East, including the northern part of our study area14.
Illustration of seasonal AR events as a driver for post-seismic landslides
As described above, the earthquake sequence and the AR-induced rainfall make a rare case of cascading earthquake and hydrogeomorphic hazards. To illustrate how temporal sequencing of the seismic and climatic events exacerbates the earthquake hazard chain, we developed a simple proof-of-concept model that simulates the post-seismic landslide probability over time driven by stochastic arrivals of extreme precipitation events. We first estimated monthly probabilities of daily AR occurrence based on historical records (i.e., the ERA 5-Reanalysis AR catalogs56 between 1979 and 2018), which highlight March as the most likely month for ARs in our study area (Fig. 6a). We assume that most of the extreme rainfall in this region stems from AR events and exclude other sources of extreme precipitation from this model. We then probabilistically simulated post-seismic landslide occurrence for our study area, using a temporarily varying rainfall threshold for landslides, similar to the conceptual model by Rosser et al.57 for the post-seismic period of the 2015 Gorkha earthquake. We postulate how landslide probability might vary with the timing of the mainshock relative to the seasonal distribution of AR events (Fig. 6b).
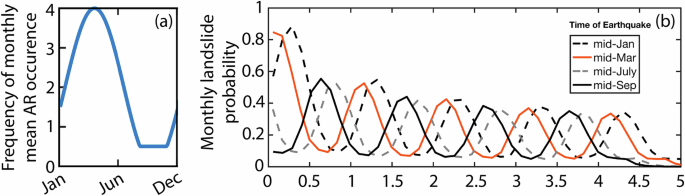
a A yearly model of AR frequency with seasonal variation, described by a cosine function which peaks at the beginning of spring, and (b) estimated monthly probability of landslides triggered by AR events in the aftermath of an earthquake, showing the seasonal variation of potential landslide activity within five years following an earthquake. Each curve corresponds to the onset of simulations with the occurrence of an earthquake in different seasons (mid-January, March, July, and September), demonstrating the influence of seasonality on landslide probability as the landscape progressively stabilizes.
Landslide probability is highest if the mainshock occurs during the rising phase of AR events, which was the case for the 2023 earthquake doublet. When the mainshock occurs in summer or fall, the probability of landslide occurrence decreases as the peak AR season approaches. The timing of the mainshock has a diminishing influence on the peak magnitude of landslide probability, although a seasonal variation in landslide probability persists based on the timing of the mainshock. This simulation underscores that had the earthquake sequence occurred during summer or fall, the post-seismic landslide hazard may have been significantly attenuated.
Implications for potential events in other regions
AR-triggered extreme precipitation events have been observed more often in mountains prone to landslide hazards20. For instance, the Western Pacific Rim is exposed to similar cascading hazards as seen in our study area, due to its frequent AR-triggered extreme rainfall events and high seismicity. Multi-hazard scenarios have already been developed for this region58, though without considering the passage of ARs following strong earthquakes. However, each process in such multi-hazard frameworks is estimated independently from each other, thus neglecting the link between successive events. If this region would be exposed to the combined effects of a large earthquake together with an AR (as in the Turkish case), the resulting landslide and flood hazards may be under- or at least misestimated. This calls for revisiting our assumptions on what multi-hazard risk assessments should be based on globally, especially in seismically active areas frequented by ARs.
Methods
Reanalysis and hydrometeorological data
Atmospheric and surface conditions during the investigated co- and post-seismic events were analyzed using the ERA5 reanalysis dataset56. This dataset provides a comprehensive view of the atmospheric state with a spatial resolution of approximately 30 km, extending through 137 vertical atmospheric levels up to an altitude of 80 km. We extracted and analyzed five variables the ERA5 reanalysis dataset: (i) total precipitation; (ii) total snowfall; (iii) snowmelt, (iv) temperature of air at 2 m above the surface of land; and (v) soil moisture expressed as volume of water in the topsoil layer (0–7 cm). We calculated total rainfall by calculating the difference between total precipitation and snowfall.
We assessed the reliability of the dataset by comparing it with two ground-based rainfall stations—Malatya (Kurucuova; 38.09 N, 37.89E, 1223 m) and Adıyaman (Çelikhan; 38.03 N, 38.23E, 1380 m)—both located in the area that recorded the highest precipitation during the study period (Supplementary Fig. 3). Station data were obtained from the General Directorate of Meteorology, Türkiye. In addition, we compared four satellite-based precipitation products: Famine Early Warning Systems Network (FLDAS59), the Integrated Multi-satellitE Retrievals for GPM (IMERG)60, the Climate Hazards group InfraRed Precipitation with Stations (CHIRPS)61, Global Land Data Assimilation System (GLDAS)62. All datasets were downloaded using Google Earth Engine63. Our comparison demonstrated that the ERA5 reanalysis dataset provided one of the closest matches to the measured precipitation at the target stations, thus we chose to use ERA5 for our analyses.
Also, we utilized the 500 hPa geopotential height data from ERA5 and calculated anomalies during the event against the long-term average for March from 1991 to 2020. We incorporated the vertically integrated vapor transport (IVT), which is derived from the vertical integral of northward and eastward water vapor fluxes within ERA5. Specifically, we assessed the strength of the 15 March 2023 AR event compared to historical ARs in the region. Our results showed that in both IVT and total precipitation, the 15 March event exceeds the 95th percentile, confirming it was significantly stronger than typical ARs for this region (Supplementary Fig. 4). This confirms that the AR was anomalously intense, reinforcing the understanding that both the earthquake and AR were among the strongest recent events, highlighting the potential severity of such compound events.
AR dataset
Our study used an updated global AR dataset, incorporating ERA5 data to examine ARs during the event and their historical context64. Further details on AR data and criteria are available in Guan and Waliser64. This dataset provides a high-resolution view at 0.25° x 0.25° from 1979 to 2023, with hourly updates. This catalog identifies ARs when IVT exceeds the 85th percentile and is above 100 kg m−1 s−1, with additional criteria of a poleward IVT component over 50 kg m−1 s−1, IVT directional coherence, and ARs having a length over 2000 km and a length-to-width ratio greater than 2. The AR tracking algorithm provides details on AR shape, axis, landfall, and statistics.
The AR frequency was calculated independently for each grid cell by counting the number of 6-hourly time steps with AR conditions (i.e., grids within detected AR shape boundaries) and dividing by the total number of 6-hourly time steps during the analysis period. The AR frequency is expressed in units of days (i.e., one 6-h AR step equals 0.25 days). Additionally, a day with at least one of the four reanalysis times within detected AR shape boundaries over the region covering eastern Anatolia (see Fig. 4) was considered an “AR day.” In other words, “AR days” correspond to days when an AR is present at any of the four 6-h steps (i.e., one, two, three, or four 6-h AR steps in a day equals one “AR day”).
Extreme precipitation and ARs
Extreme precipitation events in our study are identified as days where the area-averaged total daily precipitation from ERA5 over eastern Anatolia (34-41 N; 35-47E) exceeds the 50th (median), 75th, 90th, and 95th percentiles of all March days for the period 1979–2019. We included a binomial test to analyze whether the occurrences of ARs and extreme precipitation in March are independent. To perform this test, we first determined the total number of AR days during the 41-year period (1979–2019) to obtain the climatological probability of AR days in March (i.e., total number of AR days in March divided by the total number of March days). The parameters of the binomial distribution were then established: (i) the number of trials is the total number of extreme precipitation days, (ii) the number of successes is the total number of co-occurrences between AR days and extreme precipitation days, and (iii) the climatological probability of AR days in March. The binomial test was conducted, and if the value obtained was less than the significance level (i.e., 0.05), co-occurrences between AR days and extreme precipitation days were not considered independent.
Estimating hillslope weakening caused by the February 6, 2023 Turkey earthquakes
We estimated hillslope weakening caused by the February 6, 2023, Türkiye-Syria earthquakes (Mw 7.8 and 7.6) following the methodology proposed by Xi et al.43. Their approach identifies the reduction in shear strength (RSS) by conducting back analyses on multi-temporal landslide inventories within the area impacted by the 2008 Wenchuan earthquake. Xi et al.43 then convert this discrete information, available only at post-seismic landslide locations, into a regional-scale map through regression modeling. Specifically, they regress peak ground acceleration (PGA), local relief (LR), and the topographic position index (TPI) against RSS using the equation:
The method’s transferability is demonstrated by Xi et al.42, who tested it using multi-temporal landslide inventories for the 2015 Gorkha and 2018 Palu earthquakes.
In our application, we used the regression equation above. For the PGA map, we combined the USGS ground shaking estimates for the Mw 7.8 and Mw 7.6 earthquakes, recording the highest PGA value for each grid cell across both events. Following Xi et al.43, we applied standardization to the input variables, using the same mean and standard deviation values: PGA (mean = 0.782, std = 0.112), LR (mean = 90.352, std = 21.131), and TPI (mean = −13.699, std = 120.036). This standardization is defined as Z = (X-mean)/std.
Conceptualizing the post-seismic landslide probability
We first identified AR events and their associated rainfall depths from the ERA 5-Reanalysis AR catalogs between 1979 and 2018 for the region marked with a rectangle in Fig. 5. We assumed that under normal conditions, landslides are triggered somewhere in the domain by rainfalls that exceed the 95th percentile of the observed AR rainfall record (P95), and earthquakes lower this threshold to the 75th percentile (P75). The recovery of the rainfall threshold following an earthquake is approximated by:
where k is a recovery constant, taken as k = 0.5 1/yr, and t is the time after the earthquake in years. With the selected k, the landslide threshold recovers to P95 in five years (e.g., vegetation grows), which is an approximate period for heightened susceptibility to post-seismic landslides backed by global observations65. A higher (lower) k value will cause a faster (slower) drop in landslide risk back to background levels.
Each iteration of the simulation experiment runs for 5 years, starting with the given time of a major shock. The time between AR arrivals is simulated using an exponential distribution, with a seasonally varying rate of AR arrivals (number of ARs per month), represented by a cosine function (Fig. 6a) that peaks at the beginning of the spring season14. Times between simulated ARs are summed to advance the model time. For each simulated AR, a rainfall depth, PAR, is sampled from an exponential distribution function fitted to the AR rainfall record, and a rainfall threshold for landslide initiation is calculated using the model time. This simulation is repeated 12,000 times, and landslide times for each 5-year experiment are combined. Using this data, monthly landslide probability is calculated and plotted for 5 years (Fig. 6b).


Responses