The association of dietary total antioxidant capacity and gestational diabetes: a prospective cohort study from the Mothers and their children’s health (MATCH)
")
Introduction
Gestational diabetes mellitus (GDM), which is the onset of glucose intolerance first recognized during pregnancy, is one of the most common complications in pregnancy. It has short- and long-term adverse effects on both mothers and offspring, affecting ~4–9% of all pregnancies on average [1]. Although GDM generally resolves after childbirth, it can lead to long-lasting health issues, such as increased susceptibility to cardiovascular disease (CVD) [2] preeclampsia [3] and type 2 diabetes (T2DM) [4] in the mother, and future overweight/obesity, T2DM, and CVD in the offspring [5, 6].
The most identified risk factors for GDM include advanced maternal age, overweight/obesity, a family history of diabetes, a high-fat/carbohydrate diet, micronutrient deficiencies [7] and oxidative stress [8]. In recent years, nutritional factors and their association with the prevention and management of various chronic diseases have garnered more attention [9]. This approach proposes that a primarily plant-based diet with a high amount of vegetables and fruits and a minimal ratio of processed starchy foods significantly decreases the risk of developing chronic diseases [10].
There are various beneficial functions attributed to diets high in vegetables and fruits, such as anti-inflammatory and antioxidant activity [11]. Several components in vegetables and fruits have been recognized to decrease inflammation [12] and oxidative stress [13]. Moreover, higher intake of dietary antioxidants has been related to a lower risk of GDM [14, 15]. Although, fruits and vegetables are crucial source of antioxidants, they are not the only sources of dietary compounds that can potentially decrease the risk of GDM [16]. Other dietary factors, including whole grains, nuts, coffee, and chocolate, due to their high amount of antioxidant compounds, should be considered potential elements for decreasing the risk of GDM [17]. It has been well-established for many years that antioxidant nutrients and food groups such as vegetables and fruits influence health and disease.
Research on individual antioxidant nutrients or food groups may not capture the interactions or synergetic effects of antioxidants in the whole diet and the different mechanisms for preventing disease. Thus, DTAC was designed as a tool for evaluating a diet’s antioxidant potential [18]. Recently, a database of the total antioxidant capacity (TAC) of diet has been developed to represent the cumulative potential of dietary factors to decrease free radicals [19, 20]. High values of dietary TAC have been associated with various health benefits in previous studies [21, 22]. However, the effect of DTAC on GDM has not yet been evaluated. Using data from Mothers and their Children’s Health (MATCH) cohort study, we examined the association between DTAC and GDM using propensity score–based inverse probability weighting (IPW).
Materials/Subjects and Methods
Design overview and study population
The Mothers and their Children’s Health (MATCH) is a prospective cohort study of 2103 pregnant women aged 18–45 at the study’s inception in 2020. The details of the methodology, including data collection, instruments, and quality assurance, are described elsewhere [23]. All pregnant women with a gestational age of fewer than 12 weeks, confirmed by beta-human chorionic gonadotropin, were included in this study. We excluded women with metabolic or chronic diseases, twin pregnancies, those following a particular diet, using some nutritional supplements (except pregnancy supplements such as iron or folate), and those with physical, mental or cognitive disabilities. This study has received approval from the Ethics Committee of Tehran University of Medical Sciences under identity number IR.TUMS.MEDICINE.REC.1398.576. Prior to commencing the study, all participants provided written informed consent. Given the study’s duration, participants will be asked to renew their consent every six months.
Baseline measurements
There are four scheduled data collection periods. Ten trained interviewers gathered data on weekdays, excluding holidays. Baseline data was collected before the 12th week of pregnancy, capturing maternal demographics, lifestyle, medical history, reproductive and obstetric details, social history, maternal nutritional status, and sleep patterns from the year prior to conception. Additionally, paternal demographics, social history, lifestyle factors, and family medical history were recorded. Blood samples and anthropometric measurements were collected only at the initial prenatal visit. A second survey occurred around 24 weeks of pregnancy (±14 days), focusing on maternal physical activity and family medical history details. At approximately 32 weeks of pregnancy (±14 days), a third survey gathered information about maternal sleep disorders during early pregnancy stages. The final data will be within 12–72 h after delivery, documenting birth outcomes such as gestational age, birth weight, delivery method, and any maternal or neonatal complications during labor or postpartum. Study interviewers communicated with participants via telephone, email, or text messages and promptly informed if participants delivered at a different hospital.
Dietary assessment
We assessed the frequency of food consumption using a validated semi-quantitative FFQ consisting of 168 items to capture local dietary habits during the previous year of pregnancy. The validity and reliability of the FFQ have been proven for the Iranian population. The FFQ was confirmed to be valid and reproducible for the population in the Tehran Lipid and Glucose Study (TLGS) [24]. In this dietary questionnaire, portion sizes were based on predefined categories, which were based on the frequency of foods consumed daily, weekly, or monthly during the preceding year. The total amount of food consumed by participants was then converted from household measures to grams. The average intake of energy, macronutrients, and micronutrients collected from the FFQ was calculated using Nutrition IV and then transferred to Stata (version 17). Dietary TAC was calculated by the ferric reducing ability of plasma (FRAP). FRAP values were obtained from Halvorsen and Changjiang Guo [25, 26]. To determine the daily antioxidant capacity of each participant, we multiplied their daily intake of each food item by its antioxidant value per food portion, and we added the totals [27]. We compiled a list of the food items reported in the FFQ for which antioxidant capacity data was available. This data was usually obtained from scientific literature or antioxidant databases. We then assigned total antioxidant capacity values (FRAP) to each food item based on the available data. These values were typically expressed per unit weight (e.g., per 100 grams). We multiplied the frequency and portion size of each food item consumed by its corresponding antioxidant capacity value to determine the total antioxidant intake for that specific food item.
Summed the Antioxidant Intakes: We summed the antioxidant intakes of all food items to get the overall DTAC for the individual.
DTAC = ∑ (Antioxidant Intake per Food Item)
Anthropometric measurements
We measured maternal height, waist circumference and hip circumferences at enrolment; however, maternal weight was measured at each of the four visits. Measurements were taken twice according to the international study protocol. If the second measurement differed significantly from the first, a third measurement was taken, and a midpoint measurement was accepted. We asked the participants to remove their shoes, extra or heavy clothing, and empty their pockets before weighing (Seca 813).
Lifestyle
Data regarding lifestyle variables were collected through a face-to-face interview using a standardized questionnaire. The questionnaire included detailed information on sociodemographic factors, reproductive history, physical activity, smoking and alcohol drinking history, medical history, family history of diseases, and sleep disorders. The questionnaire took about 120 min to complete.
Biospecimen collection and GDM diagnostic
Blood from the ulnar vein was collected and mixed with an appropriate amount of ethylenediaminetetraacetic acid (EDTA) anticoagulant. All blood samples were analyzed at one laboratory at Arash Hospital. A trained medical laboratory scientist tested the samples within four hours after sampling using an automated hematology analyzer (Sysmex Corporation, Kobe, Japan). In accordance with American Diabetes Association (ADA) recommendations, we defined GDM as a fasting glucose level ≥92 mg/dL, or 1-h postprandial glucose level ≥180 mg/dL, or 2-h postprandial glucose level ≥153 mg/dL during the oral glucose tolerance test.
Quality assurance and quality control
To ensure quality assurance and control, we implemented proactive and comprehensive participant-tracking methods. During the initial visit, we gathered contact details, including home and work addresses, telephone numbers (both home and work), cell phone numbers for both the participant and their spouse, email addresses, and contact information for next of kin and a close friend. Throughout the data collection process, we conducted weekly checks to detect any potential interviewer bias. Additionally, an independent researcher monitored and reviewed ten percent of the data monthly to ensure completeness. To maintain the reliability of our data, all interviewers underwent thorough training before the study began. This training included formal sessions, practical demonstrations, and role-playing exercises to familiarize interviewers with explaining study objectives, obtaining consent, and administering questionnaires. A training handbook was used to standardize instructions and ensure consistency in training methods among all interviewers throughout the duration of the project.
Sample size
We sorted and categorized the participants into quartiles 1–4 (Q1 had the least antioxidant diet, whereas Q4 had the most antioxidant diet) according to the DTAC score. The required sample size is determined by considering cumulative incidence (Risk) of GDM into quartiles 1–4. It was assumed that a total sample of 1590 women (318 women per group), which included a 10% dropout factor would provide 80% power to detect a 40% difference (RR = 1.4) in the proportion of GDM between the groups.
Statistical analysis
General characteristics of participants were presented as mean (±SD)/median (interquartile range, IQR) or number (percentage) for continuous and categorical variables, respectively. To compare general characteristics across study groups, we used one-way analysis of variance, independent t-test and Chi-square test. All continuous variables were assessed for normal distribution using the Kolmogorov-Smirnov test and Q-Q plots. We used multiple imputations based on chained equations, which fill in missing values in multiple variables iteratively using a sequence of univariate imputation models with a fully conditional specification of prediction equations. The exposed (quartiles 1–3 (Q1–Q3) for DTAC) and non-exposed groups (Q1) for DTAC were dissimilar; women who were in the highest DTAC scores (Q4) were older, more educated, heavier, and more likely to have pre-existing diabetes compared to other women in the DTAC quartiles (Q1-Q3). We computed propensity scores using a generalized boosted model (GBM) to adjust for these differences. We employed ‘TWANG’ package to estimate propensity scores using an automated, nonparametric machine learning method, generalized boosted models based on 10,000 regression trees. We selected the minimal sufficient variables using directed acyclic graphs (DAGs), based on the web tool dagitty.net (Fig. 1) [28]. Quartile 1 (less antioxidant diet) was set as the reference group. We evaluated the association between DTAC and incidence of GDM by calculating risk ratios (RRs) and corresponding 95% confidence intervals based on the weighted modified Poisson regression with inverse probability weighting (IPTW). The data processing and statistical analysis were performed using the Stata statistical package version 17 (Stata Corp LP, College Station, TX, USA) and R statistical software (Version 4.2.1; The R Foundation for Statistical Computing, Vienna, Austria).
")
A Unadjusted, B adjusted.
Results
Follow-up
The flow chart of sample recruitment in Fig. 2 illustrates the number of pregnant women examined at each time point, as well as the number of women lost and the reasons for dropping out. Overall, 3,285 women were enrolled between February 1, 2020 and August 31, 2021. Initial screening indicated that 2103 women were eligible for the study, of whom 1856 had complete data and 247 (11.74%) had incomplete follow-up data. We excluded 1182 participants for the following reasons: (І) planned to deliver to elsewhere (n = 486, 14.8%); (Π) gestational age > 12 weeks (n = 328, 9.9%); (III) multiple pregnancies (n = 125, 3.8%); (IV) metabolic or chronic diseases (n = 114, 3.5%); (V) following a special diet (n = 32; 0.9%), and (VI) declined (n = 97, 2.9%) (Fig. 2). The mean age and BMI of the included females were 32.9 ± 6.1 years and 25.9 ± 8.3 kg/m2, respectively. A total of 7.5% (n = 149) of the study participants were employed and 45.5% (n = 845) were university-educated.
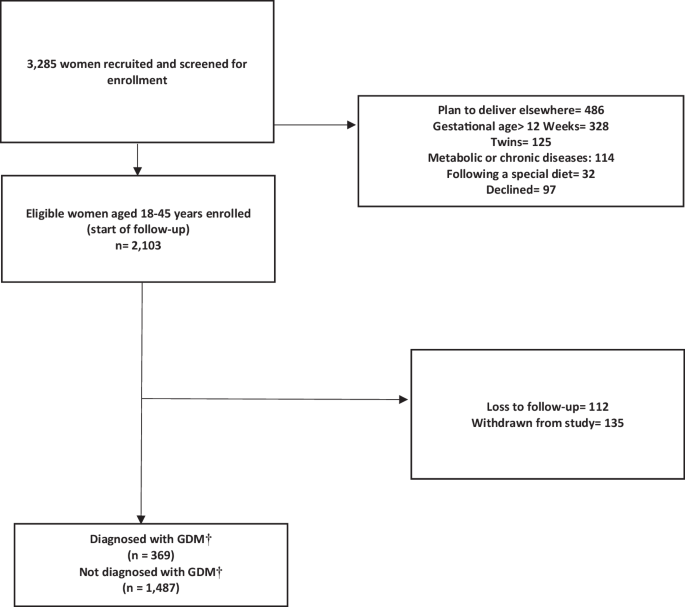
The reasons and number of exclusions are stated accordingly. † Gestational Diabetes Mellitus.
Characteristics of the study population
Among 1,856 eligible pregnant women included in the current study, 369 cases of GDM were identified, with an incidence rate of 19.9%. Table 1 presents the most important characteristics of women with and without GDM. Women with GDM were older (34.8 ± 5.7 vs. 32.4 ± 5.9; p < 0.001), heavier (67.9 ± 13.1 vs. 65.2 ± 12.4; p < 0.001), more likely to be current smokers (90/369, 24.4% vs. 278/1,487, 18.7%; p = 0.140), had pre-existing diabetes (83/369, 22.5% vs. 106/1,487, 7.1%; p < 0.001), and had a higher frequency of family history of diabetes compared to controls (174/369, 47.1% vs. 572/1,487, 38.5%; p = 0.002).
The comparison of baseline characteristics by quartile of DTAC is presented in Table 2. The mean DTAC score and corresponding SD was 2.82± (2.56) mmol/100 g, with a range of 0.01 to 18.55. The incidence of GDM cases in different quartile of the DTAC were 25.16% (117/465), 21.01% (97/462), 18.22% (71/461), and 15.17% (71/468), respectively. Compared with women with lower DTAC scores, those with higher DTAC scores (representing a more proinflammatory diet) were more likely to be educated and consume more calories. No significant differences were identified in the areas of maternal age, reproductive history, anthropometric indices, pre-existing hypertension, pre-existing diabetes, and smoking habits across the quartiles of the DTAC.
We presented the crude and multivariable-adjusted risk ratios (RRs) for the association between DTAC and GDM in Table 3. In the crude model, compared with the lowest quartile, the RRs for GDM were 0.83 (95% CI: 0.65, 1.05), 0.72 (95% CI: 0.56, 0.92), and 0.61 (95% CI: 0.46, 0.78) for successive quartiles of DTAC score, respectively. In fully adjusted models, the adjusted RRs (95% CIs) for GDM from the lowest to highest quartiles of the DTAC score were 1 (reference), 0.32 (95% CI: 0.14, 0.73), 0.26 (95% CI: 0.11, 0.60), and 0.29 (95% CI: 0.12, 0.68), respectively (p for trend< 0.001). A significant association was observed between DTAC and GDM risk (aRR: 0.66; 95% CI: 0.48, 0.90) when the DTAC score was modeled as a continuous variable in the fully adjusted models.
Discussion
In this cohort study, we investigated the association between DTAC and GDM using propensity score–based inverse probability weighting (IPW). We found that a diet rich in TAC was associated with a reduction in the risk of GDM, and this effect was clinically significant. In fully adjusted models, the adjusted RRs (95% CIs) for GDM from the lowest to highest quartiles of the DTAC score were 1 (reference), 0.32 (95% CI: 0.14, 0.73), 0.26 (95% CI: 0.11, 0.60), and 0.29 (95% CI: 0.12, 0.68), respectively (p for trend< 0.001). Overall, we observed a downward trend in GDM with higher DTAC among participants. This trend remained consistent even after adjusting for confounders, indicating that the protective association of DTAC with GDM is independent of body mass index (BMI) (kg/m2), occupation, age, hypertension, diabetes, education, and working rotating shift (aRR: 0.29, 95% CI: 0.12, 0.68). These findings strongly support the hypothesis that there is an association between DTAC and GDM using propensity score–based inverse probability weighting (IPW). Consistent with our study, another case-control study found that a significant association between higher FRAP and a reduced risk of GDM, with an 85% lower risk in the highest FRAP tertile (OR: 0.15; 95% CI: 0.08–0.29). However, they did not find significant associations for TRAP (OR: 1.62; 95% CI: 0.94–2.79) or TEAC (OR: 1.56; 95% CI: 0.89–2.72) [29]. Our study is a prospective cohort study that included 1856 pregnant women in their first trimester from the MATCH cohort. In contrast, Daneshzad et al. conducted a hospital-based case-control study with 463 pregnant women, comprising 263 healthy individuals and 200 with GDM. This difference in study design and population size is significant, with our cohort being larger and longitudinal, potentially providing a more comprehensive overview of dietary impacts over time. In comparing our prospective cohort study with the case-control study conducted by Daneshzad et al., several strengths of the cohort study design become evident. A key strength of cohort studies is the ability to establish a clear temporal relationship between exposure and outcome [30]. In our study, DTAC was assessed during early pregnancy, before the development of GDM. This prospective design ensures that the exposure (DTAC) precedes the outcome (GDM), which strengthens the argument for a potential causal relationship. Cohort studies allow for more comprehensive data collection on a wide range of potential confounders. In our study, detailed information on prepregnancy dietary intake, as well as other lifestyle and demographic factors, was gathered prospectively. This allows for better adjustment and control of confounding variables in the analysis, which enhances the validity of the findings [31]. While case-control studies can adjust for confounders, they are generally more limited in the data they can collect retrospectively. Cohort studies enable direct calculation of RRs, providing a more intuitive measure of the association between exposure and outcome [32]. In our study, we calculated the incidence of GDM and the RR reduction associated with higher DTAC scores. Case-control studies, on the other hand, typically provide odds ratios, which can be less straightforward to interpret, especially when the outcome is not rare. Odds ratios tend to overestimate the strength of the association compared to RRs, particularly when the outcome of interest is not rare. This exaggeration occurs because the odds of an event are inherently more extreme than the probability of an event [33]. When case-control studies are necessary and ORs are used, it is important to acknowledge the potential for exaggeration and, where feasible, to provide context by estimating the corresponding RR. This approach helps ensure that the reported associations are interpreted correctly and applied appropriately in public health and clinical settings [33, 34].
Several studies have investigated the association between DTAC and the glycemic index in prediabetes and diabetic individuals. Sotoudeh et al. conducted a case-control study to investigate the association between DTAC and prediabetes morbidity. The study included 300 participants from a Diabetes Screening Center in Iran, comprising 150 individuals with prediabetes and 150 controls. The findings indicated that higher DTAC was associated with a lower likelihood of prediabetes, with participants in the highest quartile of DTAC having an 82% reduced odds of experiencing prediabetes compared to those in the lowest quartile (OR: 0.18, 95% CI: 0.07, 0.49) [35]. Cyuńczyk et al. conducted a study to investigate the relationship between DTAC and the occurrence of prediabetes, diabetes, and insulin resistance in the Bialystok PLUS (Polish Longitudinal University Study) population. They assessed daily food consumption using 3-days 24-hour dietary recalls and calculated DTAC using the FRAP method. The study included measurements such as fasting glucose, 2-hour postprandial glucose, fasting insulin, and glycated hemoglobin to identify prediabetes, diabetes, and insulin resistance (Homeostatic Model Assessment for Insulin Resistance) (HOMA-IR). Their findings, analyzed using logistic regression and multivariate linear regression models, indicated that higher quartiles of DTAC were significantly associated with reduced odds ratios for the prevalence of prediabetes in individuals aged 35-65 years from the Bialystok PLUS population. DTAC was also inversely associated with HOMA-IR, suggesting a beneficial role in reducing insulin resistance. Additionally, DTAC showed positive associations with individual dietary antioxidants such as polyphenols, antioxidant vitamins, and minerals [36].
Li’s study analyzed data from 12,467 participants enrolled in the Natural Population Cohort of Northwest China: Ningxia Project to explore the associations of dietary antioxidant quality scores (DAQS), DTAC, and T2DM risk. Dietary intake was assessed using a validated semi-quantitative food frequency questionnaire. DAQS were calculated based on intake levels of vitamins A, C, and E, zinc (Zn), and selenium (Se), while DTAC was estimated using the ferric-reducing ability of plasma assay. Among the participants, 1,238 (9.9%) were diagnosed with T2DM. After adjusting for confounding factors, higher DAQS were associated with a reduced risk of T2DM, particularly in the highest tertile for vitamins A, E, and Se. Specifically, compared to the lowest tertile, the ORs for T2DM were 0.78 (95% CI 0.67–0.91, P-trend = 0.008) for vitamin A, 1.34 (95% CI 1.15–1.56, P-trend < 0.001) for vitamin E, 0.83 (95% CI 0.71–0.97, P-trend = 0.007) for Se, and 0.86 (95% CI 0.74–1.01, P-trend = 0.033) for Zn in the highest tertile [37].
The mechanism of DTAC in reducing GDM can be categorized into two groups. The first mechanism is through controlling blood sugar which can act in two different ways. First, antioxidants like flavonoid and polyphenols in the diet can disturb carbohydrate digestion by inhibiting alpha-amylase in the mouth and glucosidase in the gut, reducing postprandial glucose. The second way is by the binding ability of polyphenols to the GLUT2 protein, which take up glucose from the blood and transfers it to hepatocytes for glycolysis and gluconeogenesis, thereby facilitating a lower glycemic effect. Additionally, thioredoxin reductase-1, glutathione peroxidases, heme oxigenase-1, and glutathione-S-transferases are involved in the antioxidant-response elements controlled by polyphenols when they activate the nuclear factor-2 erythroid related factor-2 signaling pathway [38]. Due to the lack of enzymatic antioxidants, pancreatic beta cells would be susceptible to the detrimental impact of oxidative stress. This condition impairs the mitochondria, reduces insulin secretion, and elevates glucose levels in the bloodstream [39, 40]. Insufficient antioxidant defense and the increase in reactive oxygen species lead to damage to organelles and enzymes, intensification of protein and lipid peroxidation, and development of insulin resistance. [41, 42]. Hence, it is crucial to consume adequate amounts of antioxidants to maintain glucose homeostasis [29].
There are several strengths in the current study. First, our data are from a prospective cohort study and food intake was assessed with a validated FFQ. Second, we analyzed the data considering known confounders, including BMI (kg/m2), occupation, age, hypertension, diabetes, education, and working rotating shift of the participants which allowed analysis of the relationship between DTAC and GDM. DAGs are a powerful tool for identifying and managing confounding variables in epidemiological research. In our study, we employed DAGs to discern the minimal sufficient set of confounders necessary to estimate the association between DTAC and the risk of GDM. This methodological choice offers several advantages over traditional statistical approaches. DAGs are graphical representations that illustrate the association between variables [43, 44]. Each node represents a variable, and directed edges (arrows) indicate the direction of causality. The acyclic nature of these graphs ensures that there are no feedback loops, thereby facilitating a clear depiction of the temporal sequence of events and dependencies among variables. By mapping out these relationships, DAGs help researchers identify which variables need to be controlled for to obtain an unbiased estimate of the causal effect of an exposure on an outcome. One of the primary strengths of using DAGs is their ability to visually and analytically identify confounders—variables that are related to both the exposure (DTAC) and the outcome (GDM) and that, if not properly controlled, can bias the estimated effect. Traditional statistical methods often rely on automated variable selection procedures or researcher judgment, which can lead to either over-adjustment (controlling for variables that are not true confounders) or under-adjustment (failing to control for necessary confounders). Over-adjustment can reduce statistical power and introduce bias, while under-adjustment can leave residual confounding [45].
DAGs provide a structured approach to confounder identification by explicitly modeling the causal pathways and allowing researchers to determine the minimal sufficient adjustment set. This set includes only those variables that block all back-door paths (non-causal paths) from the exposure to the outcome, thus ensuring that the estimated effect is not confounded. In our study, we used the web tool dagitty.net to construct and analyze the DAG, which facilitated the identification of the minimal sufficient set of variables for adjustment [46, 47]. Our study also has some limitation. One limitation of our study is the potential for selection bias due to the utilization of a specialized gynecological hospital in eastern Tehran. While this approach ensured that our sample comprised pregnant women who were at risk for the outcomes of interest, it may limit the generalizability of our findings to the broader population of pregnant women. Selecting participants from a single specialized hospital could introduce a degree of selection bias, as the patient population might differ from those receiving care in other settings or geographic locations.
However, we intentionally chose a population at risk to ensure that our study outcomes, such as GDM, were relevant to the sample. If we had selected our sample from the general community, we risked including individuals who were not pregnant or did not intend to become pregnant, thereby compromising the applicability of our findings. Additionally, our inclusion and exclusion criteria were not overly restrictive, allowing for a diverse sample that enhances the generalizability of our results. Despite this limitation, we believe our findings are applicable to a broad population of pregnant women. Future studies should consider including multiple centers and diverse geographic locations to further enhance the generalizability and external validity of the results. Another notable limitation of our study is the absence of data on insulin resistance indices, which precludes a comprehensive investigation into the effects of DTAC on insulin levels. Insulin resistance is a well-established major risk factor for the development of type 2 diabetes and GDM. Understanding the association between DTAC and insulin resistance could provide deeper insights into the potential protective mechanisms of dietary antioxidants. However, due to the lack of direct measurements of insulin resistance, such as HOMA-IR or other relevant biomarkers, we are unable to evaluate how DTAC influences insulin sensitivity and beta-cell function. Future research should include these indices to elucidate the pathways through which dietary antioxidants may impact glucose metabolism and insulin action. Despite this limitation, our findings contribute valuable knowledge to the field, suggesting an inverse association between DTAC and the risk of GDM. Nonetheless, further studies incorporating insulin resistance measurements are essential to fully understand the underlying mechanisms and to validate our results.
Performance bias, or information bias, can occur when knowledge of the subject’s exposure status influences the ascertainment of outcomes, such as gestational diabetes mellitus GDM. This bias can potentially skew study results if not addressed effectively. In our study, we implemented comprehensive quality assurance and quality control measures to mitigate the impact of performance bias. These measures included thorough participant-tracking techniques from the outset of the study, ensuring that contact information was up-to-date and accessible. To maintain data integrity, we regularly monitored data quality, with weekly checks for interviewer bias and monthly independent reviews of a subset of data. Our interviewers underwent rigorous training sessions and adhered to standardized protocols outlined in a training handbook, promoting consistency in data collection procedures. These efforts were crucial in minimizing the risk of bias by ensuring that the ascertainment of GDM was conducted objectively and uniformly across all study participants. By detailing these measures in our published protocol, we aimed to enhance transparency and demonstrate the reliability of our study findings despite the inherent challenges of information bias in observational research. These quality assurance and control techniques underscore our commitment to producing robust and credible evidence in assessing the association between DTAC and GDM risk.
Conclusion
Further analysis of the data suggests that this relationship is not merely coincidental, but rather points to a potentially significant causal link between the two variables. This study represents an important step forward in our understanding of the factors that contribute to the development of GDM, and may pave the way for new and more effective approaches to prevention and treatment.


Responses