The biomechanical evolution of the uterus and cervix and fetal growth in human pregnancy

Introduction
Pregnancy and parturition are remarkably mechanical processes orchestrated by the growth, remodeling, and activity of maternal reproductive and gestational tissues. From the nonpregnant state to term gestation, the uterus, a thick-walled organ comprised predominantly of smooth muscle cells sheathed in extracellular matrix, must remain quiescent as it grows in mass from about 70 to 1100 grams and stretches to accommodate intrauterine contents of around 10 milliliters in the nonpregnant state to 5 liters1,2. As the uterus is stretched, the cervix, a collagen-rich organ connecting the intrauterine cavity to the vaginal canal, must remain closed to retain the fetus as it develops3. Similarly, the fetal membranes, a thin multi-layer tissue enclosing the fetus and amniotic fluid, must remain intact to provide mechanical support and protection from infection to the growing fetus4. At the time of parturition, these functions must all be reversed: the fetal membranes rupture, the cervix dilates, and the uterus contracts to allow for vaginal delivery. Though the exact mechanism(s) controlling these changes is unknown, it is clear that the mechanical failure and mistiming of these tissues can have catastrophic consequences.
In the prenatal period, one of the most common and dangerous outcomes is preterm birth (PTB, live birth before 37 weeks gestation). Globally, more than 1 in 10 babies is born preterm, and PTB-related complications are the leading cause of death for children under 5 years of age5. Cited causes of PTB with biomechanical implications are uterine overdistention, preterm premature rupture of membranes, and cervical insufficiency6. Still, the pathophysiology and interplay of these conditions remain unknown, and 70–80% of PTB is spontaneous and unexplained6,7. The inability to accurately predict why and in whom PTB will occur has led to a lack of effective therapies for PTB prevention8. To truly understand how maternal reproductive anatomy supports the intrauterine load in uncomplicated pregnancies and target therapies in pregnancies at high risk for PTB, we must pursue computational approaches.
Pregnancy is a protected environment. Thus, in-silico approaches based on non-invasive measurements, such as ultrasound, are one of the only viable options for elucidating the biomechanical features of the pregnant environment. Large institutional bodies have recognized the importance of computational modeling and simulation in clinical trials and device design, with the United States Food and Drug Administration (FDA) forming the Modeling and Simulation Working Group in 2016 and the American Society of Mechanical Engineers (ASME) releasing a standard for the verification and validation of computational models specifically for medical devices in 20189,10. Advancements in in-silico methods for clinical study have facilitated vast research in fields such as cardiovascular, cartilage, and tumor growth biomechanics11,12,13. These methods can be used as digital twins to predict disease progression and tailor medical devices to individual patient needs. In pregnancy, these patient-specific models could include details such as previous cesarean section scars14,15. The key roadblock in using computational methods to study and design devices for pregnancy complications, such as PTB, is a lack of data on biomechanical changes in human maternal reproductive tissues across gestation.
The first in-vivo data on maternal reproductive anatomy size and shape during pregnancy was published in 1950, where 15 pregnant uteri were imaged via x-ray at regular intervals from 18 weeks of gestation until term, reporting outlines of the outer uterus and ratios of the inferior-superior to anterior-posterior uterine lengths16. However, x-ray imaging does not capture soft tissues well and is not commonly used in prenatal care today16. In 2010, ultrasound techniques were used to estimate uterine wall tension across gestation in 320 pregnancies (294 term singletons, 15 preterm singletons, and 11 twins), collecting measurements of inferior-superior, anterior-posterior, and left-right uterine diameter with anterior uterine wall thickness, though no cervical measurements were included17. The cervix is the most scrutinized of the maternal anatomic features during pregnancy, as cervical length can be used as a predictive tool for PTB, and time-course studies of cervical length and stiffness have been reported18,19. In 2021, our team published the first datasets on uterine and cervical dimension measurements, cervical stiffness data, and computer-aided design (CAD) models of the uterus and cervix across gestation in 29 uncomplicated pregnancies, making all data and models publicly available to create wider opportunity for in-silico pregnancy research20,21.
In this study, we build upon previous work to quantify anatomical and biomechanical changes in the uterus and cervix across gestation in pregnant participants at low risk for PTB. Our approach is to parametrically assess the size and shape of the uterus and cervix through a clinically implementable two-dimensional (2D) ultrasound protocol and measure in-vivo cervical stiffness via aspiration20,22. Additionally, we use these parametric measurements to generate patient-specific CAD models across gestation. We present the following for pregnancies at low risk for PTB: (1) parametric dimension measurements of the uterus and cervix across gestation, (2) measurements of cervical stiffness via aspiration (Pregnolia AG, Schlieren, Switzerland), (3) the effects of gestational age on maternal reproductive anatomy with comparisons to previously published data18,20,21, (4) patient-specific parametric CAD models of the uterus and cervix to estimate uterocervical tissue volume (Solidworks, Dassault Systémes, Vélizy-Villacoublay, France), and (5) corresponding measurements of fetal size and amniotic fluid level. This work makes available coordinated, patient-specific measurements of maternal reproductive tissue, the fetus, and cervical stiffness across gestation.
Results
Fifty participants were recruited to and participated in the study. Two participants delivered preterm (before 37 weeks gestation), and one miscarried. These participants were excluded from the analysis. Patient demographics for the remaining 47 participants are reported in Table 1.
Not all participants could make it to all four research visits, which occurred in the late first (L1), middle second (M2), late second (L2), and middle third (M3) trimesters. Additionally, not all research visits could include cervical stiffness measurement. A summary of how many participants attended during each research visit and the number of ultrasonic and aspiration measurements collected is presented in Supplementary Table 1.
Maternal ultrasonic measurements
Ultrasonic measurements of maternal anatomy varied across participants, and gestational age impacted each maternal anatomy dimension differently. All intrauterine diameters increased across gestation (Fig. 1). Overall, the inferior-superior intrauterine diameter (IS-UD) increased by 8.2 mm/week, the anterior-posterior intrauterine diameter (AP-UD) by 2.1 mm/week, and the left-right intrauterine diameter (LR-UD) by 6.3 mm/week (Table 2). The periods of greatest increase differed between intrauterine diameters, with the largest slope for IS-UD between L1-M2 (10.5 mm/week) and the largest slope for AP-UD and LR-UD between M2-L2 (2.4 and 8.7 mm/week, respectively).

a Inferior-superior (IS-UD), b anterior-posterior (AP-UD), and c left-right (LR-UD) intrauterine diameter with gestational age for all participants. The dotted line marks the overall slope, and participants are color-coded by parity (blue = nulliparous, orange = parous).
Lower uterine segment thickness (LUS-UT) and cervical length (CL) decreased as gestational age increased. LUS-UT significantly decreased across gestation (Table 2), with the most significant thinning between L2-M3 (−0.1 mm/week). The overall slope of CL decrease (Fig. 2) was −0.2 mm/week (Table 2), with the greatest and only significant between-visit decrease in L2-M3 (−0.5 cm/week). No parity-based statistically significant mean differences were found for any maternal measurements included in the analysis (Supplementary Table 2). Of note, transvaginal images taken during a lower uterine segment contraction (n = 18) were not included in the slope analysis.
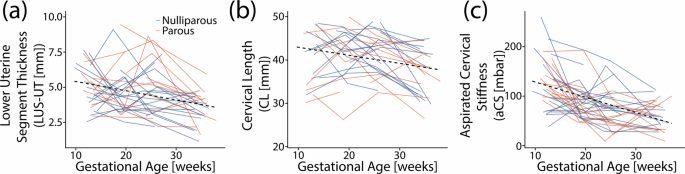
a Lower uterine segment thickness (LUS-UT), b cervical length (CL), and c aspirated cervical stiffness (aCS) with gestational age for all participants. The dotted line marks the overall slope, and participants are color-coded by parity (blue = nulliparous, orange = parous).
Aspirated cervical stiffness measurements
The aspirated cervical stiffness (aCS) values found across participants throughout gestation fell within previously reported values for pregnancies at low risk for PTB (Fig. 2), with ranges similar to that reported in Badir et al.18. Across gestation, cervical stiffness decreased with increasing gestational age by −3 mbar/week (Table 2). The only significant change in cervical stiffness between visits was L1-M2 (−5 mbar/week). This was also the largest decrease between visits. No statistically significant differences were found in aCS based on parity (Supplementary Table 2).
Estimated uterocervical volume and fetal weight
The estimated uterocervical volume (EUV) and estimated fetal weight (EFW) increased for all participants across gestation (Fig. 3). There was a positive relationship between all intrauterine diameters (IS-UD, AP-UD, and LR-UD) and EFW (Fig. 4). A linear regression was fit for each, with R2 values between 0.69 and 0.79.
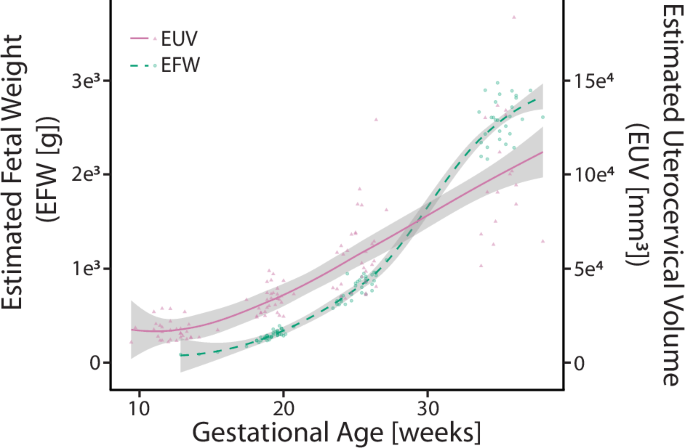
Mean estimated uterocervical volume ([mm3], solid fuschia line) and estimated fetal weight ([g], dashed teal line) across gestation with the standard deviation of each line (gray). Individual data are plotted as triangles (EUV) and circles (EFW).
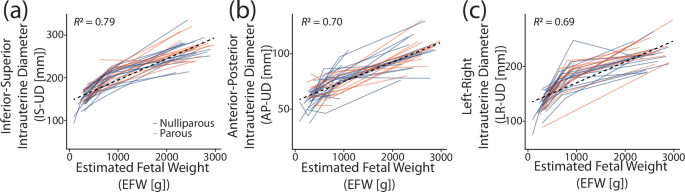
a Inferior-superior (IS-UD), b anterior-posterior (AP-UD), and c left-right (LR-UD) intrauterine diameters with corresponding estimated fetal weight (EFW). Individuals were plotted according to parity (orange = nulliparous, blue = parous).
Discussion
This novel clinical dataset of human pregnancy presents time-course measurements of maternal uterocervical geometry, cervical stiffness, and fetal size. Participants attended four research visits from the late first to the middle third trimesters, during which 2D ultrasound images of the uterus, cervix, and fetus were acquired. Many of the results from this study support existing findings: intrauterine diameters increased with gestational age to accommodate the growing fetus and increasing amniotic fluid volume, LUS-UT thinned across gestation, aCS decreased most in early gestation, and CL decreased most in late gestation. Others, such as the dependence of the intrauterine diameter growth rate on gestational age, provide quantitative results to previous qualitative findings. Select findings provide new insights into the loading of maternal tissues as gestation progresses, e.g., LUS-UT thinned most in late pregnancy. Finally, novel data generated in this study provide the first investigation on the concurrent growth of the fetus and maternal tissues during pregnancy on an individual basis via the uterocervical solid models and the estimated fetal weight. Thus, this study bolsters previous findings on human pregnancy biomechanics and spurs future digital twin studies by offering the most holistic biomechanical dataset to date.
In analyzing the intrauterine diameter between-visit slopes, we found that the rate of increase is dependent on gestational age, which had been previously described but not quantified16. We also observed anatomical direction dependence in intrauterine diameter growth, with the largest increase found in IS-UD, the smallest in AP-UD, and LR-UD falling in between. These findings suggest the least amount of mechanical resistance to uterine growth is present on the superior end of the uterus. The superior end of the uterus abuts primarily soft internal organs, whereas the inferior end is bound by the bony pelvis. A bony barrier may also provide the mechanical rationale for why AP-UD increased less than LR-UD, with the AP-UD boundaries (anterior = abdominal wall, posterior = spine) more restrictive than the LR-UD boundaries (left and right = lateral wall). This finding is independent of maternal position, which we investigated using our previous study of maternal anatomy across pregnancy in both the standing and supine position, with the AP-UD slope smaller than the LR-UD slope at all gestational time points (Supplementary Table 3)20. However, maternal positional differences in AP-UD trends were found between standing and supine, indicating that maternal position must be considered in future studies of uterine growth (Supplementary Table 3)20. Additionally, given the positive relationship between EFW and the intrauterine diameters, estimation of IS-UD, AP-UD, and LR-UD from EFW is possible in scenarios where extended field-of-view imaging is not available and exact intrauterine diameter values are not necessary (Fig. 4). However, R2 values for the linear relationship were not particularly high (between 0.69 and 0.79). Thus, other mathematical relationships between EFW and the intrauterine diameters should be explored.
Features of cervical remodeling palpable to the clinician include decreasing cervical stiffness and length. As has been previously reported, aCS decreased with gestational age, along with CL and LUS-UT. aCS and CL decreased significantly across gestation, though their greatest rates of decrease did not occur concurrently. The cervix softens the most between the late first and middle second trimester, whereas the cervix shortens the most between the late second and early third trimester (Table 2). This trend of cervical softening before shortening has been reported in previous cervical aspiration studies in humans18,23. Numerous studies in rodents and macaques support this finding and provide insight into the underlying tissue changes24,25. Specifically, though the collagen content (per dry weight) in the cervix remains constant during pregnancy, its hierarchical structure remodels drastically through constant synthesis, assembly, and degradation of collagen fiber components25,26,27; in the nonpregnant cervix, collagen fibers are highly organized and cross-linked. As pregnancy progresses, collagen crosslink maturity declines the most in mid-pregnancy, corresponding to the fastest decline in tissue stiffness25,27. Furthermore, the LUS-UT decrease was statistically significant across gestation and between the late second and middle third trimesters (Table 2). Our work demonstrating the dynamic profile of cervical length and stiffness changes suggests that, while the cervix softens early in pregnancy, the mechanical load from the uterine wall’s pull and the amniotic sac’s push is not large enough to deform it until the late second trimester when the LUS thins and cervix shortens at its fastest rate as fetal growth accelerates (Fig. 3).
Several other existing studies involving measurements of LUS-UT across gestation agree with our findings. Degani et al. reported a significant decrease in LUS-UT in 25 uncomplicated pregnancies at 8-week intervals between 15 and 39 weeks gestation28. Similarly, Ginsberg et al. found the lower uterine segment to thin with increasing gestational age in a cross-sectional study of 350 singleton uncomplicated pregnancies from 15 to 42 weeks gestation29. Neither of these studies analyzed the rate of thinning at different gestational time points28,29. Durnwald et al. evaluated LUS-UT in a cross-sectional study of 175 singleton uncomplicated pregnancies in the first, second, and third trimesters30. Dissimilar to our findings, they reported significant lower uterine segment wall thinning between the first and second, but not between the second and third trimesters30. A key methodological difference between Durnwald et al. and our study is the protocol for the LUS-UT measurement, which was done 2cm above the internal os in a transabdominal image with a full bladder, whereas we measured the thinnest segment of the anterior uterine wall in a transvaginal image with an empty bladder30. A detailed comparison between the data presented here and an existing longitudinal cohort study is presented in the Supplementary Material20. Both cohorts demonstrate a significant difference in overall LUS-UT slope, with the existing cohort exhibiting a statistically significant decrease between each research visit (Supplementary Table 5)20. No statistically significant differences in between-visit LUS-UT slopes are found between cohorts.
Many previous studies show that the cervix softens during pregnancy. Using the same linear regression approach on an existing dataset of shear wave speed across pregnancy by Carlson et al., the overall slope decreased across gestation, with the largest decrease occurring between the late first and early second trimesters, concurring with the aCS slopes presented here (Supplementary Table 5)21. Carlson et al. also found that the greatest decrease in shear wave speed occurred closest to the proximal cervix, with a significant non-linear trend and no significant trends in the distal cervix21. Longitudinal elastography studies have shown softening throughout pregnancy19,31,32,33,34,35, though no others noted significant early softening. It seems important to establish a normal rate of softening, especially early in pregnancy, because premature and/or accelerated softening is logically associated with the risk of PTB. For example, a cervical aspiration study demonstrated that patients presenting for cerclage due to a history of preterm birth and short cervical length have significantly softer cervices than normal controls23. Another demonstration of softening early in normal pregnancy is provided by Badir et al. in a study of 100 patients at low risk for PTB18. Importantly, the aCS mean and standard deviation reported in that study overlap with that of ours (see Supplementary Fig. 1). In summary, the agreement across studies of progression in cervical softening is promising and warrants further material modeling efforts to determine relationships in cervical stiffness changes measured via different modalities.
Though this work presents a novel dataset of maternal and fetal growth with changes in cervical stiffness across pregnancy, it has limitations. Our participants were predominantly White. Thus, the inclusion of participants from underrepresented groups is imperative in future studies. Further, the dataset is incomplete, with missed participant visits due to scheduling conflicts, inclement weather, participant dropouts due to changing providers, the coronavirus pandemic, and being lost to follow-up. Scheduling conflicts also led to a lack of cervical aspiration measurements at some research visits due to the unavailability of trained physicians. While it is likely the large range of cervical stiffness values observed in some participants across the three averaged measurements is due to the viscoelastic behavior of the cervix, with ranges greater than 50 mbar for 16 L1 measurements, 3 M2 measurements, 1 L2 measurement, and 1 M3 measurement, it is possible that other factors could contribute to these measurement ranges. These include cervical surface friction, force applied to the probe during measurement, and differences in inter-operator technique, all of which deserve focused evaluation in future studies. Ultrasonic measurements may be compromised by inter-operator variability20, though we attempted to minimize this by having an experienced clinician verify all dimensions. In some of the research visits, the clinician deemed dimensions “unmeasurable” due to poor visualization and/or acquisition. While this reflects the “real world” situation, these measurements were excluded from statistical analysis, though estimates were used to generate the solid models for the estimated uterocervical volume and are included in the available dataset. The anterior uterocervical angle (AUCA) measurement is considered subjective, and further discussion regarding the AUCA measurement can be found in the Supplementary Material. Finally, measurements of estimated uterocervical volume have not been verified for gestational ages of less than 37 weeks, and thus, it is unknown how errors in ultrasonic measurements may propagate to errors in estimated uterocervical volume.
Methods
A prospective, time-course, observational study of human pregnancy in participants at low risk for PTB was conducted. Maternal reproductive anatomy, fetal size, and amniotic fluid level were measured via two-dimensional (2D) ultrasound and cervical stiffness using the Pregnolia system (Pregnolia AG, Schlieren, Switzerland). Measurements were collected at four time points during gestation: late first trimester (9w3d–15w3d, w = weeks and d = days), middle second trimester (17w3d–20w5d), late second trimester (23w3d–27w1d), and middle third trimester (33w4d–38w0d). Linear regressions were fit to the data to find relationships with gestational age, and T-tests were performed to analyze the effect of parity. All findings were compared to existing datasets on normal pregnancy.
Study design
This was a prospective observational study of ultrasound dimension and cervical stiffness measurements in participants at low risk for PTB at 9w3d–15w3d, 17w3d–20w5d, 23w3d–27w1d, and 33w4d–38w0d gestation.
Participants
Participants were recruited from prenatal care patients at a single tertiary care center in New York, New York. This study was approved by the Columbia University institutional review board (IRB00002973) and was conducted in accordance with federal guidelines and regulations and the Declaration of Helsinki. All participants provided written informed consent. Participants were approached after being introduced to the study by their primary obstetrician and consented to all study protocols prior to research participation. Fifty participants aged 23–41 were recruited and participated in the study from April 8, 2019, to June 17, 2023. Inclusion criteria included being 18 years of age or older, carrying an uncomplicated singleton gestation, and being able to provide informed consent. Exclusion criteria included a current in-vitro fertilization pregnancy, multifetal reduction, history of PTB, history of cervical surgery, history of cervical shortening in the current pregnancy, history of significant vaginal bleeding during pregnancy, history of any major abdominal/uterine surgery, history of cesarean section, abnormal pap smear, persistent cramping, persistent uterine contractions, vaginal bleeding at the time of consent, uterine anomalies, systemic or vaginal infections at the time of consent, on progesterone in the first trimester, fibroids, placenta previa or abnormal placentation, ovarian cysts (other than a corpus luteal cyst), and anything in vaginal canal in last 24 hours at the time of the first research visit.
Participant age, height, weight, race, ethnicity, patient history, social history, and obstetric history were recorded. At each prenatal research visit, participants reported their weight, pregnancy complications since their last visit, and whether they’d had intercourse or other vaginal transaction in the past 24 hours (tampon, yeast medication, etc.). After the participant delivered, the gestational age at delivery and mode of delivery (cesarean or vaginal) was recorded.
Ultrasound and cervical stiffness measurements
Cervical stiffness was measured using the Pregnolia system (Pregnolia AG, Schlieren, Switzerland). This is an aspiration device administered during a speculum exam. Clinicians were trained to use the device following the “instructions for use” documentation and training videos provided by Pregnolia36. The system is operated via a control unit containing a vacuum pump attached to the probe by flexible tubes. The vacuum is turned on via a foot pedal, creating a negative pressure at the probe head, and the clinician brings the probe head into contact with the distal anterior lip of the cervix. Once contact is established, the clinician slides the probe handle to the middle position, and the negative pressure is increased to pull the cervical tissue 4 mm. The vacuum is stopped at this point, and the pressure required to displace the tissue 4 mm is recorded. The measurement is performed three times. The average of these values is reported as the aCS measurement.
Sonographers trained on the study protocol performed prenatal ultrasound examinations. Ultrasounds were collected by sonographers (I.K., I.M., and V.P.) trained on the ultrasound acquisition protocol by the maternal-fetal medicine specialist who initially developed it (C-L.N-C.). Before imaging, participants were asked to empty their bladders. Ultrasound images were obtained using a GE Voluson E8 (GE Healthcare, Chicago, IL, USA). Standard clinical ultrasonic dimensions of the fetus were measured. Crown-rump length (CRL, [cm]) was measured at time point L1, and EFW [grams] was measured at time points M2, L2, and M3. EFW was calculated using the Hadlock I formula, requiring measurements of biparietal diameter (BPD, [cm]), head circumference (HC, [cm]), abdominal circumference (AC, [cm]), and femur length (FL, [cm])37. The maximum vertical pocket (MVP, [cm]) was collected at all time points, and amniotic fluid index (AFI, [cm]) was collected at time points L2 and M3, and occasionally at M2. Both MVP and AFI provide information on the amniotic fluid level. The placenta location was also recorded at all time points.
With the participant in the supine position, the three B-mode research images of maternal anatomy were acquired: transabdominal (TA) sagittal, TA axial, and transvaginal (TV) sagittal. The TA and TV images were collected following the protocol described in our previous work20. The TA images were acquired using extended field-of-view ultrasound imaging, where the probe was swept across the abdomen, and adjacent images were automatically registered to produce one long image. The extended field-of-view feature permitted imaging of the full length of the uterus in one image. The sonographer acquiring the images placed calipers on the images to mark the location of the dimension measurements at the time of image acquisition. Precise dimension measurements were later taken by E.M.L. using Fiji ImageJ38. Maternal-fetal medicine specialists M.H. and C-L.N-C reviewed images and measurements to verify adequate visualization of the structures under study, including notation of any problematic measurements, such as inaccurate cervical length resulting from a lower uterine segment contraction that distorts the anatomy.
From the TA sagittal ultrasonic image, dimension measurements were collected to characterize the overall shape and size of the sagittal uterus and the placement of the cervix, with dimension measurements used in the statistical analysis having an additional anatomically descriptive label (i.e., IS-UD for the inferior-superior intrauterine diameter) for clarity:
-
UD1 (IS-UD): longest inferior-superior intrauterine diameter, measured from the fundal to the lower uterine segment endometrium (Fig. 5a)
-
UD2: anterior intrauterine diameter, measured perpendicularly from midpoint of UD1 to anterior intrauterine wall (Fig. 5a)
-
UD3: posterior intrauterine diameter, measured perpendicularly from midpoint of UD1 to posterior intrauterine wall (Fig. 5a)
-
UD23 (AP-UD): sum of UD2 and UD3, resulting in the anterior-posterior intrauterine diameter (Fig. 5a)
-
UT1: fundal uterine wall thickness, measured as close to the superior end of UD1 as possible (Fig. 5a)
-
UT2: anterior uterine wall thickness, measured at the anterior end of UD2 (Fig. 5a)
-
PCO: perpendicular cervical offset, perpendicular distance between UD1 and internal os (Fig. 5a)
-
UD3a_eq: posterior dimension perpendicular to UD1 at 25% of UD1 from the superior intrauterine wall (Fig. 5a)
-
UD3b_eq: posterior dimension perpendicular to UD1 at 75% of UD1 from the superior intrauterine wall (Fig. 5a)
-
UD3a_ex: extrema perpendicular distance between posterior wall and UD1 superior to UD3, not always applicable (Fig. 5b)
-
UD1a_ex: distance from inferior end of UD1 to UD3a_ex, only measured if UD3a_ex was measured (Fig. 5b)
-
UD3b_ex: extrema perpendicular distance between posterior wall and UD1 inferior to UD3, not always applicable (Fig. 5b)
-
UD1a_ex: distance from inferior end of UD1 to UD3b_ex, only measured if UD3b_ex was measured (Fig. 5b)
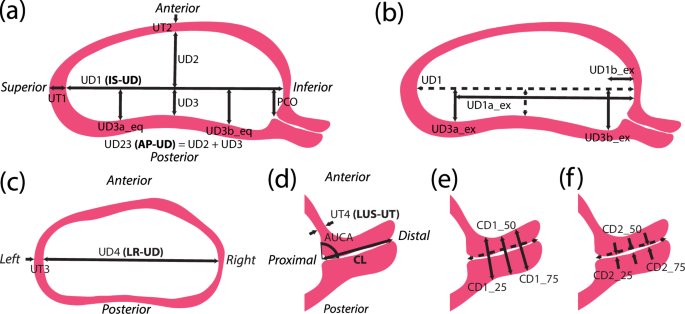
a Measurements collected from sagittal ultrasound images to capture the sagittal uterine shape and placement of the cervix, with measurements of posterior intrauterine diameter taken equidistantly (eq) along UD1. b An alternative method to collecting posterior intrauterine diameter measurements, taken at the superior (UD3a) and inferior (UD3b) extrema (ex). c Measurements collected from axial ultrasound images to capture the axial uterine shape. d Measurements taken from sagittal transvaginal ultrasounds to capture the uterus and cervix. e Measurements of outer cervical diameter taken equidistantly along the cervical length. f Measurements of inner cervical diameter taken equidistantly along the cervical length20,40.
The TA axial ultrasonic image provided the dimensions of the axial uterus:
-
UD4 (LR-UD): longest left-right intrauterine diameter (Fig. 5c)
-
UT3: left/right uterine wall thickness, measured as close to the left or right end of UD4 as possible (Fig. 5c)
Measurements of the cervical size and placement were collected from the TV ultrasonic image:
-
UT4 (LUS-UT): lower uterine segment thickness, measured as the thinnest portion of the visible anterior uterine wall (Fig. 5d)
-
CL: cervical length, measured as the distance between the anatomical internal os (where the anterior and posterior cervix meet in the image) and the external os, inclusive of isthmus length (Fig. 5d)
-
AUCA: anterior uterocervical angle, measured as the angle between the lower uterine segment and cervical canal, placed as 1 cm lines starting at the internal os along the anterior uterine wall and the cervical canal (Fig. 5d)
-
CD1_25: outer cervical diameter measured at 25% of CL from the internal os (Fig. 5e)
-
CD1_50: outer cervical diameter measured at 50% of CL from the internal os (Fig. 5e)
-
CD1_75: outer cervical diameter measured at 75% of CL from the internal os (Fig. 5e)
-
CD2_25: inner cervical diameter measured at 25% of CL from the internal os (Fig. 5f)
-
CD2_50: inner cervical diameter measured at 50% of CL from the internal os (Fig. 5f)
-
CD2_75: inner cervical diameter measured at 75% of CL from the internal os (Fig. 5f)
Estimated uterocervical volume
The estimated uterocervical volume (EUV) was found from solid models generated using the maternal ultrasonic dimensions. Parametric patient-specific CAD models were built in Solidworks 2018–19 (Dassault Systémes, Vélizy-Villacoublay, France) using an existing modeling protocol for all participant visits with ultrasonic dimension measurements (Fig. 6)20.
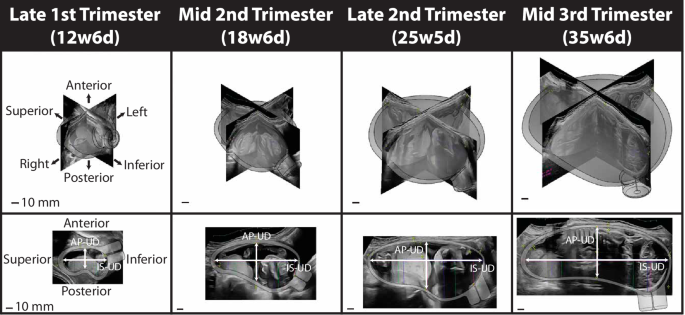
Three-dimensional solid CAD models of the uterus and cervix for one participant from the late first to middle third trimester with the corresponding ultrasonic images. The top row is the isometric view, and the bottom is the sagittal view. The inferior-superior (IS-UD) and anterior-posterior (AP-UD) intrauterine diameters are marked in the sagittal view.
Several updates to the modeling protocol were made to improve the shape and model build rate. First, due to the variability in sagittal posterior uterine wall shape observed between participants and gestational ages, several methods of building the posterior wall were generated based on parametric measurements collected (updating Fig. 5a in Louwagie et al.20). If both the superior (UD3a) and inferior (UD3b) posterior diameter measurements were collected as extremum (ex), quarter ellipses were used at the inferior and superior ends of the uterus with a spline connecting them through the middle posterior diameter (UD3) (Fig. 7a). A spline was used for the entire posterior uterine profile if no posterior diameters were measured as extremum, thus using the equidistant (eq) approach (Fig. 7b). Finally, if only one of the inferior (Fig. 7c) or superior (Fig. 7d) posterior diameter measurements were collected as extremum, a quarter ellipse was used at the end with the extremum measured, and a spline connecting the middle posterior diameter and equally placed measurement of posterior diameter to the end of the inferior-superior axis.
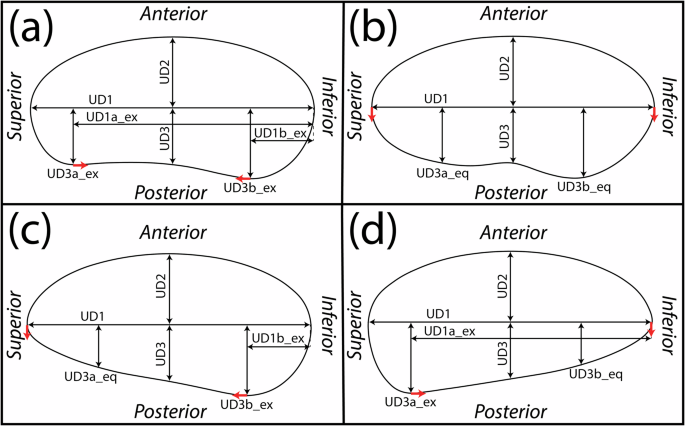
Method to model the sagittal uterus when a both superior (UD3a_ex) and inferior (UD3b_ex) posterior intrauterine diameters are taken as extrema, b both superior (UD3a_eq) and inferior (UD3b_eq) are taken equidistantly along the inferior-superior axis, c only the inferior (UD3b_ex) is taken as extrema, and d only the superior (UD3a_ex) is taken as extrema. Red arrows depict the ends of the spline, where tangency constraints are enforced.
The method of generating the uterine body was also updated, with an inferior-superior loft through axial profiles used rather than a left-right loft function, updating Fig. 5c in Louwagie et al.20. The coronal uterine shape was still modeled as an ellipse, with elliptical profiles placed coincidentally with UD3a and UD3b (Fig. 8a). The intrauterine diameters at these locations were assigned by their location within the coronal ellipse defined by UD1 and UD4, with UD4a given by Eq. (1) and UD4b given by Eq. (2).
For the outer uterus, Eq. (1) and Eq. (2) were modified such that the superior and inferior uterus were defined to include uterine wall thicknesses (UT1 and UT4, respectively). The anterior-posterior diameter of the axial elliptical profiles was defined by the sagittal uterine profile (Fig. 8b), and the loft function was executed using the sagittal profile as guides (Fig. 8c).
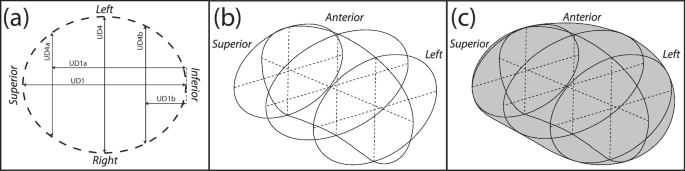
a Elliptical profiles placed at UD1a, the midpoint of UD1, and UD1b are used as loft profiles, with b the anterior and posterior sagittal outlines used as loft guidelines c resulting in the final uterine body.
The EUV was found using the “Mass Properties” tool within Solidworks.
Statistical analysis
Patient characteristics, intrauterine diameters (IS-UD, AP-UD, and LR-UD), LUS-UT, CL, and aCS were analyzed in RStudio version 1.3.105639. Ultrasound measurements and cervical stiffness were analyzed using a linear regression accounting for differences in both parity and participant. Welch’s t-tests were used to determine measurement differences between cohorts and visits. For the slope comparisons, the hypothesis is that there is no difference between the measurements from the two time points being assessed. The assessed slopes are overall (L1-M3) and between visits (L1-M2, M2-L2, L2-M3). P-values under 0.05 are considered significant and denoted by a star. Means, standard deviations, and regression coefficients were calculated in R. All graphs were created in R.


Responses