The branched N-glycan of PD-L1 predicts immunotherapy responses in patients with recurrent/metastatic HNSCC

Introduction
Head and neck squamous cell carcinoma (HNSCC) is the sixth most common cancer worldwide with approximately 67,000 new patients annually [1]. Although surgical resection followed by adjuvant chemoradiotherapy is applied to all advanced HNSCC cancers, around 50% of patients relapse after primary treatment [2]. The recurrence after multidisciplinary treatment is often incurable, leading to a devastating prognosis [3]. Owing to the success of immunotherapy with the anti-programmed cell death protein 1 (PD-1) agents nivolumab and pembrolizumab, treatment options for recurrent and/or metastatic (R/M) HNSCC are no longer limited to platinum drugs and cetuximab [4,5,6,7]. Compared to traditional chemotherapeutic agents, immunotherapy has demonstrated higher efficacy and lower toxicity, providing great benefits for heavily treated patients. However, the response rate of single-agent immunotherapy is only 15–20%, and current clinical trials suggest combining immunotherapy with chemotherapy if PD-L1 expression in tumors is low [5].
Programmed death ligand 1 (PD-L1) was discovered in 1999 and later known as an immune checkpoint molecule [8]. Cancer cells express PD-L1 to interact with the PD-1 on T cells, resulting in inhibition of T cell activation [9]. Antibodies blocking PD-L1 or PD-1 gained unprecedented success and cured refractory cancers [9, 10]. These findings revolutionized cancer treatment and led to a Nobel Prize in Medicine in 2018 shared by Jim Allison and Tasuku Honjo. However, there are still some challenges regarding immune check point inhibitors (ICIs). Firstly, while durable and complete treatment responses from ICIs are observed in some individuals, the majority of patients fail to respond. Secondly, reliable biomarkers predicting treatment response are lacking [11]. In a clinical setting, PD-L1 expression is routinely evaluated by immunohistochemistry (IHC); however, its expression is notoriously dynamic and poorly correlates with treatment response [12, 13]. It remains a dilemma whether to indiscriminately treat all patients with ICIs regardless of the high costs and low response propensity. The frustration encountered by patients who failed to respond to ICIs urges the needs for better biomarkers.
MGAT5 regulates the biosynthesis of complex N-glycans, a process highly conserved in mammals [14]. It is also one of the most characterized cancer-associated glycosyltransferases [15, 16]. By controlling the complex N-glycan synthesis of EGFR, TGFR (TGF-beta receptor), integrin, E-cadherin, and N-cadherin, MGAT5 regulates activation of cellular signaling pathways, reorganization of the actin cytoskeleton, cell-cell adhesion, and cell migration [17,18,19,20,21,22]. In addition, Mgat5 knockdown in breast cancer cells promotes activation of CD4+ T cells in vitro [23]. Mgat5 induced by IL-10 enhances N-glycan branching of TCR and inhibits CD8+ T cell function [24]. The plant lectin Phaseolus vulgaris leukoagglutinin (PHA-L) binds specifically to mature MGAT5 products. PHA-L staining is detected in oral squamous cell carcinoma (OSCC) and is associated with the metastatic potential [25]. Interestingly, increased PHA-L staining in OSCC tumors is also associated with decreased stromal infiltration of macrophages, suggesting a potential role of MGAT5 and its glycan products in tumor-immune cell interactions. Recent studies discovered that the N-glycosylation of PD-L1 is critical for its interaction with PD-1 and subsequent modulation of the TCR signaling pathway [26, 27]. Suppression of MGAT5 is associated with improved CAR T cell therapy by interfering the PD-L1/PD-1 axis [28]. Whether MGAT5 controls N-glycan branching on PD-L1 and its potential impact on immune checkpoint inhibition in cancer therapy remain unexplored.
In this study, we observed elevated levels of PHA-L staining and MGAT5 expression in HNSCC tumors. Using a glycoproteomic approach, we identified 163 potential protein substrates of MGAT5, and their function is associated with T cell proliferation and activation. We demonstrated that MGAT5 regulates the formation of β1,6-N-acetylglucosamine (GlcNAc) branched N-glycans on PD-L1, potentially at N35 and N200. MGAT5 protected HNSCC cells from CTL killing via the PD-L1/PD-1 pathway. Notably, patients with MGAT5-positive tumors had a better response to the anti-PD-1 therapy than those with MGAT5-negative tumors. These findings suggest that MGAT5 could be a novel biomarker for predicting patients’ responses to anti-PD-1 therapy, and targeting the branched N-glycans on PD-L1 may be an attractive anti-cancer strategy.
Materials and methods
Immunohistochemistry and the scoring system
Sections were deparaffinized using xylene, a series of graded ethanolic solutions, and distilled water. Tissues were then permeabilized using Triton™ X-100 (1:100, Sigma-Aldrich, St. Louis, MO) at room temperature for 10 min, followed by antigen retrieval in citrate buffer (10 mM Sodium Citrate, pH 6.0) at 37 °C for 10 min. Next, sections were blocked with Ultra V Block solution (Thermo Fisher Scientific, Waltham, MA) at room temperature for 5 min. Afterward, sections were incubated with a primary antibody at 4 °C overnight. On the following day, Primary Antibody Amplifier Quanto and AP Polymer Quanto were added sequentially at room temperature for 10 min. Signals were then visualized using the DAB Quanto Chromogen provided in the same kit. All the sections were counterstained with hematoxylin. The primary antibody used was a polyclonal rabbit anti-human MGAT5 (1:400, generated in our lab). PD-L1 expression was evaluated by VENTANA PD-L1 (SP263) assay (Roche Diagnostics, Basel, Switzerland), and TPS was evaluated by a pathologist.
To detect PHA-L binding, lectin histochemistry was performed. Briefly, following the antigen retrieval step, biotinylated PHA-L (1:400, Vector Laboratories, Newark, CA) was incubated with the sections at 4 °C overnight. The binding was captured by Streptavidin-HRP (BioGenex Laboratories, Fremont, CA) and detected using a DAB substrate (Thermo Fisher Scientific, Waltham, MA). Intensity was accessed as follows: score 3 = 66–100% of the tumor cells were intensely labeled; score 2 = 33–65% of cells were intensely labeled; score 1 = 1–32% of cells were labeled; score 0 = none of the cells were labeled. Score 0 was defined as MGAT5-negative and scores 1–3 were defined as MGAT5-positive.
Generation of an anti-MGAT5 polyclonal antibody
Partial sequence of MGAT5 was cloned from SAS cells. The primers used were 5′-GGTACCATGATTACATCTCTGTACTTACT-3′ and 5′- CTCGAGTAGGCAGTCTTTGCAGAGAG-3′. This sequence was inserted to pET30a expression vector with restriction sites of KpnI and XhoI. The recombinant protein (aa I305 – L740) was expressed in Escherichia coli (BL21/DE3 strain). Consecutive 7 doses of recombinant MGAT5, 200 μg with Freud’s complete adjuvant for the first dose and 100 μg with Freud’s incomplete adjuvant for the rest doses, were subcutaneously injected into a New Zealand rabbit. Total 50 ml serum was collected one week after the finial boost. All animal experiments were approved by the Institutional Animal Care and Use Committee of the National Taiwan University College of Medicine, Taipei, Taiwan (IACUC No. 20180161).
To purify the anti-MGAT5 antibody, a peptide containing MGAT5 sequence (H. M. Biological, Taoyuan, Taiwan) was conjugated to SulfoLink™ Coupling Resin (Thermo Fisher Scientific, Waltham, MA). The anti-serum (10 ml) was incubated with peptide conjugated agarose beads at 4 °C overnight. The anti-MGAT5 antibody was eluted using an elution buffer (0.2 M Glycine-HCl, pH2.5) and quickly neutralized using a neutralizing buffer (1 M Tris-HCl, pH8.8).
Generation of MGAT5 knockout cells
To knock out MGAT5, we used the CRISPR/Cas9 system. The small guide RNA (sgRNA) targeting MGAT5 was designed according to database predictions. The target sequence is 5′-GTGGTGGATGGGCCATACGC-3′. SAS cells were transfected with a pAll-Cas9.Ppuro plasmid (National RNAi Core Facility at Academia Sinica, Taiwan) containing Cas9 and sgRNA of MGAT5, and a pSurrogate reporter plasmid containing a sgRNA target sequence located between an in-frame EGFP cassette and an out-of-frame mCherry cassette. Viable mCherry-positive cells were sorted using a 4-laser FACSAriaIII sorter (BD Biosciences, Franklin Lakes, CA) and then cultured in 96-well plates as single cells. Single colonies with successful MGAT5 knockout were confirmed by DNA sequencing and Western blotting. Clones without MGAT5 knockout were used as the control (Mock).
Patient data and tissue samples
Total 40 patients with R/M HNSCC who failed to respond to platinum-based salvage therapy and then received either nivolumab or pembrolizumab between 2016 and 2018 were registered. Treatment response was evaluated after at least three courses of treatment and was based on response evaluation criteria in solid tumors (RECIST) criteria. Patients with stable disease, partial response, and complete remission were considered responders. All human tissues were obtained according to a protocol approved by the Institutional Review Board of National Taiwan University Hospital, Taipei, Taiwan. Written informed consents were obtained from all patients. The IRB number is 202011107RINA. The study methodologies conformed to the standards set by the Declaration of Helsinki.
Cell cultures and transfection
SAS and OEC-M1 cells were a gift from Dr. Jean-San Chia (National Taiwan University) [29]. All cell lines were authenticated by STR DNA profiling analysis. Jurkat cells were purchased from Bioresource Collection and Research Center (Hsin-Chu, Taiwan). The culture medium for SAS cells was Dulbecco′s Modified Eagle (DMEM) supplemented with 10% FBS (Thermo Fisher Scientific, Waltham, MA), and Roswell Park Memorial Institute (RPMI) 1640 supplemented with 10% FBS (Thermo Fisher Scientific, Waltham, MA) for OEC-M1 and Jurkat cells. To knock down MGAT5, cells were transfected with 20 nM siRNAs against MGAT5 (siMGAT5-1: 5′-GAAAGCGGAAGAAAGUCCUCGUUCA-3′, siMGAT5-2: 5′-GGAGACAGAAUUGUUGAGCUCAUUU-3′) using Lipofectamine RNAiMAX (Invitrogen, Waltham, MA). Non-targeting siRNA (siCtr, 5′-CAACCUCAGCCAUGUCGACUGGUUU-3′) was used as a control.
Western blot analysis and lectin pull-down assay
Proteins from cell lysates were separated on an SDS-PAGE and transferred onto a PVDF membrane, which was then blocked in 5% non-fat milk for 1 h at room temperature and incubated with a primary antibody against MGAT5 (1:1000, our lab) or PD-L1 (1:1000, Cell Signaling Technology, Danvers, MA) at 4 °C for overnight. HRP conjugated secondary antibodies (1:10000, Jackson ImmunoResearch, Philadelphia, PA) were used to detect and the protein bands.
For lectin pull-down assay, 500 μg of total proteins from cell lysates were incubated with Phaseolus vulgaris Leucoagglutinin (PHA-L) conjugated beads (Vector Laboratories, Newark, CA) for 18 h at 4 °C with constant rotation. Washed beads were boiled at 95 °C for 10 min, and PHA-L binding proteins were evaluated by Western blot analysis.
N-glycopeptide enrichment by ZIC-cHILIC StageTip and liquid chromatography-tandem mass spectrometry (LC-MS/MS)
Intact N–glycopeptides (GPs) were enriched by ZIC-cHILIC StageTip based on methods that were previously described [30]. Briefly, ZIC-cHILIC StageTip was prepared by capping at one end with a 20 μm polypropylene frits disk (Agilent Technologies, Santa Clara, CA) enclosed in a tip-end fitting, loaded by 40 mg of ZIC-cHILIC materials resuspended in deionized water (100 μL), loaded into a 200 μL tip, and centrifuged at 3000 rpm for 2 min, then flattened the surface by adding 50 μL of deionized water and centrifuged at 6000 rpm for 2 min as a ZIC-cHILIC-StageTip for intact GPs enrichment. The protein digests were reconstituted with 50 μL of 80% ACN/0.5% TFA and loaded into the StageTips and centrifuged at 3000 rpm for 10 min; then, the flow-through was reloaded into StageTip and centrifuged at 4000 rpm for 8 min. The bound GPs were washed with 80% ACN/0.5% TFA (50 μL) twice. The GPs were stepwise eluted using 70% ACN, 65% ACN, and combined 3 elutions using 60% ACN, and 55% ACN, followed by centrifugation at 3000 rpm for 10 min, and finished at 0.5% FA three times with centrifuged at 3000 rpm for 10 min, another 4000 rpm for 8 min, and another 5000 rpm for 6 min. Finally, GPs were dried and resuspended by 20 μL of 0.1% TFA/5% ACN (v/v), desalted by reversed-phase SDB-XC StageTip, eluted by 20 μL of 80% ACN/0.1% TFA, then dried, and dissolved in 0.1% FA for LC-MS/MS. which was performed on Ultimate 3000 nanoLC system coupled with an Orbitrap Fusion Lumos mass spectrometer (Thermo Fisher Scientific, San Jose, CA).
Glycoproteomic data analysis
All raw data were processed by Proteome Discoverer 2.5 (PD2.5; ThermoFisher Scientific, Waltham, MA) integrating with Byonic v4.0 (Protein Metrics, San Carlos, CA). For identification of intact GP, the raw data were queried using Byonic 4.0 with tryptic peptides with less than two cleavage sites, a precursor ion mass tolerance of 10 ppm and a fragment ion tolerance of 20 ppm for HCD spectra and 0.02 Da for EThcD spectra. Protein fasta files, including PD-L1 (Q9NZQ7, CD274) or Human (Swiss-Prot database, v2021-05-06, total 20,324 sequences) were used for protein identification. The built-in human N-glycans database (with 269 N-linked glycans from human and mammalians without NeuGc) were used for identification of glycan composition. Carbamidomethyl (C) was selected as fixed modification, deamidation (NQ) and oxidation (M) were selected as variable (common) modifications. N-glycan was selected as “rare”. Maximum of total common modification was set as 4 and rare modification was set as 1. The reversed peptide sequence identification was also considered with a protein false discovery rate (FDR) of 1%, or 20 reverse counts. The high confidence of GP sequence was also considered the two-dimensional posterior error probability (PEP2D) values with FDR < 0.01. The abundance of identified GPs from each cell was further processed by using chromatographic alignment with m/z and retention time of identified intact GPs in PD2.5 software. The LC-MS/MS data were deposited in the ProteomeXchange Consortium via the PRIDE [31] partner repository with the dataset identifier PXD045506.
The abundance ratio was calculated by the abundance of identified GP compared to sum of overall GPs abundance. The fold change of potential β1,6-branched N-GPs were compared between Mock and MGAT5 knockout SAS cells. Besides, a two-sample t-test was used to estimate the expression difference between two cell types. All tests were performed by two-tailed tests and P < 0.05 were considered significant. Both functional and physical associations of β1,6-branched N-glycoproteins were analyzed by using STRING network with high confidence (≥0.9).
Functional maps of MGAT5 protein substrates
MGAT5 protein substrates identified by the glycoproteomic analysis were used for functional map analysis. Gene Ontology (GO) over-representation analysis was performed on the differentially expressed genes by the enrichGO function in the R package clusterProfiler. Significantly enriched GO terms (P < 0.01) were constructed into an enrichment map [32] and visualized by Cytoscape.
Flow cytometry
Cells (1 × 10⁶) were washed with PBS and then resuspended in FACS buffer. They were incubated with an anti-PD-L1 antibody (1:100, #329701, BioLegend, San Diego, CA) on ice for 30 min. After this incubation, cells were washed, Alexa Fluor 488-conjugated secondary antibodies (1:500, Jackson ImmunoResearch, West Grove, PA) were added on ice for additional 30 min.
Signals were collected on a BD LSRFortessa (BD Biosciences, Franklin Lakes, CA) with FACSDiva software (BD Biosciences, Franklin Lakes, CA), and the data were analyzed using FlowJo (Tree Star, Ashland, OR).
Ligand-binding affinity assays
One hundred micrograms of cell lysates were incubated with plates coated with an anti-PD-L1 antibody (#13684, Cell signaling technology, Danvers, MA) at 4 °C for 18 h. Subsequently, PD-1 Fc (R&D Systems, Minneapolis, MN) was added to the plates and allowed to incubate at room temperature for 2 h. After a gentle wash, an HRP-conjugated goat anti-human IgG antibody (1:10000, Jackson ImmunoResearch, Philadelphia, PA) was added and incubated at room temperature for 30 min. Following another gentle wash, bound-PD-1 Fc was detected by o-phenylenediamine dihydrochloride (OPD) substrates. An ELISA reader was used to detect O.D. at 490 nm.
CTL assay
Jurkat cells were activated with phorbol‑12 myristate‑13 acetate (PMA) (100 ng/mL) and PHA-L (5 μg/mL) for 24 h before being cocultured with cancer cells. The IncuCyte® Caspase 3/7 dye (Essen BioScience, Ann Arbor, MI) was added 24 h prior to coculturing. The effector-to-target ratio was 1:5 and the coculture time was 6 h. The fluorescent signal generated by cleaved dye was detected using fluorescence microscopy and quantified using the ImageJ software. To block PD-1, Jurkat cells were preincubated with control IgG or nivolumab (20 μg/ml, Bio X Cell, Lebanon, NH) for 30 min before coculturing.
PD-L1 purification
Lysates (15 mg) from SAS cells overexpressing HA-tagged PD-L1 were harvested and incubated with Pierce™ Anti-HA agarose (Thermo Fisher Scientific, Waltham, MA) at 4 °C for 18 h. After washing, the captured HA-PD-L1 was eluted with 0.5 mL of 0.2 M glycine (pH 2.5) and then neutralized with 50 μL 1 M Tris (pH 8.8). Eluates were desalted with an Amicon (Merck Millipore) and then run on an SDS-PAGE. The separated PD-L1 was excised and sent for LC-MS/MS analysis (Instrument Center, National Taiwan University, Taipei, Taiwan).
Statistical analysis
Differences in PHA-L binding and MGAT5 expression between non-tumor and tumor tissues were assessed using a paired Student’s t-test. Differences between intensity of fluorescent apoptotic cells were evaluated with a Student’s t-test. Correlations between MGAT5 or PD-L1 expression with treatment responses were evaluated through Fisher’s exact tests. Patients’ survival was analyzed using Kaplan–Meier analysis. P < 0.05 was considered statistically significant.
Results
MGAT5 and its N-glycan products are increased in HNSCC tumors compared with adjacent non-tumor tissues
Branched N-glycans, which can be detected using lectins, are one of the most frequent tumor-associated glycan structures [33]. Here, we showed that staining of PHA-L, which specifically binds to β1,6-GlcNAc-branched N-glycans, was increased in HNSCC tumors compared with adjacent non-tumor tissues (n = 13, Fig. 1A). The synthesis of β1,6-GlcNAc-branched N-glycans is primarily controlled by MGAT5. Consistently, Western blot analysis revealed a significant increase in MGAT5 expression and PHA-L staining in HNSCC tumors compared to adjacent non-tumor tissues (n = 6, Fig. 1B). These results demonstrated that MGAT5 and its glycan products are overexpressed in HNSCC tumors.

A Left, IHC score of PHA-L in 13 paired HNSCC tumors (T) and adjacent non-tumor tissues (N). Data are presented as mean ± SEM. **P < 0.01, analyzed using two-tailed paired Student’s t-test. Right, representative images of PHA-L staining. Scale bars, 50 μm. B Left, Western blot analysis of PHA-L staining and MGAT5 expression in 6 paired HNSCC tumors (T) and adjacent non-tumor tissues (N). GAPDH was the internal control. Right, quantification of PHA-L staining and MGAT5 expression was performed by the ImageJ software. *P < 0.05 and **P < 0.01 analyzed using two-tailed paired Student’s t-test.
MGAT5 regulates pathways related to endothelial cell proliferation, cell-cell adhesion, viral entry into host cell, glycosaminoglycan metabolic process, kinase B signaling, and T cell proliferation and activation
To understand the role of MGAT5 in HNSCC, its protein substrates have to be identified. Two independent MGAT5 knockout clones of SAS cells were generated and used as references to Mock cells. PHA-L pull-down assay showed the near absence of β1,6-branched N-glycoproteins in MGAT5 knockout cells (Fig. S1). We performed global analysis of cellular N-glycoproteins using LC-MS/MS. The abundance of glycopeptides with potential β1,6-branched N-glycans in Mock and MGAT5 knockout cells were analyzed and, as expected, significant decreases were observed in MGAT5 knockout cells (Fig. 2A). We selected out the glycopeptides with potential β1,6-branched N-glycans with fold-change >2 in Mock cells compared to both MGAT5 knockout clones. Finally, the overlapping 447 glycopeptides with potential β1,6-branched N-glycans from 163 glycoproteins were identified as potential MGAT5 substrates (PEP2D < 0.01, Table S1). We further utilized STRING data resource to represent the functional and physiological association of these proteins (Fig. S2).
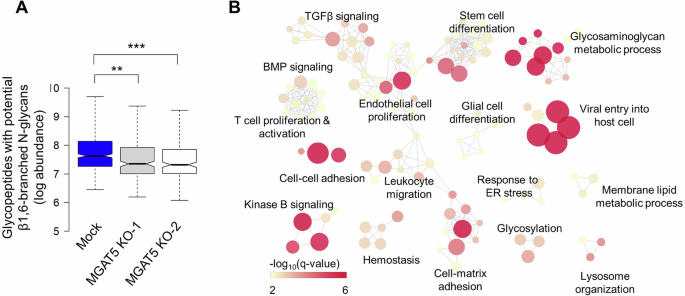
A Abundance of glycopeptides with complex N-glycans Mock or MGAT5 knockout (KO) SAS cells (1 × 10⁷) were snap frozen and sent for mass spectrometry. Abundance of β1,6-branched N-glycopeptides was shown in log scale. **P < 0.01 and ***P < 0.001. B Functional map analysis of potential MGAT5 protein substrates. The over-represented Gene Ontology (GO) terms of 163 protein substrates of MGAT5 (with a P < 0.01) were organized into a network, where each node represented a specific GO term, and an edge signified that two GO terms share common genes.
Next, we performed functional analysis of 163 proteins substrates of MGAT5. Results showed that the MGAT5 substrates regulated pathways related to endothelial cell proliferation, cell-cell adhesion, viral entry into host cell, glycosaminoglycan metabolic process, kinase B signaling, and T cell proliferation and activation (Fig. 2B and Table S2).
MGAT5 regulates the surface expression of PD-L1
Among the multiple pathways regulated by MGAT5, we found that T cell proliferation and activation were particularly noteworthy. Proteins enlisted in this pathway include CD274 (PD-L1), CD70, EBI3, GPNMB, SLC7A1, TFRC, and TMEM131L (Table S2). PD-L1 plays a crucial role in current immunotherapy. A previous study showed that ablation of MGAT5 enhances CAR T cell activity and leads to improved killing [28]. Disrupted N-glycosylation destabilizes PD-L1 and enhances the efficacy of PD-1 blockade in syngeneic mouse models of triple-negative breast cancer (TNBC) and colon cancer [26]. We further evaluated whether MGAT5 regulated N-glycan branching of PD-L1 in different cell lines. PHA-L pull-down assay showed that MGAT5 knockout and knockdown significantly decreased the binding of PHA-L to PD-L1 in SAS and OEC-M1 cells, respectively (Fig. 3A, left and middle). In contrast, overexpression of MGAT5 in OEC-M1 cells increased this binding (Fig. 3A, right). While Western blot analysis showed that MGAT5 knockout, knockdown, or overexpression did not significantly alter PD-L1 protein levels. To further confirm the presence of β1,6-branched N-glycans on PD-L1, we checked the binding of PHA-L to immunoprecipitated PD-L1. Results showed decreased β1,6-branched N-glycans on PD-L1 in MGAT5 knockout cells (Fig. S3A). We were curious whether MGAT5-mediated glycosylation affected the surface expression of PD-L1. Flow cytometry showed decreased surface PD-L1 expression in MGAT5 knockout SAS cells compared to Mock cells (Fig. 3B). To assess receptor binding, we performed a ligand-binding affinity assay between PD-1 Fc and PD-L1. Our results showed a trend where the binding affinity of PD-L1 to PD-1 was lower in MGAT5 knockout cells than in Mock cells, although this difference did not reach statistical significance (Fig. S3B). These results suggest that MGAT5 regulates β1,6-branched N-glycans on PD-L1, and knockout of MGAT5 decreases the surface expression of PD-L1.
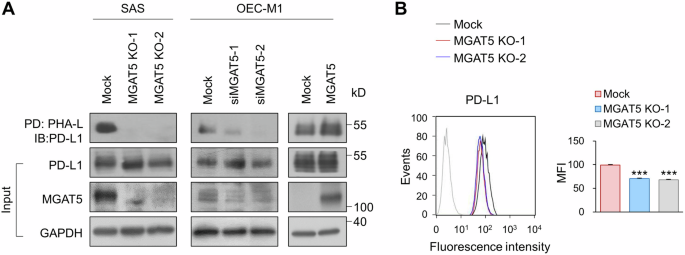
A Lectin pull-down assay. The level of branched N-glycans on PD-L1 was assessed using PHA-L pull-down assay. Mock or two independent clones of MGAT5 knockout (MGAT5 KO-1 and MGAT5 KO-2) SAS cells were used. To knock down MGAT5, OCE-M1 cells were transfected with non-targeting siRNA or siRNA against MGAT5 (siMGAT5-1 or siMGAT5-2). To overexpress MGAT5, OEC-M1 cells were transfected with an empty vector (Mock) or MGAT5/pcDNA3.1. Cell lysates (500 μg) were incubated with PHA-L conjugated agarose beads overnight and the proteins captured by PHA-L were analyzed using Western blot analysis. PD, pull-down. IB, immunoblot. Input PD-L1, MGAT5 and GAPDH in the cell lysates were shown in the lower panel. Data are representative of three independent experiments. B Flow cytometry of PD-L1. Effect of MGAT5 on the surface expression of PD-L1. Cells (1 × 10⁶) were stained with an anti-PD-L1 antibody (#329701, BioLegend) on ice for 30 min. After washing, cells were incubated with an Alexa Fluor 488-conjugated goat anti-mouse IgG for another 30 min. Fluorescence was detected by a flow cytometer. Left, histograms of fluorescence intensity of PD-L1 in Mock and MGAT5 knockout (KO) cells. Right, mean fluorescence intensity (MFI) of Mock and MGAT5 KO cells. Data are presented as mean ± SD. ***P < 0.001, analyzed using two-tailed Student’s t-test. Data are representative of three independent experiments.
MGAT5 protects HNSCC cells from CTL-induced apoptosis through engagement of the PD-1/PD-L1 pathway
Glycosylation fine-tunes the function of the receptor. We hypothesized that MGAT5 may regulate PD-L1-mediated resistance to T cell cytotoxicity in HNSCC. CTLs assays were performed using a Caspase 3/7 cleavable florescent dye (Fig. 4A). The results showed increased CTL-induced apoptosis in MGAT5 knockout SAS cells compared with Mock cells (Fig. 4B). In addition, MGAT5 knockdown or overexpression also respectively increased or suppressed CTL-induced apoptosis in OEC-M1 cells (Fig. S4A). The protective effects of MGAT5 on SAS (Fig. 4B) and OEC-M1 (Fig. S4B) cells could be counteracted by treatment with nivolumab. Together, our results suggest that MGAT5 protects HNSCC cells from CTL-induced apoptosis through engagement of the PD-1/PD-L1 pathway.
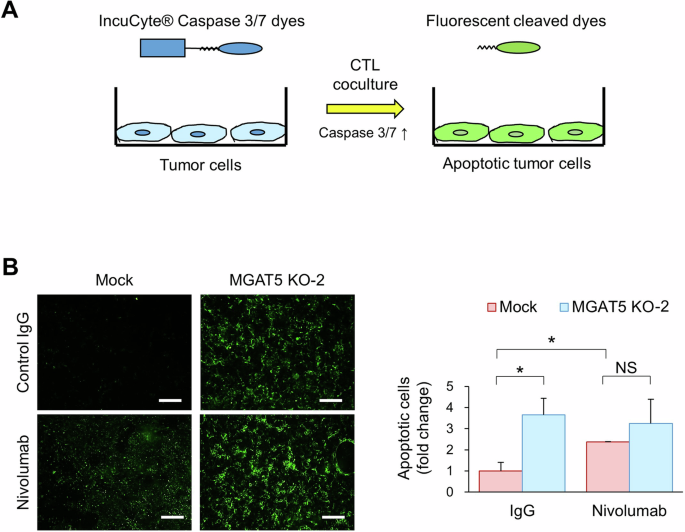
A Schematic diagram of CTL assays. Jurkat cells were activated with 100 ng/mL PMA and 5 µg/mL PHA-L for 24 h. The IncuCyte® Caspase 3/7 dyes were added to the culture medium 24 h before tumor cells were cocultured with activated Jurkat cells. The IncuCyte® dyes are designed to become fluorescent upon cleavage by active Caspase 3/7 in apoptotic cells. B Immunofluorescence microscopy. Mock or MGAT5 knockout (MGAT5 KO-2) cells were cocultured with activated Jurkat cells for 6 h. The effector-to-target ratio was 1:5. The fluorescent signal was detected via fluorescence microscopy and quantified using the ImageJ software. Left, representative images of apoptotic SAS cells incubated with activated Jurkat cells and with control IgG or nivolumab (20 ug/ml). Scale bars, 50 μm. Right, quantitative results of immunofluorescent apoptotic cells. Data are presented as mean ± SD. *P < 0.05, analyzed using two-tailed Student’s t-test. NS not significant. Data are representative of three independent experiments.
MGAT5 expression correlates to good responses to immunotherapy
We showed that MGAT5 protects HNSCC cells from CTL-induced apoptosis in vitro. Next, we evaluated whether MGAT5 expression in tumors correlated to treatment responses of anti-PD-1 therapy in patients with HNSCC. MGAT5 and PD-L1 expression were analyzed in tumors from HNSCC patients who received anti-PD-1 therapies (n = 40). Representative images of MGAT5 expression were shown in Fig. 5A. Patient characteristics were shown in Table S3. Patients were grouped according to the MGAT5 expression or tumor proportion score (TPS). Fisher’s exact tests revealed that positive MGAT5 expression significantly correlated with good treatment response (P = 0.024, Fig. 5B, left). The positive and negative predictive values were 64.7% and 73.9%, respectively. TPS ≥ 1% also significantly correlated with good treatment response (P = 0.013, Fig. 5B, right), and the positive and negative predictive values were 53.1% and 100%, respectively. Combining these two parameters together, patients with positive MGAT5 expression and TPS ≥ 1% had a significantly higher likelihood to respond to anti-PD-1 therapy (P = 0.003, Fig. S5A), and the positive and negative predictive values achieved 73.3% and 76.0%, respectively. As shown by the Venn diagrams (Fig. S5B), the overlap between MGAT5-positive and TPS ≥ 1% was 15 patients, and only 4 out of these 15 patients did not respond to anti-PD-1 therapy. Patients with MGAT5-positive or TPS ≥ 1% had significantly better progression-free survival and overall survival after anti-PD-1 therapy than patients with MGAT5-negative tumors or TPS < 1%, respectively (Fig. 5C).
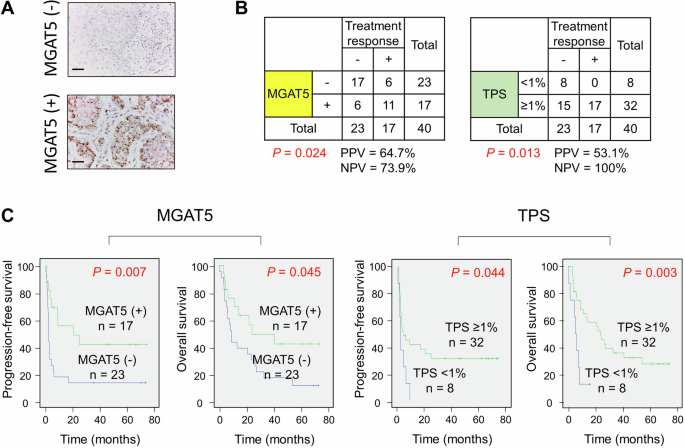
A Representative IHC images of MGAT5 expression in HNSCC tumors. Scale bars, 50 μm. B Fisher’s exact tests analyzing correlation of MGAT5 expression or tumor proportion score (TPS) with treatment responses (n = 40). Treatment response was evaluated based on response evaluation criteria in solid tumors (RECIST) criteria. Stable disease, partial response, and complete remission were considered good treatment responses. PPV positive predictive value. NPV negative predictive value. C Kaplan–Meier analysis for progression-free survival and overall survival of patients treated with anti-PD-1 antibodies (n = 40). Patients were divided according to their MGAT5 expression or TPS status.
Potential β1,6-branched N-glycans at N35 and N200 of PD-L1
Our glycoproteomic analysis identified the existence of complex N-glycans on PD-L1 (Table S1). Previous research reports N-glycosylation sites on PD-L1 at N35, N192, N200, and N219, with the branched glycan heterogeneously distributed [34]. To gain a more detailed insight into the site-specific N-glycosylation of PD-L1 in HNSCC tumor cells, we purified PD-L1 from SAS cells and analyzed the N-glycan structures using MS. The results showed that the majority of complex N-glycans were located at N200, followed by N35 (Fig. 6A). Of note, complex N-glycans were the predominant structures at N35 and N200 of PD-L1, representing 59.8% and 60.3% of the glycoforms at these specific sites, respectively (Fig. 6B, upper panel). The glycoforms of complex N-glycans at each site were shown in the lower panel of Fig. 6B. Upon manual inspection, those complex N-glycans could contain polyLacNAc, tri-, or tetra- antennary structures, with the latter two being the potential MGAT5 substrates. Mutations at both N35 and N200 obliterated β1,6-branched N-glycans on PD-L1 (Fig. 6C). These results suggest that MGAT5 potentially regulates N-glycosylation at N35 and N200 of PD-L1.
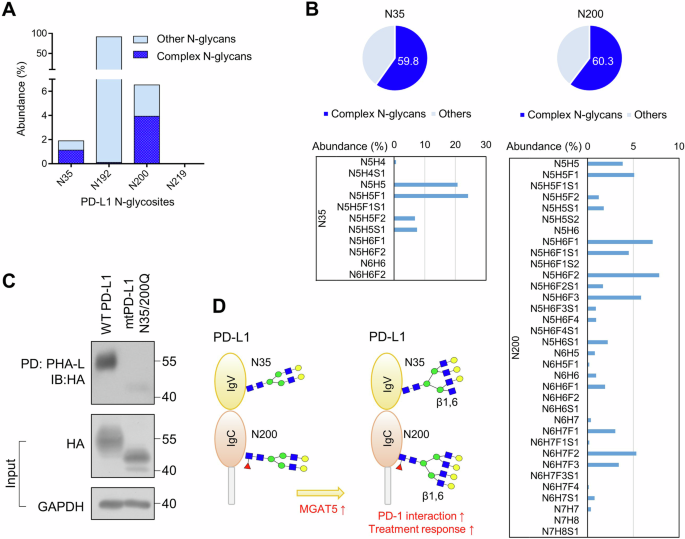
A Abundance (% to total) of glycopeptides with complex N-glycans and other N-glycopeptides at N35, N192, N200, and N219 of PD-L1. B Abundance and structure of glycopeptides with complex N-glycans at N35 and N200 of PD-L1. The abundance (% to glycans at the indicated site) of glycopeptides with complex N-glycans was demonstrated in the upper panel. High confident glycopeptides with complex N-glycans at N35 and N200 of PD-L1 with PEP2D < 0.01 were demonstrated in the lower panel. N, HexNAc; H, Hex; F, Fucose; S, Sialic acid. Of note, LC-MS/MS analysis cannot differentiate two types of tri-antennary structures, namely 2,2’,6’-triantenna and 2,4,2’-triantenna, with the former being products of MGAT5. C PHA-L pull-down assay. PD-L1 knockout SAS cells were transfected with wild-type (WT) or mutant (mt)N35/200Q PD-L1. Cell lysates (500 μg) were incubated with PHA-L conjugated agarose beads overnight, and the proteins captured by PHA-L were analyzed using Western blot analysis. PD, pull-down. IB, immunoblot. Input PD-L1-HA and GAPDH in the cell lysates were shown in the lower panel. D MGAT5 specifically contributes to formation of the β1,6-branched N-glycan at N35 and N200 of PD-L1. These site-specific branched N-glycans enhance the ability of PD-L1 to inhibit CTL activity. Thereafter, tumors with MGAT5 expression, which indicates the presence of the branched N-glycan at N35 and N200, shows better response to the anti-PD-1 therapy than those without MGAT5 expression.
Discussion
In this study, we demonstrate that MGAT5 and its glycan products are elevated in HNSCC tumors compared to adjacent non-tumor tissues. With the assistance of MS-based glycoproteomic approach, we are able to systemically identify the protein substrates of MGAT5. Among the cellular pathways that are regulated by MGAT5, we focus on T cell proliferation and activation due to its importance in immunotherapy. We show that MGAT5 regulates the formation of β1,6-branched N-glycans on PD-L1 in different HNSCC cell lines. The surface expression of PD-L1 is decreased in MGAT5 knockout cells. MGAT5 protects cancer cells from CTL-mediated apoptosis, and nivolumab treatment alleviates the protective effect of MGAT5. Consistently, IHC of clinical samples also show that patients with MGAT5-positive tumors exhibit better responses to anti-PD-1 therapy than those with MGAT5-negative tumors. We further use MS to analyze site-specific N-glycosylation on purified PD-L1 from HNSCC cells, revealing that the N35 and N200 sites on PD-L1 carry potential β1,6-branched N-glycans. In summary, we show that MGAT5 controls the function of PD-L1 by regulating the formation of branched N-glycans. The presence of β1,6-branched N-glycans on PD-L1 not only enhances its interaction with PD-1 but also augments its capacity to inhibit CTL activity (Fig. 6D).
Expression of β1,6-branched N-glycans, which can be detected by PHA-L staining, is one of the most common alterations observed in human cancers [35] and is associated with increased metastasis and poor prognosis [15, 36, 37]. The PHA-L binds specifically to mature MGAT5-modified N-glycans [38]. Interestingly, Mgat5-deficiency reduces progression and metastasis of breast cancers induced in PyMT mice [39]. Mgat5-deficient mice shows late-onset spontaneous autoimmune disease through enhanced TCR signaling and T cell activation [40], and through weakened polarization of Th2 cells [41]. Impairing the β1,6 N-glycan branching by MGAT5 knockout improves activation of CAR T cells and reduces burdens of pancreatic tumors [28]. Currently, the identified MGAT5 substrates include EGFR, TGFR, integrin, E-cadherin, and N-cadherin [17,18,19,20,21,22]. Whether PD-L1 glycosylation is controlled by MGAT5 remains unexplored. Using the state-of-the-art glycoproteomic approach, we show that PD-L1 is one of the proteins substrates of MGAT5. We also demonstrate that MGAT5-mediated glycosylation of PD-L1 is crucial for PD-1-mediated T cell inactivation. Our study further explains the immunosuppressive role of MGAT5 that was observed decades ago [40, 41]. We also emphasize that changes in N-glycan branching at specific sites of PD-L1 can result in distinct effects on T cell activation.
Interestingly, although the structural interaction of PD-L1 and PD-1 has been extensively studied [42], it was not acknowledged until recently that the glycosylation of PD-L1 was important for its interaction with PD-1 [26, 27]. Moreover, it has been reported that N-glycan structures and occupancies on PD-L1 are very heterogeneous among cell types [34]. It has been shown that β-1,3-N-acetylglucosaminyltransferase (B3GNT3)-mediated glycosylation of PD-L1 is critical for PD-L1 to suppress cytotoxic T cells activity [27]. The structures related to B3GNT3 and MGAT5 are different. B3GNT3 is responsible for the formation of poly-N-acetyllactosamine (polyLacNAc) structures on bi-antennary or branched N-glycans, whereas MGAT5 operates specifically on the β1,6-branching of tri- or tetra-antennary N-glycans. We are the first to decipher the occupancy and structure of β1,6-branched N-glycans on PD-L1 in HNSCC cells. By recognizing the critical role of branched N-glycans at the N35 and N200 sites in regulating PD-L1 interaction with PD-1, we have laid the foundation for future development of diagnostic or therapeutic biomarkers.
Our in vitro results showed that MGAT5 protects cancer cells from CTL-mediated apoptosis. The clinical data also showed that patients with MGAT5-positive tumors respond better to anti-PD-1 therapy than those with MGAT5-negative tumors, indicating that MGAT5 plays a protective role in those tumors through engagement of the PD-1/PD-L1 pathway. In clinical settings, we may assume that the blockade of PD-1 through antibody treatment relieves CTLs from this MGAT5-mediated inhibition, leading to effective tumor cell killing and subsequent tumor shrinkage in patients. Our findings also partly explain the mystery of why still around 70% of patients do not respond to anti-PD-1 therapy despite having high PD-L1 expression in their tumors [43]. It is not merely the quantity but rather the quality of PD-L1 that matters in terms of its ability to inhibit CTLs.
The association of MGAT5 with cancer development was discovered four decades ago using PHA-L lectin histochemistry [15, 16, 36]. However, most of the commercially available anti-MGAT5 antibodies are only suitable for Western blot analysis but not for paraffin-IHC. After reviewing literatures, we found that a convincing MGAT5 IHC result was obtained using an in-house mouse monoclonal antibody [37]. Therefore, we generated polyclonal anti-MGAT5 antibodies that can be used for IHC analysis. By using this antibody, detection of MGAT5 can be easily incorporated into current IHC systems. Given that PD-L1 expressing tumors do not always respond to anti-PD-1 therapy [44], we propose that searching for immunotherapy biomarkers should focus on the functional difference of PD-L1 between responders and non-responders.
Although it has been known that the function of PD-L1 in cancer cells is regulated by its N-glycosylation, the role of site-specific N-glycosylation remains unclear. We are the first to identify N35 and N200 as critical sites potentially regulating the PD-L1/PD-1 interaction. There are limitations to this study. Currently, the amount of purified PD-L1 only allows us to perform LC-MS/MS for glycoform analysis. The Byonic engine search for glycopeptides with an FDR < 1%, combined with expert manual examination, has proven to be accurate [45]. However, the specific β1,6-branch cannot be distinguished by LC-MS/MS and can only be supported by PHA-L binding. Nonetheless, we emphasize that this is one of the few papers making efforts to decipher the site-specific glycosylation of PD-L1. With growing evidence indicating that branched N-glycans impact the efficacy of immunotherapies, this research is particularly significant [46].
In conclusion, our results support the critical role of β1,6-branched N-glycans on PD-L1 in its interaction with PD-1. Using MGAT5 expression as a marker, we predicted immunotherapy responses with a positive and negative predictive value of 64.7% and 73.9%, respectively. Future development of anti-PD-L1 antibodies targeting the branched N-glycans at N35 and N200 on PD-L1 could be an attractive strategy for developing diagnostic or therapeutic agents.
Responses