The Breast Cancer Classifier refines molecular breast cancer classification to delineate the HER2-low subtype
Introduction
The evolution of the molecular classification of breast cancer witnessed a paradigm shift with the introduction of the PAM50 classifier, a pioneering assay that emerged from the seminal work by Perou et al.1. This study revealed the possibility of segregating breast cancers into intrinsic subtypes through hierarchical clustering of gene expression. Based on the expression profiles of certain genes, the PAM50 molecular breast classification led to the identification of five subtypes: Luminal A (LumA), Luminal B (LumB), HER2-enriched, Basal, and Normal-like2,3,4,5,6,7. These subtypes have demonstrated prognostic significance across varying patient cohorts, both untreated and treated, thus showcasing their potential in risk stratification8,9,10,11. The Prosigna test emerged as a consequential extension of this classification, aiding in clinical management and identification of intrinsic subtypes indicative of recurrence tendencies12,13. However, despite its clinical assimilation, glaring limitations in molecular breast cancer expression profile classification still remain, including low concordance between subtypes, a blurred border between Luminal and Normal-like subtypes, and heterogeneity of the HER2-enriched and Basal subtypes14,15,16. These deficiencies are especially apparent in the identification of HER2-low breast cancers17,18, consequently hindering the progress in treatment options for this aggressive cancer.
Recent publications have also delineated the need for more nuanced classifications16,19,20,21,22. In a transformative approach to breast cancer classification, Mathews et al. introduced a reclassification of breast tumors into seven distinct classes using interpretable mRNA signatures within the PAM50 gene set14. This evolution in understanding breast cancer subtypes is further enriched by studies focusing on the claudin-low subtype23,24,25. These studies described the claudin-low subtype of triple-negative breast cancer (TNBC) as distinct in gene expression patterns related to cell adhesion and epithelial-to-mesenchymal transition, indicating its potential divergence in origin and evolution when compared to other breast cancer subtypes.
Considerable work has gone into classifying TNBC26. The Burstein classification system divides TNBC into four distinct subtypes: basal-like immunosuppressed (BLIS), basal-like immune-activated (BLIA), luminal androgen receptor (LAR), and mesenchymal (MES)27. This system revealed the LAR and MES subtypes to be predominantly found in non-Basal tumors of TNBC. Furthermore, certain TNBC subtypes have characteristics similar to non-TNBC tumors but display different clinical features28,29,30.
The HER2-E (HER2-enriched) intrinsic subtype, characterized by higher expression of ERBB2 and proliferation-related genes, shows the best response to anti-HER2 therapies both in adjuvant and neoadjuvant settings31,32, irrespective of the clinical status of HER2. However, only about 50% of clinically HER2-positive (3+ based on immunohistochemistry (IHC)) tumors are HER2-E; intriguingly, this molecular subtype also appears in clinically HER2-negative breast cancer based on IHC, which currently does not receive HER2-targeted treatments33,34.
Recent studies comparing the efficacy of different assays in determining HER2 status have shed light on a distinct subtype known as HER2-low35,36,37, defined by IHC staining as 1+ or 2+ without amplification. The molecular characteristics and prognostic analyses associated with IHC HER2-low breast cancer were also analyzed to uncover different clinical behaviors and responses to treatment, highlighting the absence of distinct prognostic and biological correlates17,18,38. Emerging evidence from clinical trials showcasing significant clinical benefits associated with the use of novel HER2-directed antibody-drug conjugates (ADCs) in advanced HER2-low breast cancers challenges the binary categorization of HER2 status in breast cancers17,39,40. The recent FDA approval of the first treatment targeting HER2 in HER2-low breast cancer indicates the clinical recognition and treatment advancements for this new subtype41.
Motivated by these observations, we wanted to determine how we can use RNA-seq and machine learning to enhance breast cancer subtype classification, specifically in identifying and characterizing the HER2-low subtype, in comparison to traditional IHC methods and PAM50. To address the urgent, yet unmet, need of defining HER2-low breast cancers in the clinical setting, we leveraged advanced, platform-independent machine-learning algorithms to construct an improved rank-based classifier called Breast Cancer Classifier (BCC) based on the expression levels of 63 genes for intrinsic subtyping of either single breast cancer samples or unbalanced cohorts. Utilizing advanced clustering techniques and machine-learning algorithms, we performed a comparative assessment of the prognostic aptitudes between the traditional PAM50 intrinsic subtypes and our newly defined BCC subtypes that include HER2-low and HER2-high. Like PAM50, BCC uses gene expression to venture beyond conventional IHC for breast cancer subtyping. The unique feature of the BCC that distinguishes it from PAM50 is the unveiling of the HER2-low subtype as a distinct biological entity. Specifically, our findings revealed that the HER2-enriched classification does not exclusively reflect ERBB2 amplification. Moreover, IHC 1+ and 2+ without ERBB2 amplification as defined by any in situ hybridization (ISH) method currently used to characterize the HER2-low subtype for equivocal cases42 fall short in encapsulating the biological complexity of the HER2-low subtype. We show that, unlike its depiction by IHC, the molecularly defined HER2-low subtype is a unique biological subtype, thus enriching our understanding of the HER2 status in the molecular taxonomy of breast cancer. Validated within independent gene expression cohorts, our findings herald a potential enhancement in the molecular classification of breast cancer.
Results
The identification of five breast cancer subtypes using a semi-supervised method
Combining clusterization and gene signature score calculation according to the ssGSEA algorithm on a comprehensive dataset of 6223 breast tumor samples from the METABRIC, TCGA, and SCAN-B cohorts, a semi-supervised molecular Breast Cancer Classifier (BCC) was developed (Fig. 1a, b). The preliminary hierarchical clustering analysis using the classic PAM50 gene subset identified the Basal, HER2-enriched, and Luminal clusters. At this step, we noted a group of samples that clustered together with the HER2-enriched subtype but did not show high levels of ERBB2 expression (Fig. 1c), in agreement with a published report that not all HER2-enriched samples have high ERBB2 expression43. Then, we performed differential expression analysis between preliminary groups and defined a set of genes that distinguished the group from other ERBB2-high samples (Supplementary Table 1). Next, Uniform Manifold Approximation and Projections (UMAPs) with different gene sets were utilized (Supplementary Table 1) to iteratively assign samples to groups (Fig. 1a, b). To do this, we first defined the Basal subtype characterized by the highest expression of FOXC1 and the lowest expression of FOXP1 compared to all other samples (Supplementary Fig. 1a, b). In the second iteration, we split the ERBB2-high samples from other samples based on the expression of a subset of proliferative genes (Supplementary Table 1) and the expression of ERBB2 (Supplementary Fig. 1c). This subtype was named HER2-high. Finally, samples were reclustered based on the same subset of genes as in the previous step with the inclusion of additional transcription factor genes (ACE2, FABP7, AKR1B15, and GATA3). This projection uncovered a small subset of samples that were classified as HER2-low (Supplementary Fig. 1d-h). Also, this HER2-low subset could be separated as a cluster on the UMAP for all samples (Supplementary Fig. 1i). Interestingly, HER2-low samples exhibited similar expression patterns for proliferative, keratin, and luminal genes as HER2-high samples (Fig. 1c). The rest of the samples were classified as Luminal and subjected to further differentiation into subtypes LumA and LumB using a logistic regression classifier trained on the SCAN-B luminal samples and gene sets of proliferative and anti-proliferative genes (Methods).
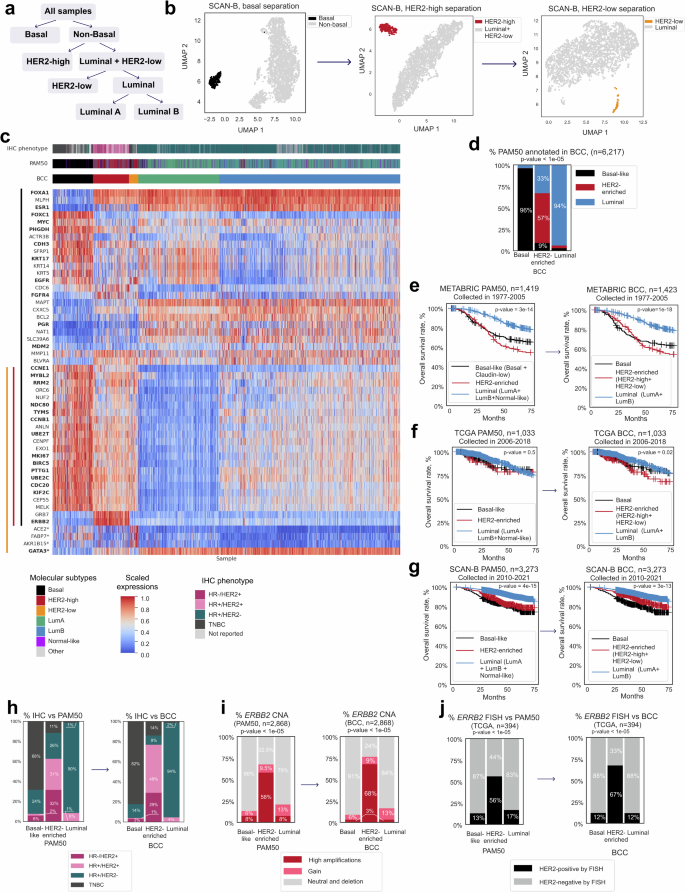
a Schematic of sample separation into five subtypes. b Sample reannotation of the SCAN-B dataset (n = 3273) using density-based clustering on UMAP. c Heatmap of expression levels of PAM50 genes and four additional genes (marked with *) used for BCC annotation (total n = 6263 from TCGA, SCAN-B, and METABRIC). d Comparison of three high-level subtypes annotated by BCC and PAM50 classification. p-values for the Pearson’s chi-squared test are shown. e Kaplan–Meier survival curves for the PAM50 and BCC samples from the METABRIC cohort (only for high-level subtypes). p-value for the logrank test is shown. f Kaplan–Meier survival curves for the PAM50 and BCC samples from the TCGA cohort (only for high-level subtypes). p-value for the logrank test is shown. g Kaplan–Meier survival curves for the PAM50 and BCC samples from the SCAN-B cohort (only for high-level subtypes). p-value for the logrank test is shown. h Distribution of IHC phenotypes across PAM50 and BCC subtypes. p-values for the Pearson’s chi-squared test are shown. i Proportion of ERBB2-amplified samples in the main subtypes in reported annotation and BCC. p-values for the Pearson’s chi-squared test are shown. j Proportion of ERBB2 ISH-positive and negative samples in the main subtypes in reported annotation and BCC. p-values for the Pearson’s chi-squared test are shown.
Benchmarking BCC against PAM50
The BCC was applied to a total of 6223 samples with clinical annotation from TCGA7, SCAN-B44, and METABRIC45 datasets. Samples annotated as “Other” were excluded from the comparison. The rest were divided into the following molecular subtypes: Basal (723 samples, 12%), HER2-enriched, and Luminal. The HER2-enriched subtype encompassed HER2-low (167 samples, 3%) and HER2-high (647 samples, 10%) groups, while Luminal included LumA (1449 samples, 23%) and LumB (3237 samples, 52%) groups. Our analysis showed BCC classification to largely coincide with established PAM50 subtyping14,46,47. We compared BCC and PAM50 classifications of three high-level classes: Basal, HER2-enriched, and Luminal (comprising LumA, LumB, and Normal-like groups). Notably, according to the BCC, 96% of Basal samples corresponded to the Basal-like subtype in PAM507. For the HER2-enriched and Luminal subtypes, a concordance of 56% and 94% was observed, respectively. Samples from the BCC HER2-enriched subtype included not only almost all PAM50 HER2-enriched cases, but also several of Basal (9%) and Luminal cases (33%) (Fig. 1d). Overall, our BCC classification concurred with PAM50 subtyping for 85% of the samples analyzed.
The historical data on survival rates for the aforementioned samples was examined after applying our classification. Here, we did not detect any significant differences in survival between BCC- and PAM50-classified samples for both conventional treatment groups from the METABRIC (Fig. 1e) and TCGA (Fig. 1f) cohorts, and those receiving contemporary treatment within the SCAN-B cohort (Fig. 1g).
Five-year survival rates were similar for all the classes with one exception in TCGA cohort, where the HER2-enriched subtype defined by the BCC had a worse five-year survival rate (79% PAM50 vs. 71% BCC, Table 1).
Compared to the PAM50 HER2-enriched subtype, the BCC HER2-enriched subtype showed better concordance with HER2 expression as determined by IHC. Among samples in the PAM50 HER2-enriched group, 63% were considered HER2-positive by IHC, versus 77% of the samples in the BCC HER2-enriched group (Fig. 1h, Supplementary Fig. 1j; detailed breakdown of IHC annotation among BCC subtypes is provided in Supplementary Table 2). The proportion of cases with ERBB2 amplification was also higher in the BCC HER2-enriched group (68% vs. 58% in PAM50, Fig. 1i). Accordingly, the proportion of cases with amplified HER2 as determined by ISH in the BCC HER2-enriched group was higher (67%) than in the PAM50 HER2-enriched (56%) subtypes (Fig. 1j).
The BCC revealed luminal features in PAM50 Normal-like tumors
The PAM50 Normal-like subtype was originally defined by including normal breast tissue samples alongside tumor samples during the molecular profiling process48. This subtype was shown to be the least stable, especially upon removal of the keratinocyte gene set16. This suggests the presence of non-cancerous breast tissue with mesenchymal properties, and that a high prevalence of keratinocytes (like in the Basal subtype) played a role in the definition of this subtype49. Pathologic assessment of PAM50 Normal-like histological slides from TCGA revealed a high amount of adipose tissue (Fig. 2a) and DCIS (Ductal Carcinoma In Situ) component, occupying from 10% to 50% of tumor area per visual assessment. WES analysis showed the mean tumor content in Normal-like samples to exceed 20%, similar to LumA and LumB tumors (Fig. 2b). Moreover, we did not detect any differences in the expression of cytokeratins and all mesenchymal markers between Normal-like and LumA samples (Supplementary Fig. 2a).
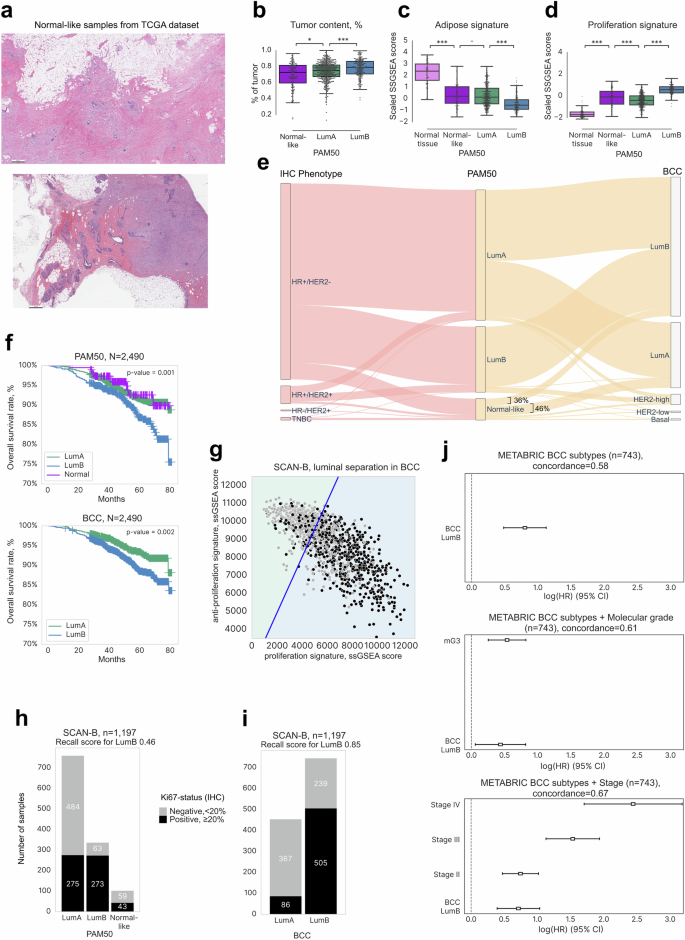
a Representative histological sections (H&E-stained) of samples annotated as PAM50 Normal-like, with adipose tissue and DCIS component present. Scale bar—500 μm. b Mean tumor content across reported PAM50 subtypes in TCGA (n = 1048) determined by WES. The color key included is used for (b), (c), and (d). ***: p value < 0.001, **: p value < 0.01, *: p value < 0.05, -: p value < 0.1. c Gene expression levels in the adipose signature (in scaled SSGSEA scores) across reported PAM50 subtypes and normal tissue. d Gene expression levels in the proliferation signature across reported PAM50 subtypes and normal tissue. e Sankey plot depicting the distribution of PAM50 Normal-like samples between BCC LumA and LumB subtypes and among the IHC-defined phenotypes. f Kaplan–Meier survival curves for the PAM50 and BCC LumA/LumB subtypes. g Delineation of the SCAN-B Luminal subtype into LumA and LumB with the BCC using proliferative and anti-proliferative signatures as explanatory variables. The blue line reflects the proposed threshold of signature scores between LumA and LumB. h Barplots showing the distribution of KI67-positive samples between PAM50 LumA/LumB subtypes. i Barplots showing the distribution of KI67-positive samples across BCC LumA/LumB subtypes. j Cox proportional hazard regression analysis showing the change of survival rates across the BCC LumB/LumA subtypes in the METABRIC cohort (top) depending on additional variables: stage (middle) and molecular grade (bottom). HR Hazard ratio; CI confidence interval.
A normal breast primarily comprises fibro glandular and adipose tissues50. While we found the adipose gene signature level in PAM50 Normal-like samples to be significantly lower than in cancer-free samples (Fig. 2c), we did not detect any differences in this signature between the PAM50 Normal-like and LumA subtypes. Moreover, the proliferation and keratin signatures in the Normal-like subtype demonstrated significantly higher scores compared to normal tissue, indicative of resemblance to the LumA subtype (Fig. 2d, Supplementary Fig. 2a). Moreover, the Normal-like molecular subtype showed heterogeneity across IHC subtypes, consisting of 76% of hormone receptor-positive (HR+), 10% of TNBC, and 14% of HER2-positive samples (Fig. 2e). We also did not find significant survival rate differences between the PAM50 Normal-like and PAM50 LumA groups (five-year OS 92% and 93%, respectively, Fig. 2f). Thus, our results dispute the recognition of the Normal-like subtype as a separate group. Rather, analysis by the BCC revealed PAM50 Normal-like samples to display characteristics indicative of the Luminal subtypes.
Clinically oriented BCC definition of the LumA and LumB subtypes could better distinguish prognostic associations than PAM50
Clinically, LumA and LumB subtypes are currently distinguished by the levels of KI67, a protein that indicates high growth rates within the tumor51. Based on the standard threshold, we defined samples with KI67 ≤ 20% as the LumA subtype and those with KI67 > 20% as LumB. The SCAN-B dataset was separated into train and test sets to train and test the logistic regression classifier. The F1 score for the proposed classifier for the test cohort was 0.76 (Fig. 2g, S2b). The resulting classifier was used to predict KI67-high Luminal samples in other cohorts. Prediction quality was validated on the GSE21653 dataset (n = 124), with an F1 score of 0.78 (Supplementary Fig. 2c). We demonstrated the disease-free survival prognosis for samples from the GSE21653 dataset with survival data and annotated as Luminal (n = 122) to be similar to the original annotation by KI67 status (Supplementary Fig. 2d).
In all cohorts, both the BCC Luminal subtypes predominantly included the HR+/HER2− phenotype as determined by IHC, accounting for 95% and 93% of samples, respectively (Supplementary Fig. 1j, left plot), versus 88% and 76% based on the PAM50 classification (Supplementary Fig. 1j, right plot). This difference was mostly attributed to lower percentages of HER2+/HR+− cases in the BCC Luminal groups (2% and 5% in LumA and LumB, respectively), in contrast to 6% and 12% in the PAM50 LumA and B groups. Samples annotated as Normal-like by PAM50 were distributed mostly between LumA and LumB samples by the BCC: 46% and 36%, respectively (Fig. 2e).
Applying our trained classifier to the SCAN-B cohort (n = 1197), we observed a higher percentage of KI67+ samples in the BCC LumB cluster compared to the PAM50 LumB cluster. Notably, the recall score for LumB, critical for identifying patients with more aggressive subtypes, significantly improved from 0.46 with PAM50 to 0.85 with the BCC (Fig. 2h, i). Moreover, we also found a notable difference between the survival rate for the BCC LumA and LumB subtypes (five-year OS of 93% and 89%, respectively, Fig. 2f).
To confirm the correlation of survival prognosis with subtyping, we applied Cox regression analysis on the METABRIC cohort (n = 743). The BCC LumA subtype was associated with better survival compared to LumB (Hazard Ratio (HR) = 0.80) even after controlling for tumor stage (HR = 0.71, Fig. 2j). As expected, adding molecular grade52 as a feature decreased the HR to 0.44, indicating a partial correlation between the LumB subtype and molecular grade. The correlation was also supported by a higher proliferation rate in LumB (Fig. 2j), which is consistent with published literature53.
The BCC HER2-low subtype is similar to TNBC-LAR and does not represent a specific histological subtype
We analyzed samples from METABRIC, TCGA, and SCAN-B cohorts to characterize the previously unreported HER2-low subtype and to capture its key distinctions from the HER2-high and other subtypes. First, we noticed that only 6% of the BCC HER2-low samples were HER2-positive by IHC (IHC status was available for n = 5602). Notably, 92% of the BCC HER2-high samples showed HER2 positivity, compared to only 63% of samples classified as the PAM50 HER2-E subtype (Figs. 3a, 1h). Moreover, the BCC HER2-high subtype showed 97% concordance with ERBB2 amplification as assessed by ISH (Fig. 3b), versus 56% in PAM50 HER2-E (Fig. 1j). ISH status was available for samples from the TCGA dataset (n = 394). Consonantly, 81% of samples from the BCC HER2-high subtype showed high amplifications in ERBB2 (Fig. 3c), compared to 58% in PAM50 HER2-E (Fig. 1i) from both the TCGA and METABRIC cohorts (n = 2906). In contrast, only 6% of the BC HER2-low samples had HER2 amplifications as assessed by ISH (Fig. 3b). Moreover, CNA in ERBB2 was revealed in only 10% of the BCC HER2-low samples (Fig. 3c), versus 90% of samples of the BCC HER2-high group. Furthermore, ERBB2 expression was lower in HER2-low than in HER2-high samples (Fig. 3d).
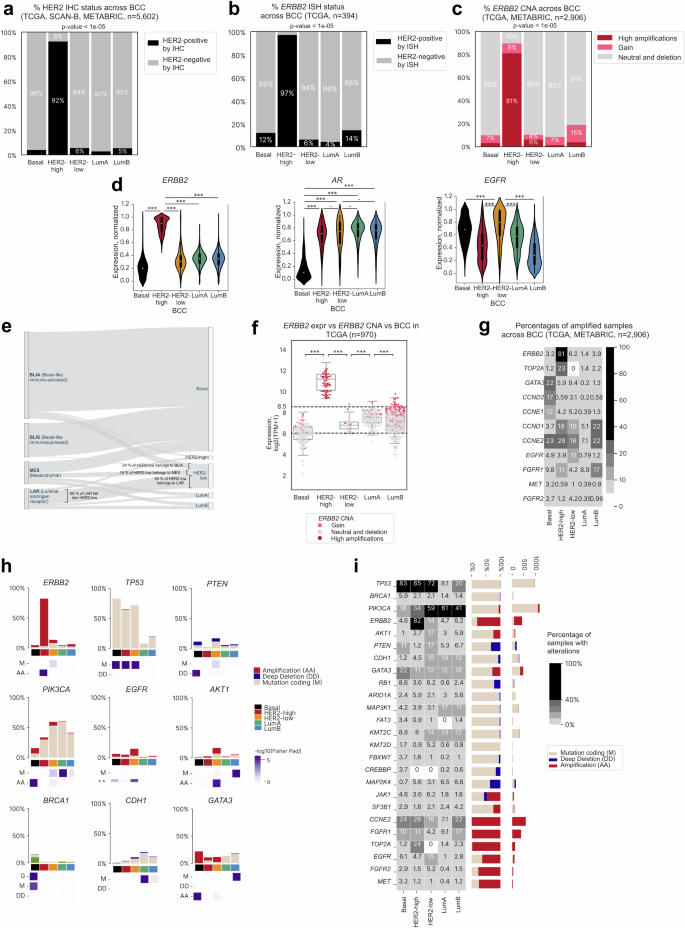
a Barplot showing proportions (in %) of HER2-positive and negative samples as assessed by IHC across the BCC subtypes in TCGA, SCAN-B, and METABRIC cohorts (total n = 5602). p-values for the Pearson’s chi-squared test are shown. b Barplot showing proportions (in %) of HER2-positive and negative samples as assessed by ISH across BCC subtypes in TCGA (n = 394). p-values for the Pearson’s chi-squared test are shown. c Barplot showing proportions (in % of copy number alterations, CNAs) of ERBB2-amplified samples across BCC subtypes in TCGA. p-values for the Pearson’s chi-squared test are shown. d Violin plot showing expression levels of ERBB2, AR, and EGFR (in scaled units) across BCC subtypes (METABRIC, TCGA, and SCAN-B datasets, total n = 6223). ***: p-value < 0.001, **: p-value < 0.01, *: p-value < 0.05, -: p-value < 0.1. Whiskers indicate 25th percentile (bottom) and 75th percentile (top) +/− 1.5 IQR. e Sankey plot depicting the overlap between subtypes of TNBC samples (METABRIC cohort, n = 256) classified by Burstein22 and the BCC. f ERBB2 expression levels across BCC subtypes in the TCGA dataset (n = 970). The color key indicates types of CNA change. ***: p-value < 0.001, **: p-value < 0.01, *: p-value < 0.05, -: p-value < 0.1. g Proportion of alterations in biomarker genes among BCC subtypes (TCGA and METABRIC datasets, n = 2827). h Barplot depicting various types of alterations in biomarker genes across BCC subtypes. The purple scale shows -log10(adjusted p-values) for the right-tailed Fisher’s exact test. i Panorama of events in driver genes across BCC subtypes (TCGA and METABRIC datasets, n = 2906).
Using the BCC classifier to analyze TCGA samples with available pathology slides annotated as HER2-low, we found the Invasive Non-special type Carcinoma (NST) to be the predominant histological subtype within the BCC HER2-low category (84%), accounting for the vast majority of cases (Supplementary Table 3). The Invasive Lobular Carcinoma (ILC) subtype constituted the second largest group at approximately 10%.
Interestingly, HER2-low samples showed a significant overlap with the Burstein TNBC-LAR subtype27, characterized by androgen signaling. From 5602 samples with IHC annotation, 2.2% were HER2-low (n = 126). Then, among these, 69% (n = 87) were TNBC. For samples from the METABRIC dataset with IHC and Burstein annotation (n = 256), 32 were classified as TNBC-LAR. Among these TNBC-LAR samples, 66% (n = 21) were classified as BCC HER2-low (Fig. 3e). Correspondingly, among the HER2-low TNBC samples, 55% (n = 21) were TNBC-LAR. We also noted a much higher AR gene expression in BCC HER2-low samples compared to BCC Basal samples, but did not find a difference in AR expression levels with other subtypes (Fig. 3d). In concordance with this finding, a similar level of heterogeneity was reported recently by the LAURA classification54 within identified HER2-low samples, as shown in Supplementary Fig. 3e. Here, the heatmap shows a group of samples with high expression of genes common for LAURA group A (PRF1, WNT10A, IL12RB2, GZMH, HOXB13, PAX5, TIGIT). It also confirms the presence of samples with low expression of all genes, indicative of a signature of samples from Group B. This analysis shows that the molecular BCC HER2-low subtype is also heterogeneous when projected into a space of features revealed in the LAURA classification.
The BCC HER2-low subtype mostly consisted of the HER2-low subtype as defined by IHC
Sample annotations in TCGA, METABRIC, and SCAN-B only contain information on hormone receptor and HER2 status by IHC, without HER2 scores. The HER2-low subtype was identified using cut-offs for ERBB2 RNA-seq expression. Notably, 92% of BCC HER2-low patients from the TCGA cohort had ERBB2 expression between 6 and 8.5 log2 TPM, which was previously defined as a cut-off for IHC HER2-low concordance (Fig. 3f, Supplementary Fig. 3d, Supplementary Table 4)55. Conversely, only 6% of BCC HER2-low patients showed ERBB2 amplification. Correspondingly, all samples from the BCC HER2-high group had ERBB2 expression higher than 8.5 log2 TMP, and 87% of these samples showed amplification in ERBB2 (Fig. 3c, g), consistent with the PAM50 HER2-enriched subtype as defined by IHC. The METABRIC dataset demonstrated the same distribution of ERBB2 expression and amplification across BCC samples (Supplementary Fig. 3a).
Noteworthily, the HER2-low IHC group contained not only BCC HER2-low samples but also samples of the Basal, LumA, LumB subtypes (Supplementary Fig. 3d), which is in agreement with previously reported heterogeneity of this IHC group54. On the other hand, the vast majority of samples in the BCC HER2-low group (96%) were HER2-low samples as defined by RNA cut-offs and did not contain samples of other subtypes. Therefore, our findings indicate that the BCC can stratify breast cancer samples better than IHC can, particularly with regards to HER2 status.
Distinctive genetic alterations in BCC HER2-low samples
Deep investigation of genomic alterations on TCGA and METABRIC datasets (n = 2827) showed the HER2-low subtype to have the highest percentage of samples with amplifications of EGFR (11%, p-value = 6e-5, Fig. 3g), a gene that encodes a key HER2 coreceptor, among other subtypes, and elevated EGFR expression (Fig. 3d). The BCC HER2-low subtype was enriched with ERBB2 missense mutations (8%, p-value = 0.05) in the tyrosine kinase domain (Supplementary Fig. 3b), mostly resulting in a gain of function (GOF). TP53 was altered in 72% of cases, and mutations mostly featured missenses and frameshifts. The HER2-low subtype also featured amplification in AKT1 (9%, p-value = 1e-5), PIK3CA (53%, p-value = 0.02) including known GOF variants13 H1047R (44%), E545K (9%), E542K (5%) (Supplementary Fig. 3c), and PTEN (11%, p-value = 0.04) (Fig. 3h), cumulatively altering genes of the PI3K pathway in 73% of HER2-low samples (with at least one alteration). Observed genomic alterations and overexpression of markers such as AR allow us to assume a similarity between the BCC HER2-low and TNBC LAR subtypes26,56.
The BCC HER2-high subtype consisted mostly of HER2-amplified samples, while the Basal, LumA, and LumB subtypes showed the expected genomic and transcriptomic features. Genomic profiling of the HER2-high subtype revealed similar mutational events as previously reported in literature for the PAM50 HER2-enriched subtype7,57. The percentage of coding mutations in TP53 was significantly higher for the HER2-high than for other subtypes (65% of mutated samples, p-value = 2e-34, Fig. 3h, i). Similarly, the percentage of TOP2A amplification, frequently co-amplified with ERBB2, was also significantly higher (23%, p-value = 2e-44, Fig. 3g)58.
Among the BCC Basal samples, 82.3% were TNBC (Fig. 1h) presenting with known genetic features of subtypes TNBC-BLIS and TNBC-IM27. Moreover, 83% of the BCC Basal samples had mutations in TP53, the highest among all subtypes (p-value < 1e-108) (Fig. 3h, i). BRCA1 germline mutation was also a relatively common event for Basal samples (10%, p-value < 1e-8) along with BRCA1 somatic mutation (6%, p-value < 1e-4) (Fig. 3h). However, the Basal subtype differed from other subtypes in that amplifications of GATA3 (22%, p-value < 1e-46) and PIK3CA (9%, p-value < 1e-11) were more common (Fig. 3h). Deep PTEN deletions were detected in 6% (p-value < 1e-5) of the Basal samples.
Among all the genetic events analyzed, only mutations in PIK3CA (60%, p-value < 1e-26), CDH1 (18%, p-value < 1e-8), and MAP3K1 (17%, p-value < 1e-6) were statistically significantly more frequent in the LumA subtype than in all other subtypes7. The LumB subtype was characterized by mutations in AKT1 (5%, p-value < 1e-6) and GATA3 (17%, p-value < 1e-19, Fig. 3h, i).
The BCC Luminal, Basal, and HER2-high subtypes showed expected marker expression and pathway activity
Gene expression analysis across the BCC Luminal subtypes revealed features commonly associated with these subtypes as defined by currently used classifications, such as a high expression of hormone receptor genes (ESR1, PGR), luminal markers (GATA3, FOXA1), kinase receptor genes (ERBB3, IGF1R), and the cell migration gene AGR3 (Fig. 4a)16,46. The expression of ESR1, GATA3, and FOXA1 was higher in subtype LumB than in LumA, while PGD expression was higher in subtype LumA and showed a bimodal distribution in subtype LumB. These subtypes also exhibited the expected low expression of basal marker genes SOX11 and FOXC1 (Fig. 4a, b)59,60 and cell cycle genes such as CCNE1, MYBL2, CCNB2, CDC20, and RRM246. Interestingly, the expression of cell cycle genes was higher in LumB than in LumA samples, indicative of a higher proliferative potential of LumB tumors.
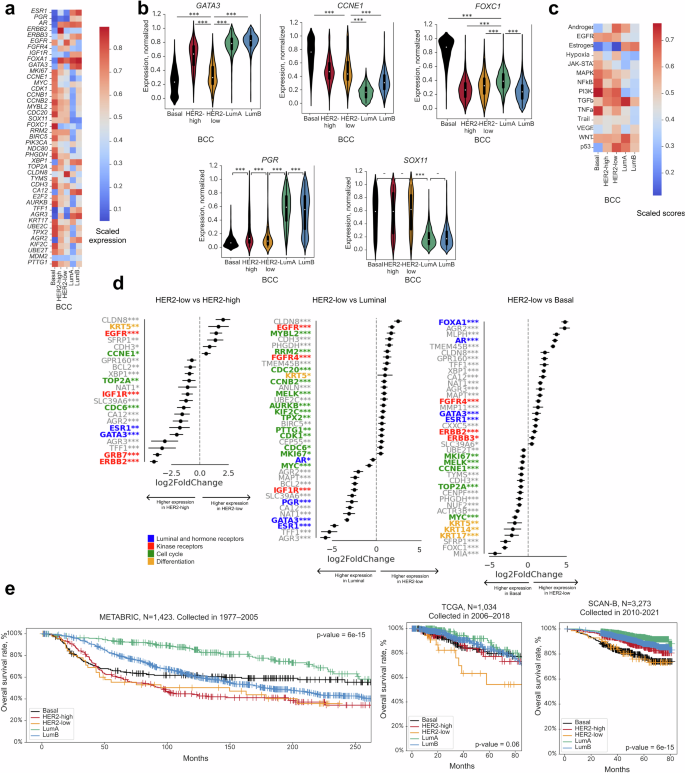
a Heatmap of differentially expressed genes across BCC subtypes in TCGA, SCAN-B, and METABRIC cohorts (n = 6223). b Violin plots showing normalized gene expression levels (in scaled units) across BCC subtypes in TCGA, SCAN-B, and METABRIC cohorts (n = 6223). ***: p-value < 0.001, **: p-value < 0.01, *: p-value < 0.05, -: p-value < 0.1. Whiskers indicate 25th percentile (bottom) and 75th percentile (top) +/− 1.5 IQR. c Heatmap showing patterns of PROGENy signaling pathways across BCC subtypes in METABRIC, TCGA, and SCAN-B datasets (n = 6223). d Top differentially expressed genes in HER2-low vs HER2-high, HER2-low vs Luminal, and HER2-low vs Basal subtypes. Asterisks show adjusted p-value with FDR correction for each scaled feature calculated using the limma package. ***: p-value < 0.001, **: p-value < 0.01, *: p-value < 0.05, -: p-value < 0.1. e Kaplan–Meier survival curves for BCC subtypes. Survival rates were analyzed based on historical data for the METABRIC, TCGA, and SCAN-B cohorts. p-values for the logrank test are shown. The HER2-low subtype possessed intermediate features among all BCC subtypes.
The HER2-high subtype, as expected, showed the highest ERBB2 expression (Fig. 4a). Cell cycle (MKI67, CDK1, CCNB1) and mitosis (TPX2, AURKB, NDC80) genes were also highly expressed. Additionally, UBE2C, UBE2T, and TOP2A were upregulated in the HER2-high subtype in comparison with the HER2-low and Luminal subtypes (Fig. 4a).
Compared to the other subtypes, the Basal subtype showed higher expression of basal phenotype marker genes FOXC1 and KRT11, cell cycle genes (MYC, MKI67, CCNE1, CDK1, CCNB1, MYBL2, CCNB2, E2F2, CDC20), mitosis genes (PTTG1, AURKB, NDC80, KIF2C, TPX2, TOP2A), and differentiation marker gene KRT17 (Fig. 4a). Conversely, expression of hormone receptor genes (AR, ESR1, PGR), luminal marker genes FOXA1 and GATA361, and kinase receptor genes ERBB2 and ERBB362 were the lowest in the Basal subtype (Fig. 4a).
The HER2-low subtype possessed intermediate features among all BCC subtypes
The expression profile of HER2-low samples resembled that of HER2-high samples, with the exception of low expression levels of ERBB2 and neighboring GRB7, which is often co-amplified with ERBB263. The resemblance included high FOXA1 expression and low FOXC1 expression. Compared to the Basal, HER2-high, and Luminal subtypes, the HER2-low subtype showed the highest level of EGFR and CLDN8 expression and the lowest level of IGF1R expression (Figs. 3d, 4a). Pathway analysis showed the HER2-low subtype to have the highest scores for androgen-, hypoxia-, and p53-mediated pathways, but the lowest score for estrogen-mediated pathways (Fig. 4c) among all of the subtypes.
Genes upregulated in the HER2-low subtype in comparison to the Basal and HER2-high subtypes were identified using differential expression analysis (Fig. 4d). The HER2-low subtype is characterized by the overexpression of several genes crucial for cell cycle progression, proliferation (MYBL2, RRM2, CDC20, MKI67, CCNE1, BIRC5), and mitosis (MELK, TOP2A), particularly when juxtaposed against Luminal samples, which concurred with KI67 status as assessed by IHC (Supplementary Fig. 4A). In contrast, expression of cell cycle, proliferation, and mitosis genes in the HER2-low subtype was notably subdued when compared to the Basal subtype, suggesting distinct proliferation dynamics across these subtypes.
The HER2-low subtype showed mixed basal-luminal identity. Overexpression of KRT5 when compared with the Luminal subtypes is indicative of basal features, although KRT5 expression in the HER2-low subtype was still lower than in the Basal subtype. Concurrently, overexpression of FOXA1 and hormone-related genes such as ESR1, PGR, and GATA3 when compared with the Basal subtype suggests luminal characteristics (Fig. 4d).
Genes involved in cell adhesion and migration, such as CDH3 and SFRP1, were overexpressed in the HER2-low subtype when compared to the HER2-high and Luminal subtypes. MMP11 and TMEM45B were overexpressed in the HER2-low subtype when compared to the Basal subtype. CLDN8 was overexpressed in the HER2-low subtype when compared to all other subtypes (Fig. 4d). CLDN8 expression is downregulated in breast cancer in comparison with normal tissue and, depending on the PAM50 subtype or clinicopathological characteristics, can indicate different prognosis64. CLDN8 is an androgen-related gene. Its expression level correlates directly with AR expression level and is usually higher in Luminal breast cancers and in the TNBC-LAR subtype65. These findings correlate with our observation of high AR expression in the HER2-low subtype. Finally, expression of metabolic genes, SLC39A6, NAT1, and CA12,66 was notably lower in HER2-low than in HER2-high tumors.
The BCC subtype classification reflected clinical behavior of breast cancer that correlated with different treatment types and the molecular features of each subtype
Next, we analyzed the survival trends for BCC subtypes using historical data from 1977 to 2005 for the METABRIC dataset and from 2006 to 2013 for the TCGA dataset (Fig. 4e). The HER2-high and HER2-low BCC subtypes showed notably poorer survival outcomes compared to other BCC subtypes. Patterns for all other subtypes potentially reflect the historical evolution in breast cancer treatment modalities, including the introduction and standardization of adjuvant chemotherapy, tamoxifen, and trastuzumab.
The SCAN-B cohort, with sample collection spanning from 2014 onward, likely represents the impact of current treatment standards (Fig. 4e). Intriguingly, the survival trajectory for the BCC HER2-low subtype more closely mirrored that of the Basal group than the other subtypes, suggesting its distinct biological and clinical profile. For all three datasets, the associations remained significant in the multivariable Cox regression model after controlling for stage, ERBB2 mutations, and ESR1 status (Supplementary Fig. 4c). This observation aligns with our hypothesis that HER2-low may constitute a unique biological entity, necessitating a differential therapeutic approach67. Since PAM50 does not define the HER2-low subtype, this survival analysis would not have been feasible with the PAM50 classification. This further emphasizes the clinical significance of the BCC in delineating HER2-low breast cancer as a distinct entity from the other subtypes.
Validation of BCC
To validate the BCC, we created a platform-independent machine learning-based classifier. This classifier is hierarchical and capable of making single-sample predictions because it does not utilize per-cohort scaling. Samples from the TCGA and SCAN-B datasets were mixed and split in the ratio of 70/30 for train-to-test cohorts. The F1 scores on the test data were 0.99, 0.95, and 0.82 for the Basal, HER2-high, and HER2-low subtypes, respectively, demonstrating high performance of our classifier (Supplementary Table 5).
The classifier was subsequently applied to 3165 samples from 15 separate breast cancer datasets obtained from various microarray platforms, which are labeled in Supplementary Table 6 as “Validation cohort”. The UMAP of combined median-scaled gene expression revealed clusters corresponding to the predicted subtypes (Fig. 5a). Gene expression patterns of the predicted subtypes resembled those of the initial classification (Fig. 5b, Supplementary Fig. 5a). Analysis of survival prognosis using the TNBC dataset (Supplementary Table 6) revealed the five-year survival for HER2-low patients to be 33%, the worst among all subtypes (Fig. 5c).
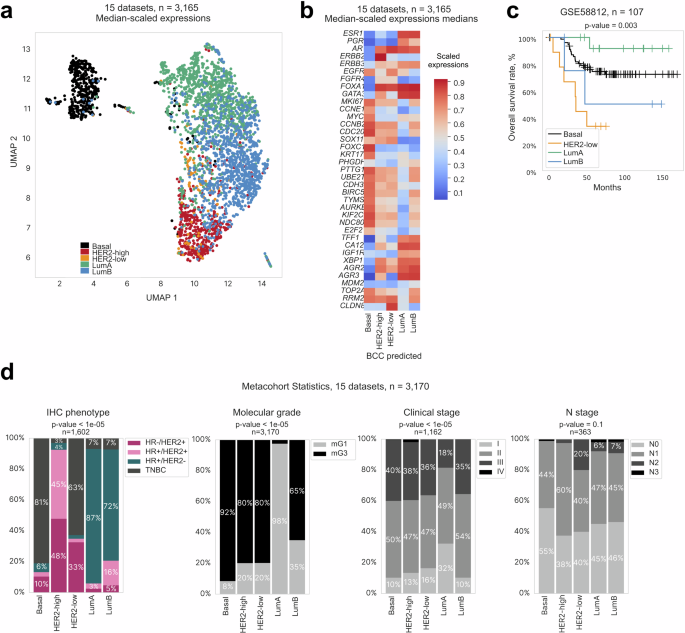
a UMAP visualization of clusters corresponding to subtypes predicted by the BCC. b Heatmap showing gene expression patterns across BCC subtypes (based on median z-scores for expression of biomarker genes). c Kaplan–Meier survival curves (overall survival rate in %, right) for BCC subtypes from the validation dataset. d Barplot showing distribution of sample characteristics across BCC subtypes. From left to right: IHC phenotype, predicted molecular grade, reported stage, N stage.
Investigation of correlation between the obtained classification and the clinical annotation of the samples analyzed revealed that while the IHC subtypes were not entirely substituted by the BCC subtypes, most Luminal samples were HR+ as assessed by IHC (87% and 72% for LumA and LumB, respectively), HER2-high samples were predominantly HER2+ (93%), and Basal samples were mostly TNBC (81%) (Fig. 5d). The BCC LumA subtype consisted of almost entirely molecular Grade 1 (mG1) samples, while other subtypes comprised mostly samples with high molecular grades, especially the Basal subtype (92% mG3). Although the tumor stage was mostly evenly distributed, it was slightly skewed towards low stages for the LumA subtype where 32% of the samples were Stage I.
Discussion
By leveraging a cohort of 6223 breast tumor samples, we have introduced a pivotal modification to the established molecular breast cancer subtyping based on expression of 63 genes that we named BCC. We identified a group of Luminal cancers with a similar gene expression profile as HER2-high tumors with the exception of low ERBB2 expression. The BCC classifier is a platform-independent machine-learning model that brings into focus the distinct nature of the HER2-low subtype as a molecular subgroup often overshadowed in traditional classifications68. The BCC as a machine-learning model consists of hierarchical models based on the LightGBM boosting frameworks and provides high performance metrics.
Our approach was primarily based on the expression patterns of reported PAM50 genes3, supplemented by 13 additional genes selected based on our findings on the HER2-low subtype and refinement of the Luminal group (see Methods). The most differentially expressed genes introduced into the BCC were FOXC1 and FOXA1 (Basal and Luminal subtype, respectively), GATA3 (transcriptional factor and luminal marker69), ACE2 (metastasis, vasoconstrictive promoter70), FABP7 (cell growth and differentiation71), and AKR1B15 (epithelial to mesenchymal transition, inflammatory response72) (Fig. 1c).
In contrast with previously described PAM50 research-based modification and models49,73,74,75, the BCC introduces HER2-high as a category for samples exhibiting high HER2 expression and amplification, potentially serving as an alternative to the IHC 3+ HER2 classification (91% concordance between these groups). Contrasting with this, the BCC HER2-low subtype, marked by its absence of significant ERBB2 expression or amplification, redefines traditional HER2 categorizations to correspond with IHC HER2 1+ and 2+ scores. This approach of the BCC to HER2 classification underscores the need for refined diagnostic criteria beyond conventional binary IHC classifications17,35. The presence of different histological subtypes in the BCC HER2-low subtype (Supplementary Table 3) is an interesting observation that warrants further investigation.
While the BCC classification is correlated with IHC subtypes, it is not intended as a replacement for these subtypes. The BCC classification employs the term “subtype” to denote distinct molecular profiles identified through transcriptomic data because it is important to differentiate these from the surrogate subtypes defined by IHC. The correlation between the BCC and IHC classifications is strong: 94% concordance between the BCC Luminal and IHC HR-positive groups (Fig. 1h), 91% between the BCC HER2-high and IHC HER2+ groups (Supplementary Fig. 1j), and 81% between the BCC Basal and IHC TNBC groups (Fig. 5d). Importantly, we want to point out that the IHC HER2-low group is different from the molecularly defined BCC HER2-low subtype because the IHC HER2-low group also included samples of Basal (46%), LumA (97%), and LumB (86%) subtypes, based on RNA-seq cut-offs (Supplementary Fig. 3d). On the other hand, in this study, 92% of samples classified as BCC HER2-low satisfied the requirements for IHC HER2-low status39. These observations are in concordance with findings by Tarantino et al. revealing the IHC HER2-low group as a heterogenous group of tumors rather than a distinct molecular entity76.
It was previously reported that ERBB2-amplified tumors had high expression of EGFR and amplification rate77. However, in our study, we found 11% of HER2-low samples with EGFR amplification (Fig. 3h) and the highest frequency of ERBB2 GOF mutations (Supplementary Fig. 3b) in our HER2-low subtype compared to the other subtypes. These findings suggest that ERBB2 signaling may still be activated in HER2-low tumors, possibly through a different mechanism than in HER2-high or ERBB2-amplified tumors. The perceived reliance on alternative growth and survival pathways may constitute additional avenues for targeted EGFR, anti-HER2, and anti-EGFR therapies78. By classifying tumors with the highest activation of the EGFR-HER2 pathway as HER2-low without mandating ERBB2 amplification or overexpression (Fig. 4a, c, d), the BCC can define non-HER2-amplified samples more accurately. Our identification of the HER2-low subtype as an intermediary between the Luminal and Basal subtypes underscores its alignment with the IHC criteria for HER2-low and its enrichment with ERBB2 mutations. Given this unique molecular characterization, we advocate for the exploration of targeted ADC treatments, specifically trastuzumab deruxtecan, as a viable therapeutic strategy for patients within this distinct subgroup40,41. Reflecting on the efficacy of trastuzumab deruxtecan in HER2-mutant lung cancer, we recognize the promise of exploiting the ERBB2 mutation landscape for targeted ADC treatments across different molecular subtypes of breast cancer79.
While the expression of ESR1 and PGR in HER2-low tumors was lower than in Luminal tumors (Fig. 4d), it was much higher than in Basal tumors. The same was observed for AR, the expression of which has been reported in approximately 60% of all breast cancers, mainly in ER-positive tumors (about 70%)80. In agreement with this published report, we found AR to be coexpressed with ER in HR+ breast cancer (Fig. 3d). Notably, contrasting proliferative and anti-proliferative effects have been reported in breast cancers expressing both ERα/ERβ and AR81. At the same time, AR-mediated activation of HER2/HER3 signaling enhances MYC activity82 and activation of the Wnt/β-catenin pathway. Studies in women with HER2+ breast cancer have consistently indicated that AR-positive patients have a worse prognosis83. Considering that the HER2-low subtype significantly overlapped with the TNBC-LAR subtype (Fig. 3e), these tumors may potentially respond to hormonal treatments targeting androgen receptor84,85. This notion is also supported by the elevated expression of CLDN8 (androgen-related gene) in the HER2-low subtype. Our current findings and those published by others suggest that CLDN8 warrants further investigation as a potential biomarker for androgen receptor-targeted therapy or a new therapeutic target23,24.
Overexpression of genes involved in cell adhesion and migration, such as CDH3, SFRP1, MMP11 TMEM45B, and CLDN8 (Fig. 4d), suggests alterations in cell-cell adhesion and potential changes in migratory or invasive properties, impacting tumor aggressiveness and metastatic capability86,87,88,89,90,91. Moreover, the expression of the insulin-like growth factor 1 receptor (IGFR1) has been associated with metastatic signatures92,93. This was supported by substantial representation in samples of higher molecular grades (mG3) and advanced cancer stages (III and IV) that closely mirrored the Basal subtype (Fig. 5d). In terms of lymph node involvement, there was a notable distribution across N stages, with N2 and N3 being prevalent in the HER2-low subtype, underscoring the clinical observation of its metastatic potential and survival rate (Figs. 4e, 5c, d).
Interestingly, the BCC Basal subtype showed GATA3 amplification, an observation that contradicts previous findings where only GATA3 loss was observed in Basal-like tumors94. GATA3 was recognized for its tissue-specific transcriptional regulation, emerging as a master regulator in breast cancer with its expression pattern serving as a marker of luminal cell lineage and estrogen receptor-positive phenotypes95. In the BCC Basal subtype, no deep deletions of GATA3 were found, although it had a low expression level of GATA3 (Fig. 4b) that was not associated with CNA status (Supplementary Fig. 4b). This observation concurs with a previous report showing that GATA3 mRNA level is not correlated with its amplification in Basal tumors96.
Our study highlights the complexities of the Normal subtype in the PAM50 breast cancer classification that is influenced by high normal cell content and the presence of components like DCIS. Importantly, our findings highlight the need for samples traditionally classified as Normal to be viewed as an integral continuum of the Luminal subtypes that reflects the spectrum of hyperplasia, DCIS, and normal cell proportions16,49.
By delineating subtypes LumA and B more distinctly using the BCC, we can refine the therapeutic stratification for de-escalation therapy97. The improvement in the recall score for LumB, as demonstrated in our study (Supplementary Fig. 2b-d), accurately identifies patients with more aggressive disease. Furthermore, the integration of molecular grade as a feature in survival analysis reaffirms the biological distinction between LumA and B52,98.
While the PAM50 classifier has been pivotal to molecular subtyping of breast cancer, it may not capture the full biological diversity of tumors, particularly in metastatic cases. Moreover, given the extremely high costs of breast cancer drugs for seven major markets (the US, France, Germany, Italy, Spain, United Kingdom, and Japan)—fueled particularly by the demand for CDK4/6 inhibitors ($9.1 billion in 2023) and HER2-targeting agents ($9.6 billion in 2023), and projected increases for drugs like trastuzumab deruxtecan ($9.5 billion by 2032)99—it is crucial that these costly therapies are prescribed to patients who are most likely to benefit from these treatments. Clinical trials, including PALOMA-2 and PALOMA-3, have revealed non-Luminal breast cancer subtypes, representing 20–25% of patients, to exhibit less pronounced responses to palbociclib, underscoring the need for more precise patient stratification100,101. Similarly, the MONALEESA-2, -3, and -7 trials showed that while Luminal breast cancers benefited from ribociclib, patients with Basal-like subtype (2.6%) did not gain significant therapeutic benefits102. Although the HER2-enriched subtype identified by PAM50 showed some response to ribociclib, this classification is problematic as it does not always represent HER2-driven tumors. Studies like PAMELA and KEYRICHED-1 confirmed the HER2-enriched subtype to be predictive for HER2-targeted therapy only when combined with high HER2 expression103,104. The BCC improves upon this by distinguishing between the HER2-high and HER2-low subtypes, the latter being more closely aligned with IHC HER2 1+ and 2+ scores. Given the inconsistencies in identifying HER2-low samples by IHC among different pathologists105 and the impact of intra-tumor heterogeneity on IHC findings106, the BCC potentially offers a more reliable and cost-effective approach for routine clinical practice, particularly in guiding treatment of cases where current methods fall short. Ongoing trials, such as HARMONIA SOLTI-2101107 and SOLTI-1303 PATRICIA108, are expected to further demonstrate the clinical utility of molecular subtyping in breast cancer as a viable alternative to IHC, especially in metastatic settings.
With regards to the BCC, while it showed promise in our study in refining breast cancer molecular classification—particularly in the identification of HER2-low cases—it is crucial to validate these findings in well-designed clinical trials before considering widespread adoption. Prospective studies are needed to confirm that BCC-driven stratifications align with patient outcomes and accurately predict responses to targeted therapies.
Methods
Tumor datasets
The following publicly available gene expression datasets with clinical annotation were used for this study: TCGA7, SCAN-B44, and Molecular Taxonomy of Breast Cancer International Consortium (METABRIC)45, totaling 6223 patients. Datasets of primary tumors were collected for different years, and patients were treated according to guidelines approved for the corresponding period. The TCGA and METABRIC datasets also contained information on mutations and amplifications. For classifier validation, gene expression data from 19 microarray cohorts and one RNA-seq cohort were used (Supplementary Table 6). The selected cohorts contained data on IHC phenotypes, except for the TNBC dataset for survival data validation.
Datasets with reported PAM50 annotation (totaling 6217 samples) were used to validate the BCC annotation. For annotation consistency, the Claudin-low subtype was merged with the Basal-like subtype and the Normal-like subtype with the Luminal subtype. The “ERBB2” and “HER2-enriched” labels were merged into the HER2-enriched subtype for uniformity as previously reported7.
Collection and processing of WES and copy number alteration (CNA) data
TCGA data were downloaded from the GDC TCGA data portal7. CNA data were evaluated with ABSOLUTE109. Fully processed METABRIC data were downloaded from the European Genome-Phenome Archive45.
The collection and processing of gene expression data
TCGA transcriptomic data were downloaded from USCS XENA110 as TPM units and processed as described previously in Bagaev et al.111. SCAN-B RNA-seq data were downloaded from Gene Expression Omnibus (GEO): GSE81538112 and GSE96058112.
Raw and processed microarray data were also downloaded from GEO (Supplementary Table 6). Wherever possible, expression data were re-processed from raw files using affygcRMA and oligo R packages. All Affymetrix datasets with available CEL files (Cell Intensity File for raw microarray data) were re-normalized using the gcRMA package with default parameters. Illumina array data were downloaded from GEO as is. Next, probes were converted into genes using one probe with the highest mean values in the cohort per gene. Samples with the following characteristics were omitted: PCA outlier and low correlation with others within the cohort (<0.8 for Affymetrix platforms; <0.65 for Illumina platforms).
BCC subtype definition
The BCC classification was created using a manual annotation approach that combined clusterization and implementation of signature scores. Clusterization was performed stepwise for each dataset (Supplementary Table 6—discovery cohorts) with genes from the PAM50 subset and four additional markers (discussed later in this section) corresponding to each class. Specifically, upon identification of one class of samples, this class was excluded and the remaining samples were reclustered. This step was repeated until all samples were assigned into one of five subtypes: HER2-high, HER2-low, LumA, LumB, and Basal (Fig. 1a, b).
In the initial phase of this study, a hierarchical clustering analysis was performed using the standard PAM50 gene subset. This approach utilized the cityblock metric for distance measurement between two samples and an average linkage criterion (which defines how distance between two clusters is measured) for preliminary identification of the Basal, HER2-high, and Luminal clusters. Samples that clustered together with HER2-high but had low expression of ERBB2 were classified as HER2-low. Further differential expression analysis between HER2-low and Luminal samples identified four markers as additional features for automatic separation: ACE2, FABP7, AKR1B15, and GATA3. For exact class separation, UMAP was performed, followed by subtype division in this projection using Hierarchical DBSCAN113,114 clustering with different arguments (the list of genes for each subtype is presented in Supplementary Table 1). In the first iteration, UMAP defined the Basal subtype. In the second iteration, the HER2-high subtype was segregated from the remaining samples. Finally, the last projection uncovered the HER2-low subtype (Fig. 1a, b). The remaining samples were classified as Luminal and subjected to further differentiation into subtypes LumA and LumB. An approach based on KI67-positivity (≥ 20% by IHC) was applied. Briefly, the available KI67 values in the SCAN-B luminal samples were used (n = 1270), and sets of proliferative and anti-proliferative genes (each with the top nine genes) were defined by differential expression analysis (Fig. 2g, Supplementary Fig. 2b). Enrichment scores (ESs)115 for each of these two gene sets were calculated and used as explanatory variables to train a logistic regression classifier (Fig. 2g). Metrics for regression were F1 scores between the LumA and LumB subtypes and the threshold that provided the highest F1 score was chosen. The position of this threshold is reflected on the ROC curve (Supplementary Fig. 2b).
The following BCC subtype annotation was used for validation: Basal, HER2-enriched (HER2-high and HER2-low), and Luminal (LumA and LumB). The previously reported annotation7,116 was also simplified to merge the Normal-like, LumA, and LumB subtypes into the Luminal subtype, while the HER2-enriched and Basal-like subtypes remained unchanged.
Classifier training for the BCC
Manual subtype annotation performed on the SCAN-B and TCGA datasets was subsequently used to train a machine learning-based hierarchical classifier. At each step, a separate classifier made a binary prediction to assign a test sample to one of two groups. The architecture of the classifier is the same as in the manual annotation approach. Dead-end groups are assigned to molecular subtypes; composite groups are subjected to separation by the subsequent classifier in the next step.
The Basal, HER2-high, and HER2-low subtypes were distinguished at steps 1, 2, and 3 respectively (Fig. 1a). These steps were performed by LightGBM-classifiers that processed the expression of specific genes (features) in ranks. The PAM50 gene list3 with transcriptional factors included in the annotation was used as initial features for each LightGBM-classifier. Then, feature selection was performed for each classifier. This process started with a full set of 52 biomarker genes. The LightGBM model was launched on data with this subset of features. The impact of each feature on the model result was calculated, and the cross-validation performance metric (F1) of the model was saved using the Shapley values117 (shap.TreeExplainer function with standard parameters). Shapley values were chosen as a feature selection algorithm because they showed utility and reliability as a feature selection method in transcriptome data118. Then, a feature with lower impact values was eliminated and the process was repeated until the number of features became lower than the limit (5 features). Finally, the subset of features which showed the highest F1 scores was chosen as the optimal set of features (Supplementary Table 1). Hyperparameters for each model were selected using a randomized search with a cross-validation splitting strategy. The following parameters were optimized: learning_rate, n_estimators, num_leaves, colsample_bytree, subsample, reg_alpha, reg_alpha. A list of optimal parameters for each model and the code can be shared upon reasonable request. This process was repeated for each LightGBM model. Thereafter, the classifiers were trained and tested on subsets from the SCAN-B and TCGA datasets combined (Supplementary Table 6—discovery cohorts) and validated on 16 cohorts (Supplementary Table 6—validation cohorts).
Statistical analysis and visualization of WES data
METABRIC and TСGA cohorts were examined to estimate the incidence of various genetic events in different BCC subtypes (Fig. 3i). The events of interest were: somatic mutations in coding regions, deep deletions (complete loss of a gene), and amplifications (total number of gene copies ≥ 2*ploidy). Samples with detailed annotation and data on any alterations of interest were analyzed. All types of alterations—coding mutations, amplifications, and deletions—were examined to obtain a panoramic view of driver events across BCC subtypes (Fig. 3i). The right-tailed Fisher’s exact test, calculated using the scipy Python package119, was used to determine whether a particular BCC subtype could be characterized by the presence of a particular genetic event (somatic mutation, oncogene amplification, or oncosuppressor deletion) (Fig. 3h). Each subtype was compared against the sum of the other subtypes. Statistics on germline mutations in BRCA1 were also included in the analysis.
Statistical analysis and visualization of gene expression data
PROGENy score48 was calculated based on the gene expression patterns of samples from METABRIC, TCGA, and SCAN-B datasets (Fig. 4c) to assess the activity of various signaling pathways in different BCC subtypes. The following unified algorithm was used to describe the identified BCC subtypes based on the expression patterns of selected genes, cell percentages, or PROGENy pathways. First, for processing the outliers for each feature, values outside the 2nd and 98th percentiles were trimmed from each dataset. Further, features were linearly and independently scaled from 0 to 1 for each dataset. Then, these processed values from the datasets were merged and subsequently used to compare the BCC subtypes with one another. For each feature, the ad-hoc Kruskal–Wallis H test, calculated using the SciPy Python package119, was used to confirm that all groups do not originate from the same distribution. The p-value for each scaled feature was calculated using the Dwass-Steel-Critchlow-Fligner all-pairs comparison test, calculated using the scikit-posthocs Python package120. For heatmaps in Figs. 4e and 5b and Supplementary Fig. 2a, the median value of each feature for each BCC subtype was calculated for ease of visualization. Differential expression analysis was performed using the limma R package101. Transcription factors121 with high expression were identified for each subtype in the subtype description step using decoupler package v. 1.3.1122.
Signature construction for the Normal-like subtype
For comparison of the Normal-like subtype with the Normal subtype, adipose, proliferation, and keratin signatures were used. Genes analyzed for the adipose signature were CAV1, FABP4, PPARG, ADIPOQ, LEP, PPARG, and PLIN150. The proliferation signature used was developed in-house and has been reported previously94. The keratin signature was constructed using the following genes: KRT5, KRT14, KRT15, and KRT1616,21. Lists of genes are presented in Supplementary Table 7. Signature scores were calculated using the ssGSEA algorithm115.
Selection of features for subtype description
Each BCC subtype was described based on its mutations, gene expression patterns, and CNAs. Highly and lowly expressed genes for each subtype were selected using differential expression analysis. For this purpose, genes with the highest standard deviation in their expression values were included. Differential expression analysis was performed on the METABRIC and SCAN-B datasets. For each dataset, 20 genes with top fold changes between subtypes were intersected. Additionally, highly expressed transcription factors were identified for each subtype. All genes from these steps were further merged into one list that was then refined by removing genes that have not been reported as biomarkers in breast cancer. Genes with specific mutations were selected for each subtype using a chi-squared test. For each gene, ratios between the number of patients with the mutated and wild-type variants were calculated across all five subtypes and evaluated using the chi-squared test with FDR correction to select for genes with ratios that differed significantly from each other. Then, these genes and those with a ratio of more than 5% in at least one subtype were used for subtype description. Genes with CNAs were selected based on reports on their status as biomarkers in breast cancer.
Differential expression analysis was also used to compare the HER2-low subtype with other subtypes. Here, the HER2-low subtype was subsequently compared with the Basal, HER2-high, and Luminal (LumA and LumB) subtypes using the TCGA dataset. The difference in gene expression was calculated using the DESeq2 algorithm121.
Histological examination of the Normal-like subtype
A histological re-examination was conducted for 49 PAM50 Normal-like samples using available FFPE tissue slides from the TCGA dataset. This procedure was performed by two experienced pathologists blinded to the original PAM50 molecular annotations to ensure an unbiased assessment. These samples were selected to represent the diversity within the Normal-like TCGA PAM50 subtype.
The histological evaluation focused on the following aspects: visual assessment of neoplastic cellularity (in %), the measurement of DCIS areas, breast cancer grading according to standard criteria123, the organization of stromal tissue, and the evaluation of areas occupied by normal breast tissue. These characteristics were selected to delineate the histological features associated with the molecular profile of a sample.
Survival analysis
Survival differences were assessed using log-rank tests from lifelines version 0.27.3124 and presented on Kaplan–Meiers plots. For survival analysis based on the expression of biomarkers, single-variate or multivariate Cox regression was conducted.
IHC labels by RNA-seq cut-offs
For defining IHC status for estrogen (ER) and progesterone (PR) receptors and HER2, an alternative RNA-seq approach utilizing the expression of ESR1, PGR, and ERBB2 with selected cut-offs reported by Kushnarev et al. 55,125 was used. Samples from the TCGA dataset were labeled using this approach, as shown in Fig. 3a. The selected cut-offs were (High/Low) 3.5 for ESR1 and (High/Medium/Low) 8.5/6 for ERBB2 (Supplementary Table 4).

Responses