The cellular and molecular cardiac tissue responses in human inflammatory cardiomyopathies after SARS-CoV-2 infection and COVID-19 vaccination
Main
Coronavirus disease 2019 (COVID-19) is primarily a respiratory disease, but systemic and cardiovascular involvement can occur, and acute cardiac injury1,2 with elevation of serum troponins is not uncommon after severe acute respiratory syndrome coronavirus 2 (SARS-CoV-2) infection. Strikingly, the risk and 1-year burden of cardiovascular diseases in survivors of acute COVID-19 are substantial, and the risk to specifically develop myocarditis is approximately fivefold increased3. In children/young adults, SARS-CoV-2 infection can lead to multisystem inflammatory syndrome (MIS-C), with myocarditis being the most prevalent clinical feature4. Cardiac injury can also rarely be induced after receipt of vaccines against COVID-19, in particular those based on mRNA technology5,6. Although evidence for direct SARS-CoV-2-mediated induction of myocardial injury is limited, the infection can elicit intense systemic release of cytokines, possibly leading to a secondary cardiac inflammatory response. Likewise, vaccine-associated myocardial inflammation and injury was shown to be characterized by systemic ‘cytokinopathy’, activated cytotoxic lymphocytes or induction of IL1-RA in the blood7,8. Using immunohistochemical staining of cardiac tissue from patients with clinically suspected myocarditis after SARS-CoV-2 infection or after COVID-19 mRNA vaccination, in particular a macrophage-dominated infiltrate was consistently observed2,9 that also was reported for SARS-CoV10. Furthermore, in patients with post-vaccination myocarditis, primarily CD4+ over CD8+ lymphocytic infiltrates were described11. However, the precise participating immune cell subsets and molecular changes driving their activation in cardiac tissue, as well as cardiac cell type resolved molecular responses, are incompletely characterized. Also, short-term clinical outcomes of cardiac inflammation are more favorable after vaccination, with most cases being mild. This raised the question of how the underlying cellular and molecular mechanisms compare in these different disease entities and whether they differ from pre-pandemic forms of myocarditis.
In the present study, we performed single-nucleus RNA sequencing (snRNA-seq) on cardiac tissue from symptomatic patients who clinically presented with pathological laboratory, electrocardiogram (ECG) and/or non-invasive imaging results of acute myocarditis and had undergone endomyocardial biopsies (EMBs) for diagnostic purposes. We studied EMBs from patients after SARS-CoV-2 infection (including two SARS-CoV-2-related patients with MIS-C) or after SARS-CoV-2 vaccination as well as from patients with histologically confirmed lymphocytic myocarditis that were mostly taken before the pandemic or had no signs of SARS-CoV-2 infection. Comparison of the different myocardial inflammatory modalities revealed common and divergent compositional cellular changes as well as pro-inflammatory and anti-inflammatory transcriptional signatures in patients with Non-COVID-19 myocarditis and those with myocarditis after SARS-CoV-2 infection or vaccination.
Results
Patient cohort and clinical presentation
Our clinical cohort consisted of (1) patients with ‘classical’ lymphocytic myocarditis (Non-COVID-19, n = 8); (2) patients with signs of acute myocarditis after SARS-CoV-2 infection (Post-COVID-19, n = 10); (3) patients with signs of acute myocarditis after vaccination against COVID-19 (Post-Vaccination, n = 4); (4) patients with MIS-C with signs of acute myocarditis (n = 2); and (5) control donor left ventricular (LV) tissue that we analyzed previously12,13. All patients presented with symptoms including chest pain, palpitations, fever, shortness of breath, malaise and/or general weakness and fatigue and an overall increase of cardiac damage-indicating biomarkers (troponin T, N-terminal prohormone of brain natriuretic peptide (NT-pro-BNP), creatine kinase or creatine kinase MB) and C-reactive protein (CRP) levels (Fig. 1a). ECG, echocardiography or signs of recent or ongoing myocardial damage in cardiac magnetic resonance imaging (MRI), ranging from normal or non-specific to borderline low or abnormal, are summarized in Extended Data Table 1. All patients underwent LV EMBs and left heart catheterization after routine non-invasive diagnostic workup, and angiography had failed to elucidate any other specific cause of heart failure, such as coronary artery disease. Post-COVID-19 patients and patients with MIS-C were previously tested positive for SARS-CoV2 infection by nasopharyngeal swab test polymerase chain reaction (PCR). Most Post-Vaccination patients experienced symptom onset within days after the second dose of the vaccine. Consistent with prior reports7,9,14, the cohort was predominantly male (87.5%; Non-COVID-19: 87.5%, Post-COVID-19: 80%, Post-Vaccination: 100% and MIS-C: 100%) with an average age of 37 ± 16 years (range, 19–70 years). The age of the two patients with MIS-C was 20 years and 21 years. Post-COVID-19 patients were slightly older than the other patients (Fig. 1a and Extended Data Table 1). Selection of Non-COVID-19 patients was based on positive EMB results showing lymphocytic myocarditis and similarities in sex and age compared to the other disease groups. In the MIS-C group, one patient underwent an additional EMB, 6 months after combined immunosuppression with prednisolone and azathioprine.
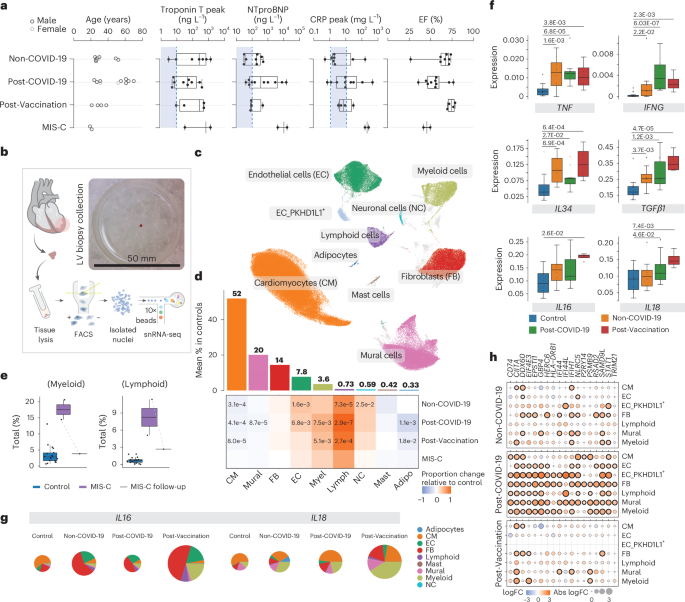
a, Infographic depicting metadata for Non-COVID-19 (n = 8), Post-COVID-19 (n = 10), Post-Vaccination (n = 4) and MIS-C (n = 2) patients. Left panel, patient age; women and men, light and dark gray, respectively. Middle panels, box plots showing serum levels of troponin T, NT-pro-BNP and CRP; dashed lines and blue areas indicate normal ranges. Right panel, box plots showing left ventricular ejection fraction (EF). b, snRNA-seq workflow schematic: EMBs were lysed and nuclei purified using FACS. Nuclei were processed using 10x Chromium 3′ chemistry. Image shows EMB size before nuclei isolation. c, UMAP embedding of 205,596 nuclei delineated 10 cardiac cell types and unassigned populations (gray). d, Upper panel, mean cell type abundances (%) in controls (n = 18). Lower panel, proportional changes of cell types in Non-COVID-19 (n = 8), Post-COVID-19 (n = 10) and Post-Vaccination (n = 4) versus control. Color scale: red (increase) and blue (decrease). Significant P values (FDR ≤ 0.05) are shown. P values were calculated with the two-sided t-test based on CLR-transformed values with Benjamini–Hochberg correction. MIS-C significance was not calculated due to low sample size (n = 2). e, Proportions of myeloid and lymphoid cells in control (n = 18) and MIS-C (n = 2) groups as well as in a follow-up biopsy from one patient with MIS-C.The patient with MIS-C with pre-treatment and post-treatment EMBs is indicated by a dashed line. Significance was not calculated due to low sample size (n = 2). f, Box plots as described in a showing snRNA-seq pseudo-bulk expression levels of cytokines in cardiac tissue from patient and control groups (control: n = 18, Non-COVID-19: n = 8, Post-COVID-19: n = 10, Post-Vaccination: n = 4). Significant P values (FDR ≤ 0.05) are shown. P values were calculated using the quasi-likelihood F-test with Benjamini–Hochberg correction. g, Pie charts comparing cell type resolved absolute mean expression levels of IL16 and IL18 between conditions. Pie size reflects absolute detection levels; colors indicate relative cell type contribution. h, Dot plots showing differential expression of IFNγ response genes in patient groups relative to controls in major cardiac cell types. Dot colors indicate log2-transformed FCs (log2FCs). Dot sizes indicate absolute log2FC. Black circles indicate significance (FDR ≤ 0.05). P value calculations are as in f. Box plots in a, e and f: boxes show interquartile range (IQR); vertical bars indicate the median; and whiskers extend from minimum to maximum values. Dots show individual measurements per patient. Adipo, adipocyte; Lymph, lymphoid; Myel, myeloid.
Source data
Clinical histopathology and immunostaining on EMBs identified substantial widespread increased interstitial macrophage infiltration in all patients and, additionally, lymphocytic myocarditis in 30% of Post-COVID-19 patients, in 25% of Post-Vaccination patients and in 100% of patients with MIS-C (Extended Data Table 1 and Extended Data Fig. 1a,b). Our observations are in agreement with previous reports, where most post-COVID-19 and mRNA-vaccinated patients with signs of myocarditis showed predominantly macrophage infiltrates into the myocardium2,9. No SARS-CoV-2 genome was detected by PCR in EMBs of Post-COVID-19 patients and patients with MIS-C. EMBs that were not used for diagnostic workup were included for snRNA-seq analyses to investigate the cellular and molecular changes of myocardial inflammatory responses across the different disease entities.
Myocarditis-associated changes in cardiac tissue composition
To generate snRNA-seq libraries, we isolated nuclei from EMBs using our previous protocol with modifications (Fig. 1b and Methods). For comparison to healthy hearts, we used reported full-thickness LV snRNA-seq data from 18 healthy controls12,13 (Extended Data Table 2). Despite the small amount of input material, the resulting EMB sequencing data were of similar quality to those of the full-thickness healthy heart samples (Extended Data Fig. 1c–f). After pre-processing and quality control filtering, nuclei were integrated using Harmony, followed by constructing manifolds using uniform manifold approximation and projections (UMAPs). In total, we analyzed 205,596 nuclei. Clustering identified 10 major cell types (Fig. 1c, Extended Data Fig. 2a,b and Supplementary Table 1) encompassing cardiomyocytes (CMs), fibroblasts (FBs), mural cells containing pericytes (PCs) and smooth muscle cells (SMCs), endothelial cells (ECs), PKHD1L1-expressing ECs (EC_PKHD1L1+) comprising mostly endocardial cells and few lymphatic ECs (Extended Data Fig. 2c), adipocytes, neural cells, mast cells and lymphoid and myeloid cells.
Using center log ratio (CLR)–transformed abundance of cell types13 (excluding EC_PKHD1L1+; see Methods), we compared the cellular composition of healthy versus patient hearts. In line with EMB immunohistochemistry results, myeloid cell proportions were increased in Post-COVID-19 and Post-Vaccination, whereas, in the Non-COVID-19 group, this increase did not reach statistical significance (Fig. 1d and Extended Data Fig. 2d). Surprisingly, we observed increased proportions of lymphoid cells for all patient groups (Fig. 1d) and, indeed, all Post-COVID-19 and Post-Vaccination patients (Extended Data Fig. 2b,d). This was in contrast to the clinical immunohistochemistry results where only a fraction of Post-COVID-19 and Post-Vaccination patients showed lymphocytic myocarditis, defined by the presence of CD3+ T cells. Similar to findings in end-stage heart failure13 and in hearts of deceased patients with COVID-19 (ref. 15), ECs were significantly expanded in Non-COVID-19 and Post-COVID-19. FB abundance remained unchanged, whereas CM and mural cell proportions were modestly reduced across patient groups.
Patients with MIS-C showed increased proportions of immune cells (lymphoids and myeloids), similar to the other patient groups (Fig. 1d and Extended Data Fig. 2d). Strikingly and as expected, comparing the cellular composition of the matching EMBs from one patient with MIS-C showed a marked reduction of immune cells after treatment, indicating normalization of immune cell numbers (Fig. 1e). Due to the low sample size (n = 2), throughout this paper we report MIS-C results only for differences in cell type and state abundances without statistical testing.
Distinct cytokine and inflammasome expression signatures
We determined differentially expressed genes (DEGs) in cardiac tissue using a pseudo-bulk approach that aggregated all nuclei from the same individual (Supplementary Table 2) and detected increased expression of the pro-inflammatory cytokine genes TNF and IFNG across patient groups (Fig. 1f). IFNG was solely expressed in lymphocytes and especially elevated in the Post-COVID-19 and MIS-C groups (Fig. 1f and Extended Data Fig. 3a). Additional interleukin and leukocyte recruiting chemokine (C-X-C and C-C motif) ligand family member encoding genes were upregulated in the patient groups (Extended Data Fig. 3b), consistent with increased immune cell abundances.
We noted stronger upregulation of IL34, a macrophage growth and survival factor, in the Non-COVID-19 and Post-Vaccination groups than in the Post-COVID-19 group (Fig. 1f). In an inflammatory context, IL-34-derived macrophages suppress pro-inflammatory polarization of T cells16. Furthermore, TGFB1 encoding immunosuppressive TGF-β1 was upregulated in all patient groups but highest in the Post-Vaccination group. IL16 and IL18 expression was uniquely increased in the Post-Vaccination group, and expression of inflammasome components such as pattern recognition receptors NLRP1 and NLRP3 and caspases CASP1 and CASP4 necessary for IL18 activation17 were highest in this group (Fig. 1f and Extended Data Fig. 3c). These genes were expressed in multiple cell types, but contribution of myeloids to their overall expression levels was greater in the Post-Vaccination group compared to all other patient groups (Fig. 1g and Extended Data Fig. 3d), suggesting a distinctive myeloid origin of this pathway in the Post-Vaccination group, consistent with previous findings18.
We then determined DEGs in pseudo-bulks of individual cell types and performed gene set enrichment analyses (GSEAs) on DEGs to identify disease-associated pathways. Strikingly, in the Post-COVID-19 group, upregulated gene sets related to interferon-γ (IFNγ) signaling in multiple cell types (Fig. 1h and Supplementary Table 3).
Myeloid expansion and compositional changes in myocardits
Characterization of myeloid cells identified nine previously described13 macrophage states, VCAN+ and non-classical CD16+ monocytes, two conventional dendritic cell states and one decorin (DCN)-expressing proliferative macrophage state (Fig. 2a,b, Extended Data Fig. 4a,b and Supplementary Table 4). Despite the varying extent of the overall myeloid expansion (Extended Data Fig. 2d), we observed similar striking compositional alterations in the myeloid populations in Non-Covid-19, Post-COVID-19 and Post-Vaccination groups compared to control (Fig. 2b and Extended Data Fig. 4a). Among pre-existing resident macrophages, LYVE1hiMHCIIlo with pivotal cardiac repair function19 was barely detectable, whereas proportions of LYVE1loMHCIIhi that effectively stimulate T cell responses19,20 were strongly increased in these three patient groups (Fig. 2b–d). Furthermore, proportions of T cell–stimulating cDC2 were increased, whereas FB-interacting MP_OSM macrophages and MP_FOLR2 were decreased (Fig. 2b and Extended Data Fig. 4a). Reduced proliferating macrophage and expanded CD16+ and VCAN+ monocyte proportions (Fig. 2e and Extended Data Fig. 4a), as well as CX3CR1 expression (circulating monocyte marker) (Extended Data Fig. 4c), indicated recruited monocytes as a source for the LYVE1loMHCIIhi MP increase. Of note, VCAN+ monocytes expressed CCR2 and pro-inflammatory mediators (S100A12, S100A9 and S100A8) (Extended Data Fig. 4d). In a myocarditis mouse model, silencing of CCR2 prevented cardiac monocyte accumulation and chronic decline of LV function21. Patients with MIS-C showed different compositional alterations of the myeloid cell population compared to the other patient groups, with no change in pre-existing resident macrophage proportions but an increase in monocyte proportions exceeding, by far, those observed in the other groups (Fig. 2e). Furthermore, DCN-expressing proliferative macrophages were enriched only in patients with MIS-C. Expression of FB genes in macrophages may indicate the acquisition of a fibrogenic phenotype22,23.

a, UMAP embedding delineated 16 myeloid cell states. b, Upper panel, mean abundance (%) of myeloid cell states in control left ventricles (n = 18). Lower panel, proportional changes of myeloid cell states in the four patient groups (Non-COVID-19: n = 8, Post-COVID-19: n = 10, Post-Vaccination: n = 4). Color scale: red (increase) and blue (decrease). P values are indicated for significant proportional changes (FDR ≤ 0.05). P values were calculated using the two-sided t-test based on CLR-transformed values with Benjamini–Hochberg correction. For MIS-C, significance was not calculated due to low sample size (n = 2). c, Condition-split UMAP showing compositional shifts in myeloid cell states across patient groups and controls. d,e, Box plots showing distribution of Lyve1hiMHCIIlo and Lyve1loMHCIIhi (d) and CD16+ and VCAN+ monocytes (e) across control and disease groups (control: n = 18, Non-COVID-19: n = 8, Post-COVID-19: n = 10, Post-Vaccination: n = 4). Boxes depict the interquartile range (IQR); horizontal bars indicate the median; whiskers extend to 1.5× IQR; and dots show the value of each patient. P values are indicated for significant proportional changes, FDR < 0.05. P value calculations are as described in b. f, Dot plots showing differential expression of selected IFNγ response and MHC-II genes in patient groups relative to control across Lyve1hiMHCIIlo and Lyve1loMHCIIhi (control: n = 18, Non-COVID-19: n = 8, Post-COVID-19: n = 10, Post-Vaccination: n = 4). Dot colors indicate log2-transformed FCs (log2FCs). Dot sizes indicate absolute log2FC. Black circles indicate significance (FDR ≤ 0.05). P values were calculated using the quasi-likelihood F-test and were adjusted for multiple testing (Benjamini–Hochberg). Genes are ordered alphabetically.
Source data
DEG analysis comparing myeloid states in patient groups versus control revealed the highest number of upregulated genes in LYVE1loMHCIIhi macrophages (Supplementary Table 5), including CARMIL1, MAF, WWP1 and CD83, indicating higher activation and interstitial migration capacities24,25 (Extended Data Fig. 4e). Contrary to reports for macrophages from lung of patients with severe COVID-19 and from blood of patients with perimyocarditis after vaccination7,26, we did not observe pro-fibrotic gene expression responses in cardiac myeloids. However, GSEA on DEGs per cell state identified upregulated gene sets related to IFNγ signaling in LYVE1hiMHCIIlo, LYVE1loMHCIIhi and proliferating macrophages as well as in cDC2 from Post-COVID-19 patients (Fig. 2f and Supplementary Table 3). IFNγ is known to increase pro-inflammatory activity in macrophages27 and to induce major histocompatibility complex class II (MHC-II) gene expression28. Indeed, macrophages in the Post-COVID-19 group showed upregulated class II MHC transactivator encoding CIITA and MHC-II genes (Fig. 2f).
Distinct lymphocyte responses in Post-COVID-19 and Post-Vaccination
Subcluster analyses of lymphoid cells revealed 10 T cell and three natural killer (NK) cell states as well as plasma, B cells and a small population of IFNγ-producing NK cells (Fig. 3a–c, Extended Data Fig. 5a,b and Supplementary Tables 6 and 7). Within the T cell population, we observed higher CD4+ to CD8+ T cell ratios in Non-COVID-19, and this effect was even more pronounced in Post-Vaccination, aligning with previously reported predominance of cardiac CD4+ lymphocytic infiltrates in response to COVID-19 vaccination11. In contrast, CD8+ T cells dominated in the Post-COVID-19 and MIS-C groups (Fig. 3d). Overall, CD8+ T cells displayed higher expression of gene sets related to cytotoxicity compared to CD4+ T cells (Extended Data Fig. 5c). The differences in T cell ratios between disease groups were attributable especially to a relative increase in regulatory, Tem1 and central memory CD4+ T cells in Non-COVID-19 and Post-Vaccination (Fig. 3b,e). Additionally, RORC+CD4+ T cells were increased in these groups, albeit not statistically significantly. Conversely, cytotoxic GNLY-expressing effector cell proportions and mature NK cells (NK_CD16hi) increased in Non-COVID-19, Post-COVID-19 and MIS-C but not in Post-Vaccination (Fig. 3b). Proliferating T cells were increased only in MIS-C (Extended Data Fig. 5a). CD8+ T cells in Post-COVID-19 furthermore showed upregulated expression of activation markers such as CD38 and HLA-DR (Fig. 3f) and higher PRF1 expression levels encoding the cytotoxic effector molecule perforin than Non-COVID-19 and Post-Vaccination (Fig. 3g), suggesting an increased cytotoxic potential of CD8+ T cells in hearts of Post-COVID-19 patients. Interestingly, we identified highly activated CD16+CD8+ T cells (CD8T_act_effector) with strong cytotoxic functions and high similarity to CD16+CD8+ T cells previously identified in the blood of patients with severe COVID-19 (ref. 29). These cells were significantly enriched in cardiac tissue of Post-COVID-19 patients (Fig. 3b). Nuclei within this cluster expressed TRAC, TRDC and TRGC1/2, indicating a mixed cluster of αβ and γδ T cells that could not be separated further.
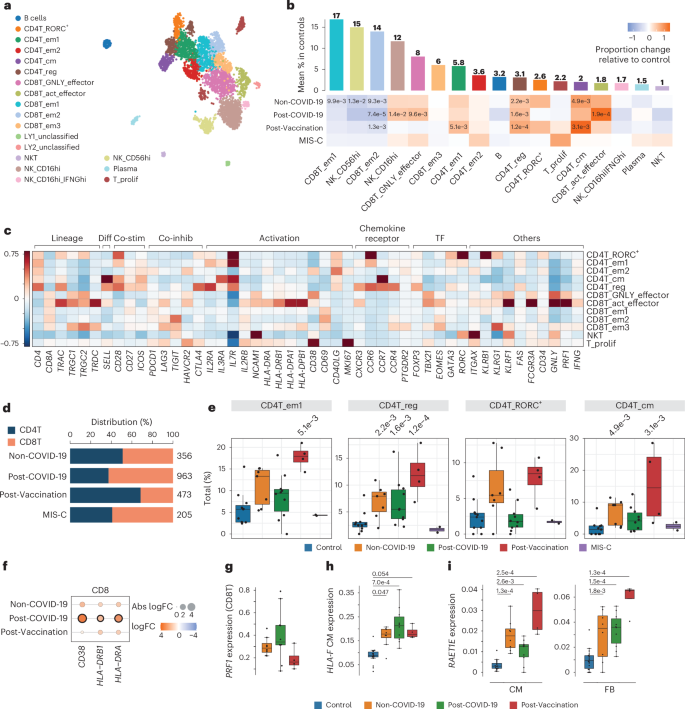
a, UMAP embedding of lymphoid cells delineated 19 lymphoid cell states. b, Upper panel, mean abundance (%) of lymphoid cell states in control left ventricles (n = 11). Lower panel, proportional changes of lymphoid cell states in Non-COVID-19 (n = 7), Post-COVID-19 (n = 9) and Post-Vaccination (n = 4). Color scale: red (increase) and blue (decrease). P values are indicated for significant proportional changes (FDR ≤ 0.05). P values were calculated using the two-sided t-test based on CLR-transformed values with Benjamini–Hochberg correction. For MIS-C, significance was not calculated due to low sample size (n = 2). Only samples with lymphoid counts greater than 30 were considered (Methods). c, Heatmap showing the z-score standardized expression of select marker genes (columns) per T cell cluster (rows). TF, transcription factor. d, Stacked bar chart indicating CD8T/CD4T ratios across conditions. n numbers are as described in b. e, Box plots showing distribution of CD4+ effector memory 1 (CD4T_em1), regulatory (CD4T_reg), RORC-expressing (CD4T_RORC+) and central memory (CD4T_cm) T cells. Significant P values (FDR ≤ 0.05) are shown. n numbers and P value calculations are as described in b. f, Dot plot showing differential expression of activation markers in pseudo-bulk CD8T cells across patient groups relative to control. Dot colors indicate log2-transformed FCs (log2FCs). Dot sizes indicate absolute log2FC. Black circles indicate significance (FDR ≤ 0.05). P values were calculated using the quasi-likelihood F-test with Benjamini–Hochberg correction. g, Box plots showing PRF1 snRNA-seq expression levels in pseudo-bulk CD8T cells from patient groups (Non-COVID-19: n = 7, Post-COVID-19: n = 10, Post-Vaccination: n = 4; see Methods, DEG analysis). P value calculations are as described in f. P values were FDR > 0.05. h,i, Box plots showing snRNA-seq pseudo-bulk expression levels of HLA-F in CMs (h) and of RAET1E in CMs (i) (left) and FBs (right) from patient and control groups (control: n = 18, Non-COVID-19: n = 8, Post-COVID-19: n = 10, Post-Vaccination: n = 4). Significant P values (FDR ≤ 0.05) are shown. P values were calculated as described in g. Box plots in e, g and h: Boxes show interquartile range (IQR); vertical bars indicate the median; and whiskers extend from minimum to maximum values. Dots show individual measurements per patient.
Source data
We explored our snRNA-seq data for transcriptional signatures that may suggest an impact of cytotoxic lymphocytes on non-immune cardiac cells. CD8+ T cells recognize and kill cells presenting perceived non-self-antigens via MHC-I molecules. Among cardiac non-immune cells, ECs showed the highest human leukocyte antigen (HLA) class I gene expression, whereas control CMs displayed barely detectable levels, consistent with previous findings30,31 (Extended Data Fig. 5d). Interestingly, in myocarditis, it was reported that MHC-I is upregulated on CMs and interstitial cells30. In our study, aggregated pseudo-bulk data of non-immune cardiac cells showed elevated, albeit not significant, HLA class I gene expression in disease conditions with higher levels in Post-COVID-19 (Extended Data Fig. 5e). In CMs, HLA-F was specifically upregulated across Non-COVID-19, Post-COVID-19 and Post-Vaccination conditions (Fig. 3h and Extended Data Fig. 5d). Additionally, in CMs and FBs, the MHC class I–like molecule RAET1E was particularly upregulated in Post-Vaccination (Fig. 3i and Extended Data Fig. 5f). RAET1E binds and activates NKG2D-expressing NK and CD8+ T cells, with RAET family members typically absent on normal cells but overexpressed under stress. This overexpression was reported to contribute to the development of autoimmunity32 and may be linked to an exacerbated inflammatory response.
Elevated HIF1A and VEGFA expression in CMs
Previous in vitro studies reported specific gene expression signatures after infecting induced pluripotent stem cell (iPSC)-derived CMs with SARS-CoV-2 (ref. 33). We did not observe a matching transcriptional response in our snRNA-seq CM data, neither in Post-COVID-19 patients nor in any other of the patient groups. Subclustering of the CM population identified previously reported cell states of the left ventricle13 (Fig. 4a,b, Extended Data Fig. 6a,b and Supplementary Tables 8 and 9) and one additional CM state (vCM6) that showed enrichment of genes related to regulation of heart rate by cardiac conduction (including, for example, CAMK2D, KCND3, CACNA2D1, CTNNA3 and CACNA1C). vCM6 proportions were more abundant in all patient groups, especially in Non-COVID-19 and Post-Vaccination (Fig. 4b and Extended Data Fig. 6a), whereas vCM5 proportions were increased only in Post-COVID-19. vCM5 was described to participate in the cardiac conduction system12. Increased risks of cardiac arrhythmias were observed after a positive SARS-CoV-2 test3,34.
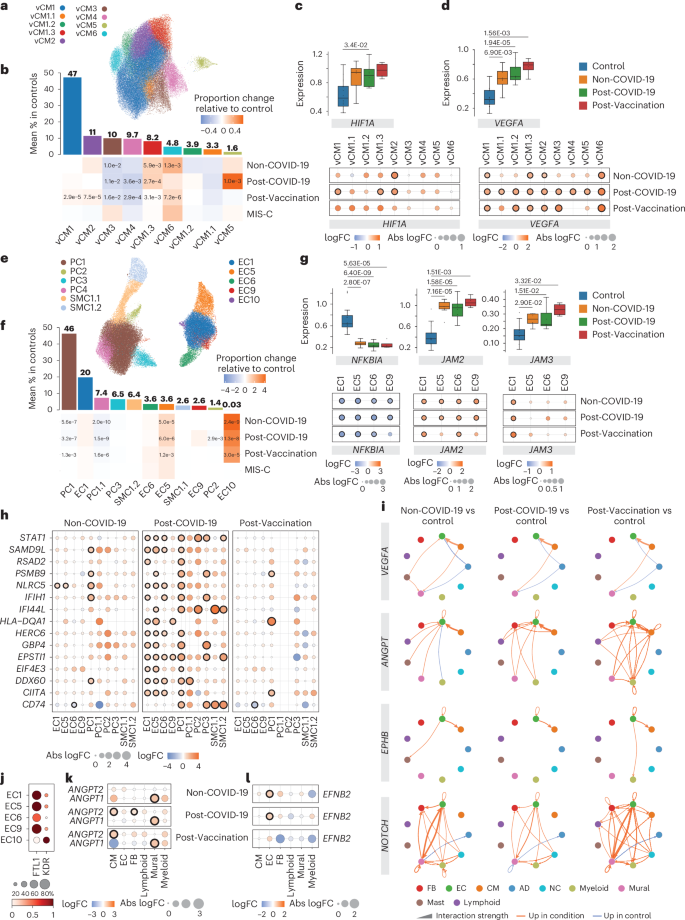
a, UMAP embedding delineated nine CM states. b, Upper panel, mean CM state abundances (%) in controls (n = 18). Lower panel, proportional changes of CM states in Non-COVID-19 (n = 8), Post-COVID-19 (n = 10) and Post-Vaccination (n = 4) versus control. Color scale: red (increase) and blue (decrease). Significant P values (FDR ≤ 0.05) are shown. P values were calculated with the two-sided t-test based on CLR-transformed values with Benjamini–Hochberg correction. MIS-C significance was not calculated due to low sample size (n = 2). c, Upper panel, box plots showing HIF1A snRNA-seq pseudo-bulk expression levels in CMs. Boxes depict the interquartile range (IQR); horizontal bars indicte the median; whiskers extend to 1.5× IQR; and dots show the value of each patient. Significant P values (FDR ≤ 0.05) are shown. Lower panel, dot plots showing differential expression of HIF1A in patient groups relative to control across CM states. Dot colors indicate log2-transformed FCs (log2FCs). Dot sizes indicate absolute log2FC. Black circles indicate significance (FDR ≤ 0.05). Upper and lower panel, control: n = 18, Non-COVID-19: n = 8, Post-COVID-19: n = 10, Post-Vaccination: n = 4. P values were calculated using the quasi-likelihood F-test with Benjamini–Hochberg correction. d, VEGFA expression in CMs, shown as described in c. e, UMAP embedding delineated 11 vascular cell states. f, Vascular cell state abundances shown as described in b. g, NFKBIA, JAM2 and JAM3 expression in ECs, shown as described in c. h, Dot plots showing differential expression of IFNγ response genes in patient groups relative to control across vascular cell states. Dot plots, n numbers and P value calculations are as described in c. i, Circle plots showing significant cell–cell communication differences for the indicated pathways (P ≤ 0.05) between patient groups and controls. P values were computed from the one-sided permutation test with Bonferoni correction. Line thickness reflects interaction strength of sending and receiving cells; color indicates changes (orange: increased; blue: decreased); and arrows show signal directionality. j, Dot plot showing FLT1 and KDR expression across EC states. Dot size corresponds to fraction (%) of expressing nuclei; color indicates scaled mean expression levels. k,l, ANGPT1 and ANGPT2 (k) and EFNB2 (l) expression in cell types as described in c. AD, adipocyte; NC, neural cell.
Source data
In CMs, we observed a significant upregulation of HIF1A in all patient groups compared to controls (Fig. 4c). HIF1A encodes the O2-regulated HIF1 subunit, and its expression can also be induced by various cytokines35. Local oxygen concentration in inflamed areas tends to decrease36. HIF1 functions as a master regulator of cellular and systemic homeostatic response to hypoxia, such as angiogenesis and vascular remodeling37. One notable HIF1A downstream target is the vascular endothelial growth factor A (VEGFA). Its product, VEGFA, is a powerful inducer of angiogenesis but can also induce vascular inflammation and increase vascular permeability38. VEGFA expression was upregulated in the overall CM population and across CM states in all patient groups (Fig. 4d).
Pro-angiogenic and inflammatory gene expression in vascular cells
Subclustering of vascular cells (ECs and mural cells) delineated previously characterized capillary (EC1), arterial (EC5) and venous (EC6) ECs as well as two SMC states (SMC1.1 and SMC1.2) and three PC states (PC1–3)13 (Fig. 4e,f, Extended Data Fig. 6c–i and Supplementary Tables 10 and 11). We identified one additional PC state (PC1.1) with enriched expression of genes with anti-angiogenic capacity, including ADAMTS9, ADAMTS1 and HIPK2, and two additional EC states, EC9 and EC10. EC9 was characterized by the expression of interferon-stimulated genes (ISGs). EC10 showed enriched expression of pro-angiogenic stem cell receptor KIT, SMAD1 and tip cell marker genes (including ANGPT2, PGF and PDGFB) (Extended Data Fig. 6e), similar to ECs previously described to promote cardiac repair after myocardial infarction39. We observed across all patient groups decreased canonical PC1 and anti-angiogenic PC1.1 proportions. In contrast, EC5 (arterial) proportions were strongly increased, and EC1 (capillary) and EC6 (venous) proportions were barely increased. This indicated altered vascular cell ratios in all patient groups. ISG-expressing EC9 cells were increased in Post-COVID-19. These cells showed the highest HLA class I gene expression among EC states (Extended Data Fig. 6j), suggesting that they may represent a preferential target for cytotoxic CD8+ T cells within the EC population. EC10 cells were almost exclusively found in the patient groups except in MIS-C (Fig. 4f and Extended Data Fig. 6c).
DEG analysis identified consistently decreased NFKBIA expression in ECs within all patient groups (Fig. 4g). NFKBIA encodes the IκBα repressor that counteracts the pro-inflammatory transcription factor NF-κB. We furthermore noted a consistent upregulation of the junctional adhesion molecules encoding genes JAM2 and JAM3 in ECs across all patient groups (Fig. 4g). JAM2 and JAM3 are known to facilitate the migration and extravasation of immune cells through the endothelium40. We then performed GSEA on DEGs per vascular cell state and observed upregulated gene sets related to IFNγ signaling in EC1, EC5 and EC6 as well as PC1 and PC3 from Post-COVID-19 patients (Fig. 4h).
Elevated angiogenesis-associated intercellular communication
By examining the expression of genes encoding for receptors and ligands, we inferred cell–cell communication using CellChat and detected increased VEGFA signaling from CMs to ECs in all patient groups (Fig. 4i). VEGFA promotes angiogenesis and vascular permeability primarily through its receptor VEGFR2 (KDR). Alternatively, it can bind to its decoy receptor VEGFR1 (FLT1), thus fine-tuning the angiogenic process and ensuring vascular quiescence and stability41.
Compared to other EC states, KDR showed highest and FLT1 lower expression in EC10 (Fig. 4j), suggesting increased responsiveness to VEGFA. EC activation by VEGFA leads to formation of tip cell filopodia and facilitates migration, proliferation and survival42. Gene Ontology (GO) term analysis on genes expressed in EC10 indeed resulted in the identification of related terms (Extended Data Fig. 6k,l).
CellChat analyses furthermore identified increased angiogenesis-related angiopoietin (ANGPT), ephrin B (EPHB) and NOTCH signaling in all patient groups (Fig. 4i). Angiopoetin ligand ANGPT1 stabilizes vessels, and ANGPT2 is a VEGFA-dependent modulator of capillary structures and EC survival43. CellChat analyses predicted enhanced signaling of ANGPT1 from CMs and of ANGPT2 from mural cells to ECs (Extended Data Fig. 6m). ANGPT1 and ANGPT2 expression was increased in CMs and mural cells, respectively, across all patient groups (Fig. 4k). Ephrin B ligands and their Eph receptors play important roles in vessel growth and stabilization44. Expression of EFNB2, encoding a EPHB signaling ligand, was upregulated in ECs (Fig. 4l), and CellChat analyses predicted induction of autocrine signaling in ECs and increased signaling to CMs, where EFNB2 signaling was shown to play a protective role45. Furthermore, predicted EFNB2–EPHB1 ligand–receptor interactions identified in controls were shifted to EFNB2–EPHA4 in the patient groups (Extended Data Fig. 6n). Activation of EPHA4 in ECs was shown to increase monocyte adhesion46 and limit arteriogenesis through attenuated ANGPT2/Tie2 signaling47. NOTCH signaling plays a crucial role in regulating smooth muscle differentiation and blood vessel formation. In addition to increased NOTCH signaling between ECs and mural cells, CellChat inference suggested enhanced autocrine signaling in ECs that can be activated by disturbed blood flow48. Furthermore, signaling to myeloids was increased (Fig. 4i and Extended Data Fig. 6m) in line with the recent implication of NOTCH signaling in macrophage activation and differentiation49.
Fibrosis-associated gene expression profiles
Previous studies reported histopathological findings of fibrosis for post-COVID-19-associated as well as post-vaccination-associated myocarditis7. In our patient groups, cardiac MRI showed an increase in late gadolinium enhancement (LGE), which may be a sign of fibrosis development or represents an effect of the increased inflammatory reaction (Extended Data Table 1). snRNA-seq analyses of EMBs did not show a significant increase of total FB numbers (Fig. 1d) but increased collagen gene expression in patient groups compared to control (Fig. 5a). This implied the acquisition of a secretory rather than a proliferative phenotype, as previously observed in dilated cardiomyopathy13. Condition-split visualization of the FB latent space supported a transcriptional shift in FB states across patient groups (Extended Data Fig. 7a). Subclustering of FBs identified previously described states (vFB1–4) and one additional state (vFB5) characterized by increased IFN response gene expression (Fig. 5b, Extended Data Fig. 7b,c and Supplementary Tables 12 and 13). vFB1.1 (lipofibroblast) and vFB3 (interacting with MP_OSM+) proportions were significantly decreased, whereas vFB4 (extracellular matrix (ECM)-organizing) and vFB5 abundances were increased in all patient groups compared to controls. Interestingly, vFB2 (pro-fibrotic TGFβ-activated) expanded in Non-COVID-19 and Post-COVID-19 but not in Post-Vaccination (Fig. 5c and Extended Data Fig. 7b). GSEA revealed upregulation of IFNγ-stimulated and IFNα-stimulated genes in vFB1.0 and vFB5 in Post-COVID-19 (Extended Data Fig. 7d and Supplementary Table 3). Of note, in MIS-C, vFB2 was not only expanded the most (Extended Data Fig. 7b) but was additionally activated by TGFβ (Extended Data Fig. 7e), suggesting a more pronounced fibrotic response compared to the other patient groups.
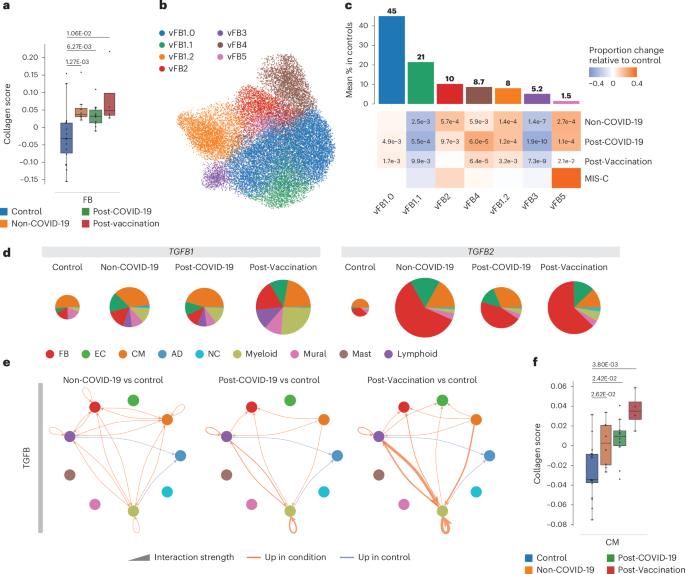
a, Collagen scores across FBs in controls (n = 18), Non-COVID-19 (n = 8), Post-COVID-19 (n = 10) and Post-Vaccination (n = 4). Scores were calculated across all expressed collagens. Boxes depict the interquartile range (IQR); horizontal bars indicate the median; whiskers extend to 1.5× IQR; and dots show the value of each patient. P values were calculated using the two-sided Wilcoxon rank-sum test and were adjusted for multiple testing (Bonferoni correction). b, UMAP embedding delineated seven FB states. c, Upper panel, mean abundance (%) of FB states in control left ventricles (n = 18). Lower panel, proportional changes of FB states in the four patient groups (Non-COVID-19: n = 8, Post-COVID-19: n = 10, Post-Vaccination: n = 4). Proportional changes are scaled by color: red (increase) and blue (decrease) in disease versus control. P values are indicated for significant proportional changes (FDR ≤ 0.05). P values were calculated using the two-sided t-test based on CLR-transformed values with Benjamini–Hochberg correction. For MIS-C, significance was not calculated due to low sample size (n = 2). d, Pie charts comparing cell type resolved mean absolute expression levels of TGFB1 and TGFB2. The pie size reflects absolute detection levels; the colors indicate the relative contribution per cell type. Colors indicate cell types; color legend is as in g. e, Circle plot representations of significantly differential interactions of cell–cell communication for the TGFB pathway (adjusted P ≤ 0.05) in patient groups compared to control. P values were computed with the one-sided permutation test. The line thickness represents the interaction strength of signals from sending and receiving cells. Color is scaled from zero to maximum in disease versus controls (orange, increased; blue, decreased). The directionality of the signal is indicated with arrows. f, Collagen scores across CMs and ECs are as described in a. AD, adipocyte; NC, neural cell.
Source data
In cardiac tissue, we detected increased expression of TGFB1 (Fig. 1f) and TGFB2 (Extended Data Fig. 7f) encoding TGFB signaling ligands and alterations in their cellular sources of expression across all patient groups compared to controls (Fig. 5d). Myeloid and lymphoid cells contributed greater to the overall TGFB1 expression levels, particularly myeloid cells in Post-Vaccination and MIS-C and FBs and ECs to the overall TGFB2 expression levels (Fig. 5d). CellChat analysis suggested upregulated TGFB signaling in all patient groups toward FBs and myeloid and lymphoid cells and additionally to CMs in Non-COVID-19 or to ECs in Post-Vaccination (Fig. 5e). Signaling toward immune cells was especially enhanced in Post-Vaccination. Because of the observed TGFB signaling toward CMs in Non-COVID-19 and ECs in Post-Vaccination, we investigated collagen gene expression in these cell types (Fig. 5h). Although FBs showed the highest expression (Fig. 5a), collagen gene expression was indeed upregulated in CMs (Fig. 5h), suggesting that, besides FBs, there are additional cellular sources for fibrotic gene expression responses.
Discussion
Our current understanding of the cellular and molecular response mechanisms in cardiac inflammation is mainly based on immunohistochemistry findings in EMBs and studies of autopsy heart tissue samples2,9,15. Here we provided single-cell resolved analyses in human EMBs taken during the acute phase of disease from patients with non-COVID-19 lymphocytic myocarditis, myocarditis after SARS-CoV-2 infection and myocarditis after COVID-19 vaccination.
Our results highlighted an important role of IFNG expressed in lymphoid cells of post-COVID-19 heart tissue, reflected in ISG expression patterns in multiple cell types and states, and identified upregulated IL16 and IL18 expression as hallmarks of post-vaccination myocardial inflammation. This was consistent with previous studies in other organs demonstrating pathogenic IFNγ secretion by recruited T cells and NK cells during SARS-CoV-2 infection50 and increased IL16 and 18 serum/plasma levels in anti-COVID-19 mRNA-vaccine-related myocarditis/pericarditis7,18. We found these cytokines also expressed during the inflammatory processes within the cardiac microenvironment and, furthermore, noticed differences in the expression of immunosuppressive cytokines, such as TGFB1 and IL34, between groups. These findings suggest a stronger immune response in post-COVID-19 and a more dampened response in post-vaccination myocardial inflammation, further supported by downstream analyses of individual cell types.
Previous studies showed high amounts of CD68+ macrophages in cardiac tissue of patients who died or developed myocarditis after SARS-CoV-2 infection or vaccination2. In our cohort, both immunohistochemistry and snRNA-seq consistently showed significant expansion of the myeloid cell population. Additionally, snRNA-seq revealed profound compositional changes, including a loss of resident macrophages and an increase in monocytes and monocyte-derived macrophages. These alterations mirrored observations in mice where cardiac injury, myocarditis and stress-induced cardiomyopathy resulted in replacement of resident macrophages by inflammatory monocyte-derived macrophages51,52,53. Notably, the myeloid compositional changes were similar across Non-COVID-19, Post-COVID-19 and Post-Vaccination groups, suggesting that these responses are non-specific.
Among cardiac myeloid states, we did not detect pro-fibrotic transcriptomic signatures as reported for the lungs of patients with COVID-19 or the blood of patients with perimyocarditis after vaccination7. However, Post-COVID-19 patients showed pronounced ISG expression in multiple cardiac myeloid states, which suggested augmented inflammatory activity54 and was linked to increased stimulation of T cell responses55. Additionally, we noted a loss of tissue repair macrophages, such as Lyve1hiMHCIIlo macrophages, which are critical for repair processes. This shift toward pro-inflammatory macrophages, potentially leading to excessive activation of the adaptive immune system at the expense of repair functions, may contribute to cardiac damage.
Although our observation of macrophage expansion was consistent among snRNA-seq, immunohistochemistry and previous reports, T cell abundances, as determined by the detection of CD3+ cells in immunohistochemistry, differed from snRNA-seq. snRNA-seq analyses identified transcriptional profiles corresponding to individual T cells, with abundances in post-COVID-19 and post-vaccination myocarditis similar to those observed in non-COVID-19 lymphocytic myocarditis. Notably, Non-COVID-19 patients were specifically selected based on prior confirmed lymphocytic infiltrations using immunohistochemical detection of CD3+ T cells. The sensitivity to detect specific lymphocytic infiltrates by immunohistochemistry is estimated to be only up to 40%56. Our data raise the question of whether snRNA-seq may be more sensitive than traditional approaches.
The analysis of snRNA-seq-identified lymphocytes showed increased CD4+ to CD8+ T cell ratios, fewer activated NK cells and a weaker cytotoxic profile of CD8 T cells post-vaccination compared to post-COVID-19. Although a dominance of cardiac CD4+ lymphocytic infiltrates in response to the vaccination was described previously2,11, we here show that this aligns with the elevated expression of IL16, a cytokine that governs trafficking and biological properties of CD4+ T cells57. In Post-COVID-19 patients, we identified significantly enriched highly activated CD16+CD8+ T cells (CD8T_act_effector), not previously reported for cardiac inflammatory responses. Similar T cells in blood from patients with severe COVID-19 were described to be capable of immune-complex-mediated, T cell receptor–independent degranulation and cytotoxicity promoting microvascular EC injury29. These findings suggest an over-aggressive cytotoxic lymphocyte response in Post-COVID-19 cardiac tissue in contrast with the more attenuated inflammatory processes in Post-Vaccination patients.
Across patient groups, we found evidence for an inflammatory status of the vasculature, such as heightened expression of JAM2 and JAM3, encoding leukocyte adhesion molecules, and reduced NF-κB inhibitor NFKBIA expression, suggesting heightened pro-inflammatory NF-κB signaling. Post-COVID-19 patients additionally exhibited a distinct IFNγ response gene signature in ECs. In hamsters, lung ECs respond to SARS-CoV-2 infection with strong transcriptional pro-inflammatory chemokine responses without evidence for their direct infection58. Human cardiac Post-COVID-19 ECs displayed ISG expression patterns similar to those observed in hamster lungs. Vascular permeabilization, endothelial injury and chronic vascular inflammation are central aspects in COVID-19 (ref. 59). The known role of IFNγ in regulating endothelial monolayer permeability further supports the presence of endothelial barrier dysfunction in the hearts of these patients.
Increased overall EC abundances, identification of pro-angiogenic tip cells and predicted elevated pro-angiogenic signaling indicated ongoing angiogenesis across patient groups. Similarly, angiogenesis was reported for parvovirus B19–associated myocarditis60, potentially aiding in restoring blood supply to affected areas. However, alterations in EC state ratios with a particular shift toward arterial ECs and a decrease in overall mural cell abundances as observed in our cohort may affect vascular network function and maturation. Our findings highlight the need for further investigation of the intricate equilibrium between angiogenesis and inflammation and its implications for cardiac inflammatory pathology.
Overall FB populations were not expanded, but FB states were shifted toward activated vFB2, indicating an acquired secretory phenotype in all patient groups except Post-Vaccination. Interestingly, signs of vFB2 hyperactivation, as identified in end-stage failing human hearts13, were observed only in patients with MIS-C, who also exhibited the highest ECM gene expression activity despite their young age. The responses within the FB population were generally less pronounced in Non-COVID-19, Post-COVID19 and Post-Vaccination compared to those in end-stage dilated cardiomyopathy failing hearts13.
Limitations of our study
We would like to emphasise that the EMBs analyzed in this study are extremely difficult to obtain, leading to limited group sizes. However, we employed advanced, state-of-the-art statistical methods suited to effectively manage small sample sizes. Additionally, the patients in this study represent a clinically heterogeneous group, varying in the onset, degree of clinical symptoms and diagnostic evidence. Non-COVID-19 lymphocytic myocarditis cases were selected to clinically match the other disease groups, excluding fulminant myocarditis cases to align with the mild symptoms typical of COVID-19 myocarditis. However, this selection may influence the comparison.
We also cannot determine whether our findings are influenced by differences in the timespan between infection/vaccination and the patient’s hospital admission. On a technical note, we compared EMBs to transmural donor heart controls, as obtaining EMBs from healthy, age-matched controls is impossible, which may affect the sampling of specific cell types. Furthermore, CLR transformation of snRNA-seq data was used to analyze relative compositional changes in cardiac cell types. This method cannot capture absolute values. In contexts like tissue inflammation, where shifts in cell counts are of additional relevance, relative abundance may not fully capture all aspects of the pathology.
Future studies are needed to trace long-term consequences of the here-described changes observed during the acute phase of cardiac inflammation. We expect that our data will advance mechanistic studies to improve treatment and enable preventive strategies and better diagnosis of post-COVID-19 and post-vaccination inflammatory cardiomyopathies.
Methods
Patients and ethics statement
This study complies with all ethical regulations associated with human tissue research. Acquisition and use of samples was approved by the Ethics Committee of Berlin and the Ethics Committee of the Charité – Universitätsmedizin Berlin (institutional review board approval numbers EA2/140/16 and EA2/066/20) and conducted in accordance with the Declaration of Helsinki. All subjects gave their written informed consent for their tissues to be collected for research purposes and the data obtained from that research to be published. All patients underwent LV EMB and left heart catheterization after routine non-invasive diagnostic workup and angiography had excluded any specific cause of heart-failure-like symptoms. All EMBs were evaluated histologically and by immunohistochemical stains as well as performing molecular analysis (RT–PCR) for cardiotropic viral genome detection (adenovirus, enteroviruses, human herpes virus 6 (HHV6), parvovirus B19, Epstein–Barr virus and SARS-CoV2) by the Department of Cardiopathology, Institute for Pathology and Neuropathology, University of Tübingen, Germany. Clinical information for the cardiac tissue is available in Extended Data Table 1.
Cohort samples
Disease samples were collected via LV EMBs from patients with ‘classical’ lymphocytic myocarditis (Non-COVID-19, n = 8), patients who clinically recovered from COVID-19 but showed persisting cardiac symptoms indicative of cardiac inflammation (Post-COVID-19, n = 10) and patients with cardiac symptoms indicative of cardiac inflammation after vaccination against SARS-CoV-2 (Post-Vaccination, n = 4). In addition, we investigated EMBs from patients diagnosed with MIS-C and indicative of cardiac inflammation as well as a follow-up EMB for one of the patients with MIS-C after treatment (MIS-C follow-up). All patients presented with symptoms including chest pain, palpitations, fever, shortness of breath, malaise and/or general weakness and fatigue and an overall increase of cardiac damage-indicating biomarkers (troponin T, NT-pro-BNP, creatine kinase or creatine kinase MB) and CRP levels (Fig. 1a). ECG, echocardiography or signs of recent or ongoing myocardial damage on cardiac MRI ranged from normal or non-specific to borderline low or abnormal and are summarized in Extended Data Table 1. All patients underwent LV EMBs and left heart catheterization after routine non-invasive diagnostic workup and angiography had failed to elucidate any other specific cause of heart failure, such as coronary artery disease.
Patients in the Post-COVID-19 and MIS-C groups were previously tested positive for SARS-CoV-2 infection by nasopharyngeal swap test PCR but tested negative at the timepoint of the actual study. Healthy heart snRNA-seq data were recently generated by us using LV free wall and apical samples from 18 unused donor hearts12,13. Cell composition, states and transcript counts across the free wall and apex showed high similarities13 and, therefore, are reported grouped together as LV.
EMB immunhistochemistry
EMBs were fixed in 4% phosphate-buffered formaldehyde and embedded in paraffin. Four-micrometer-thick tissue sections were stained with hematoxylin and eosin and examined by light microscopy. For immunohistological detection of cardiac immune cells, a monoclonal rabbit-anti-CD3 antibody (Novocastra Laboratories, clone SP7, 1:500), a monoclonal mouse anti-human CD68 antibody (DAKO, clone PG-M1, 1:50), a monoclonal rabbit anti-CD4 (Zytomed, clone SP35, 1:50) and a monoclonal mouse anti-CD8 (DAKO, clone C8/144B 1:300) were used. Immunohistochemical analysis was performed on an automated immunostainer following the manufacturer’s protocol (Ventana Medical Systems, Benchmark) and using the ultraView detection system (Ventana Medical Systems) and diaminobenzidine as substrate. Tissue sections were counterstained with hematoxylin. Positive cells were counted using an Axioskop 40 (Zeiss) microscope, and results are given per mm2. Representative pictures are shown at ×200 magnification.
Isolation of cardiac single nuclei from EMBs and processing on the 10x Genomics platform
The isolation of cardiac nuclei and the 10x library preparation were performed at the Max Delbrück Center for Molecular Medicine following our published protocol61 with adaptations to low-sized tissue pieces. Next, 1–4-mg-sized flash-frozen cardiac biopsies were placed in a pre-cooled dish and an equally sized droplet of homogenization buffer (250 mM sucrose, 25 mM KCl, 5 mM MgCl2, 10 mM Tris-HCl, 1 μM DTT, 1× protease inhibitor, 0.4 U μl−1 RNaseIn, 0.2 U μl−1 SUPERaseIn and 0.1% Triton X-100 in nuclease-free water) was added. Buffer-encapsulated tissue pieces were sliced with a scalpel. The tissue pieces were then transferred to a 7-ml glass Dounce tissue grinder (Merck), and nuclei were isolated and stained with NucBlue Live ReadyProbes Reagent (Thermo Fisher Scientific). Hoechst+ single nuclei were sorted via fluorescence-activated cell sorting (FACS) (BD Biosciences, FACSAria Fusion). The forward scatter (FSC)/side scatter (SSC) gating strategy is shown in Supplementary Fig. 1. Purity and integrity of nuclei were confirmed microscopically, and nuclei numbers were counted using a Countess II (Life Technologies) before processing with the Chromium Controller (10x Genomics) per the manufacturer’s protocol. Single-nucleus 3′ gene expression libraries were created using version 3.1 Chromium Single Cell Reagent Kits (10x Genomics) following the manufacturerʼs instructions. cDNA library quality control was performed using Bioanalyzer High Sensitivity DNA Analysis (Agilent Technologies) and a KAPA Library Quantification Kit. cDNA libraries were sequenced on an Illumina NovaSeq with a targeted read number of 30,000–50,000 reads per nucleus (Supplementary Fig. 1b–d).
Sequencing data pre-processing and transcriptome mapping
The binary base call (BCL) sequence files were converted to FASTQ format using bcl2fastq (version 2.20). Mapping of sequencing reads from each sample to a modified pre-mRNA version of the human reference genome (version GRCh38, .gtf file from Ensembl release 84) was performed using the Cell Ranger suite (version 3.0.2). The Cell Ranger reference file was created following the instructions from the 10x Genomics website (https://www.10xgenomics.com/support/single-cell-gene-expression) and the specifications provided in the DCMheart GitHub repository (https://github.com/heiniglab/DCM_heart_cell_atlas/)13. Reads mapping to exonic and intronic regions were counted. Sequencing mapping quality was assessed using Cell Ranger summary statistics. Reads mapping multiple genome features were discarded.
Count data and data matrix annotation
The identification of empty droplets was performed using emptyDrops, implemented in the Cell Ranger workflow. The filtered_feature_bc_matrix.h5 files and the metadata information were integrated into an annotated data object (AnnData).
Annotated data quality control, batch correction and clustering
Quality control and downstream analyses of the concatenated annotated matrices were performed using the Single-Cell Analysis in Python toolkit Scanpy (version 1.5.1)62,63. Doublet identification and removal was performed using Solo (version 0.3)64. Scrublet scores with prior log transformation were used as an independent doublet detection and filtering method (version 0.2.1)65. Nuclei with n_counts (≤300), genes (300 ≤ n_genes ≤ 5,000), mitochondrial genes (≤1%), ribosomal genes (percent_ribo ≤ 1%) and softmax Solo scores (≤0.5) were excluded from downstream analyses.
Normalized and log-transformed read counts were used to identify highly variable genes. The data were corrected and scaled to unit variance to account for the effects of the percentage of mitochondrial genes expressed. To select the principal axes of variation, denoise the data and compute the neighborhood relations of cells, a dimensionality reduction using principal component analysis (PCA) and the elbow methods were used. To remove potential batch effects within our data, before the dimensionality reduction using the UMAP method, principal components were adjusted using Harmony66 with ‘Patient’ as batch_key. Clustering of nuclei using the community detection based on optimizing the modularity algorithm Leiden67,68 was performed. Next, differential gene expression analyses were performed using the two-sided Wilcoxon rank-sum test, and clusters displaying low differences in their gene expression profiles were merged. Nuclei were assigned to cell types and posteriorly subclustered to identify cell states. The cell state annotation step revealed nuclei, denoted as unassigned in Fig. 1c (n = 11,832 ‘Nuclei’; 5.8%), that correspond to droplets with chimeric transcriptional profiles. Whether these droplets represent true data, background noise or multiplets is unclear.
Differential gene expression analysis
DEGs per cell type and state were calculated using the two-sided Wilcoxon rank-sum test as implemented in Scanpy62. Testing for DEGs was done using log-transformed and normalized to library size count values. Only genes with mean expression greater than 0.0125 were considered. Genes with a false discovery rate (FDR) < 0.05 and absolute log2 fold change (FC) > 0.5 were considered differentially expressed. For rare cell states (≤3 samples with ≤5 nuclei), DEG differences were not calculated.
To identify disease-specific expression profiles, DEG analyses were performed between control and myocarditis groups. For this, transcript counts per gene of all nuclei for a given sample (tissue level), cluster (cell type level) or subcluster (state level) from the same individual were aggregated to create ‘pseudo-bulk’ samples. Testing for DEGs in pseudo-bulks was performed using the empirical Bayes quasi-likelihood F-test function (glmQLFtest) available in the R package edgeR (version 3.28.1)69,70.
Compositional analysis
To identify disease-specific changes in the proportion of cells between control and disease groups, a CLR-based approach excluding unassigned nuclei was used13 to account for the compositional nature of the data. For this, count data were transformed using CLR transformation. Zeros in the data, assumed to result from insufficient sampling depth, were imputed using the multiplicative replacement method71. Statistical differences between disease groups and controls were assessed by fitting a linear model to the CLR-transformed values, with the group encoded as an indicator variable. Significance was determined using a two-sided t-test on the regression coefficient. Differential abundance of all cell types or states was analyzed separately for each disease group compared to controls. For cell state analyses within each cell type, only the counts assigned to that specific cell type were considered, effectively normalizing cell states within each type to 100%. Samples with fewer than 10 cells per cell type were excluded from the cell state analysis. For analysis of lymphoid state abundances, samples with fewer than 30 total lymphoid cells were excluded.
In addition to CLR values, abundance differences were expressed as the mean percentage differences between groups, and statistical significance was determined from the CLR-transformed values. Positive values indicate higher abundance in the disease group. P values were adjusted for multiple testing using the Benjamini–Hochberg method, and only significant results are reported.
EC_PKHD1L1+ comprised mostly endocardial (EC7) and few lymphatic (EC8) ECs (Supplementary Fig. 2b). We noticed that controls barely, and EMB samples to a variable extent, contributed to this cluster, likely due to a sampling bias when collecting EMBs compared to transmural sections (Supplementary Fig. 2b). We, therefore, decided to exclude EC_PKHD1L1+ from analyses where amounts may influence results.
At this point, samples with fewer than 10 nuclei per cell type were excluded from the analyses. To calculate compositional differences of lymphocyte states, only samples with a minimum of 30 nuclei were included to account for the high cellular heterogeneity within the lymphoid cell population. Differences in mean percentages between groups were reported using the statistical significance obtained in the CLR step. For interpretation, disease groups with positive values suggest an increase in abundance. Benjamini–Hochberg correction for multiple testing was applied (only significant results are shown).
GO enrichment analysis and GSEA
GO and GSEA analyses72,73 were performed using GSEApy version 0.10.5—a Python implementation for Enrichr with default settings74. GO analyses were performed with the gene set libraries ‘GO_Biological_Process_2021’ and ‘KEGG_2021_Human’, and DEGs identified per cell type or state were used as input. GSEAs were performed with the collections of gene sets in the Molecular Signatures Database ‘MSigDB_Hallmark_2020’, and DEGs identified per condition on the tissue, cell type or cell state level, respectively, were used as input. Gene background was defined using all genes that were expressed in the given cell type or cell state (mean expression > 0.0125).
Gene set score enrichment
The score_genes functionality implemented in Scanpy was used on log-transformed and scaled transcript counts to compute enrichment of individual gene sets62. The MHC-I score was based on the expression of MHC-I genes in aggregated non-immune cardiac cells (excluding lymphoids, myeloids and mast cells as well as unassigned, EC_PKHD1L1+, adipocytes and neural cells). The collagen score was based on all expressed collagens per cell type. TGFB activation score was based on a list of genes curated from ref. 75 with logFC > 0.7 and FDR < 0.05. The cytotoxic76 and cytotoxic cytokine77 scores were calculated using Seurat’s (version 5.1) AddModuleScore function78 on the log-transformed and normalized counts from aggregated CD4+ or CD8+ T cells. Patients with fewer than five CD4+ or CD8+ T cells were excluded from the analysis.
Intercellular signaling cross-talk and differential cell–cell interaction network analysis
To infer, visualize and analyze intercellular communication among all assigned cell types and cell states, we used CellChat, an open-source R package (version 1.6.1, http://www.cellchat.org/cellchatdb/)79. We first excluded genes expressed in less than 1% of the nuclei per cell state before running CellChat. We then used the CellChat database (http://www.cellchat.org/cellchatdb/) and log-transformed normalized gene counts to identify and select overexpressed signaling genes (default parameters). Due to the differences in abundances across cell states, we computed the communication probabilities considering the cell state’s population size. We excluded cell–cell communication if a cell state had fewer than 10 nuclei. The communication probabilities on signaling pathways were filtered using P ≤ 0.05. We used network centrality measures in all inferred pathway communication networks (default parameters) to identify cell states that act as dominant senders, receivers, mediators and influencers. We compared the differences in the results obtained for cell–cell interactions from control and medical conditions to highlight significant changes.
Pathway-specific differences in interaction strength between control and diseases across cell types were calculated using the communication probabilities per cell state and CellChat’s aggregateNet() function. We then aggregated the communication probabilities per cell state from the same cell type using the mergeInteractions() and plotted these data using netVisual_diffInteraction() CellChat functions.
Statistics and reproducibility
Replicates and statistical tests are described in the figure legends. Sample sizes were not predetermined using statistical methods. No sample size calculations were performed. Sample size was governed by tissue availability, and input tissue mass was on the basis of endomyocardial biopsy size. No samples were excluded. All snRNA-seq analyses including clustering were done using unbiased techniques. Investigators were blinded to the groups when performing initial analyses.
Reporting summary
Further information on research design is available in the Nature Portfolio Reporting Summary linked to this article.
Responses