The decreasing housing utilization efficiency in China’s cities
Main
The transition of China’s urban housing into the era of commodification began at the end of 1998 following the abolition of the welfare-oriented allocation system. After several years of development, China’s commercial urban housing entered its first boom period after 20051. Statistical data published by the National Bureau of Statistics of China show that the annual growth of newly constructed urban housing areas in China reached 660 km2 between 2005 and 2007, which is approximately equal to half the urbanized area of Shanghai in the year 2020 (https://www.stats.gov.cn/sj/ndsj/). Meanwhile, the urban population that can be accommodated by these newly constructed urban housing areas was—according to the per capita housing area at that time—10% higher than that of the de facto increased urban population. This, in turn, means that oversupply was generated by newly constructed urban housing during this time period.
Around the year 2010, China’s commercial urban housing entered its second, more pronounced boom period2. Statistical data show that 7.4 million additional urban flats were built annually between 2011 and 2016. Although lower, between 2017 and 2021 still 6.4 million new flats were built per year (https://www.stats.gov.cn/sj/ndsj/). According to a preliminary estimate derived from the aforementioned housing growth trends, the yearly oversupply of newly constructed urban housing increased from 10% to 20% after 2011.
In the course of the highly dynamic urbanization process in China3, the particular phenomenon of overprovision of housing and building structures has created a unique phenomenon commonly referred to as China’s ‘ghost cities’4. This phenomenon gained widespread media attention around 2010, which coincided with the second boom period in China’s commercial urban housing5. While this phenomenon of developments or neighborhoods being almost completely vacant is dramatic and well documented, it accounts for only a very small part of the whole urbanized area6. In reality, underutilization of urban living space is a much more frequent phenomenon than complete vacancy (or severe under capacity), especially at the newly developed urban areas7. The housing vacancy rate (HVR), which quantifies the proportion of vacant housing, is commonly considered the appropriate indicator for measuring the difference between supply and demand of urban housing8.
Traditional investigations on HVRs are typically conducted through household surveys, which demand notable human and financial resources. Usually, these efforts are coordinated by government departments, such as the Bureau of the Census within the US Department of Commerce9. In China, although some statistical indicators released by the National Bureau of Statistics of China relate to urban housing, they mainly refer to its inventory or increment at the national level. There is no specific official statistic or even a standardized definition for China’s HVR10. Thus, to enhance knowledge about the discrepancy between urban housing supply and demand, new efforts for assessing the HVR are in demand.
With the development of remote sensing products and the widespread utilization of various emerging big data, studies on assessing urban housing supply and demand gradually emerged in recent years. Initially, the HVR was directly represented through human activities measured by various emerging big data. For instance, Chen et al.11 first sampled and averaged nighttime light intensity within urban grids representing fully utilized urban housing areas, and then they related this intensity to other urban grids to assess their HVRs. Some subsequent studies likewise adopted this framework. For instance, Wang et al.12 estimated the HVRs of metropolitan areas in the United States and China by using nighttime light data captured by the Visible Infrared Imaging Radiometer Suite (VIIRS) aboard the National Polar-orbiting Partnership (NPP) satellite system, supplemented by open street map and building data; Tan et al.13 and Yang and Pan14 estimated the HVRs of some selected urban areas by using Luojia-1 nighttime light data or point of interest data (or building data), which feature higher spatial resolutions.
Estimating HVRs directly according to human activities relies on empirical models and lacks theoretical foundation. In fact, the accuracy of these estimations leaves uncertainties. Thus, recent studies have attempted to represent the HVR by examining the gap between the population capacity and the actual population within specific spatial units. For instance, Shi et al.15 estimated the population capacity and the actual population of each residential block of Guiyang. They used emerging data from various sources and mapped the HVRs at the block level. This shift in understanding and estimation of the HVR was embraced in subsequent studies. For instance, Yue et al.16 and Li and Gong17 respectively estimated the population capacity and the actual population of Guangzhou and Beijing at the residential block level and applied the gap analysis. In addition, some recent studies tried to explore the dynamics of HVRs across larger areas. However, these studies remained at a comparatively low spatial resolution, that is, at the city or district level18,19.
In general, a trade-off is evident among the spatial resolutions, the research scale and the temporal period of monitoring within existing studies. Studies investigating HVRs at the block or even building level were conducted primarily within single cities and were conducted at only one time step. Conversely, studies investigating HVRs at regional scales of multiple temporal phases were mainly realized at the district or city scale or at coarse grid levels. Moreover, while the HVR is often regarded as the most representative indicator of urban housing supply and demand, accurately monitoring vacant housing units remains a challenge with current emerging big data.
Against this background, this study aims to narrow research gaps by the following three key aspects: (1) adopting housing utilization efficiency (HUE) as an indicator replacing the traditional HVR in the assessment of urban housing supply and demand (it is defined as the ratio of actual population to population capacity within specific spatial units); (2) developing a framework to measure HUEs across China in a multitemporal setting, that is, here for the years 2010 and 2020, and to perform the analysis at the subdistrict level by using multiple emerging big data; (3) analyzing the spatiotemporal evolution of China’s urban HUEs between 2010 and 2020 at multiple scales, including the subdistrict, city and region levels.
Results
The general trends in the evolution of HUEs across China
We found that the HUEs in the 108 selected cities across China decreased from 2010 to 2020, that is, the phenomenon of underutilization increased. The HUEs across China were estimated at 84% in 2010 and decreased to 78% in the decade to 2020 (Table 1). It is interesting to note that the average household size has noticeably decreased from 2010 to 2020. If the average household size in 2020 had remained the same as in 2010, the HUE in 2020 would have even decreased to 69%.
Among cities of different tiers, first-tier cities experienced the slowest growth in both, urban population and urban housing, while second-tier cities have been identified with the fastest trend of growth. Cities in the third tier and fourth tier were measured with higher dynamics than first-tier cities but lower dynamics than second-tier cities.
The HUEs of cities of different tiers generally followed two evolving trends between 2010 and 2020: (1) cities in higher tiers (that is, the first and second tiers) exhibited higher HUEs, with a decrease as the tier lowered; (2) the HUEs of cities in all tiers displayed a decreasing trend, and the extent of decline increased with lower tiers. We found the average HUE of fourth-tier cities in 2020 reached the lowest value at only 70%. Thus, the oversupply of urban housing was particularly serious in low tier cities.
Regional differences of HUEs across China
Just like for the sizes of the cities, there are also regional differences in terms of HUEs in China (Fig. 1). In 2010, cities in the southeastern coastal area of China featured the highest HUEs, generally above 85%. Following this, cities in the Yangtze River Delta region, certain areas of the central inland and southwestern regions of China exhibited HUEs primarily around 80%. Meanwhile, cities in the Shandong Peninsula and in Northern China featured the lowest HUEs, typically around 75%. In 2020, cities in the Pearl River Delta region and the southern part of the Yangtze River Delta region were measured with the highest HUEs, generally at around 80%. Cities in certain areas of the central inland and the southwestern regions of China featured HUEs generally around 70%. Ultimately, cities with the lowest HUEs concentrated in the northern part of the Yangtze River Delta region and the Shandong Peninsula, generally at around 65%.
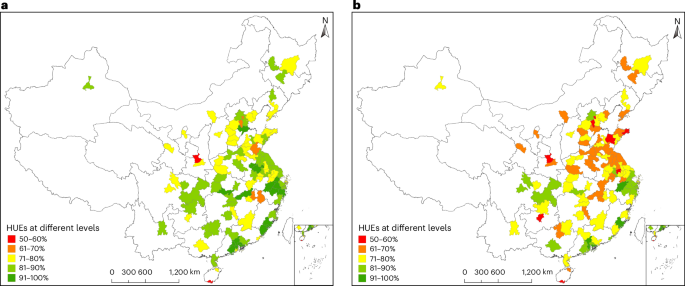
a, Regional differences of HUEs across China in 2010. b, Regional differences of HUEs across China in 2020.
When comparing the HUE values of cities in 2010 and 2020, we observed the following trends in the spatiotemporal evolution of HUEs across China. (1) Cities with the highest HUEs were consistently concentrated in the Pearl River Delta region and the southern part of the Yangtze River Delta region. Cities in the Shandong Peninsula, in contrast, consistently exhibited the lowest HUEs. (2) Cities that experienced the highest decrease in HUEs between 2010 and 2020 were mostly concentrated in the northern part of the Yangtze River Delta region and the Shandong Peninsula, with a HUE decrease generally between 10% and 20%.
Intraurban spatial analysis of HUEs across China
In general, we found characteristic spatial patterns of HUEs in relation to the city center across Chinese cities. We found that subdistricts located in the center layer generally featured the lowest average HUEs across China in both, 2010 and 2020. Meanwhile, with an increase in spatial distances to the city center, we observed improvements in HUEs (Fig. 2e). This indicates that, after 2010 in China, the HUE in the outer layer of the urbanized areas was generally higher than that in the central old towns. Moreover, the most notable decrease in average HUE occurred in subdistricts located in the center layer between 2010 and 2020, decreasing from 84% to 77%. This is followed by subdistricts located in the expansion (decrease of 5%) and the suburb layer (decrease of 5%). Subdistricts located in the periphery layer experienced the smallest decrease (4%) on average HUE.

a–e, The average HUE values within the four layers of cities in different tiers in 2010 (a), different tiers in 2020 (b), different regions in 2010 (c), different regions in 2020 (d), and total in 2010 and 2020 (e).
Significant differences of HUE patterns also exist among cities within different tiers and regions. Among the four tiers, both first-tier and fourth-tier cities consistently exhibited the HUE pattern of increasing values with distance to the center in both 2010 and 2020 (Fig. 2a,b). Notably, the most significant decrease in average HUE across the four layers between 2010 and 2020 was observed in fourth-tier cities, whereas first-tier cities experienced the smallest decrease. Among the four regions of China, eastern cities also consistently exhibited the HUE pattern of increasing values with rising distance from the center in both 2010 and 2020. In addition, the average HUE in the four layers of the northeastern and central cities showed a more significant decrease compared with cities in the other two regions (Fig. 2c,d).
Four evolution types of HUE within cities
Ultimately, we found four characteristic HUE evolution types for cities across China. These represent differences in urban population movement, urban housing growth and HUE change (HUEC) and their related spatial distribution patterns at the intraurban scale (Extended Data Fig. 1).
Cities of type 1 showed significant urban housing growth concentrated in a few newly developed towns or districts at the urban edge between 2010 and 2020. Although a considerable number of people migrated to these urban areas during this period, the oversupply of new urban housing has resulted in the decrease of HUE within those newly developed zones. Twenty-eight cities were categorized into this type. Most of them are located in inland regions of China.
Cities of type 2 showed slight urban housing growth, evenly distributed in the urban periphery, accompanied by slight urban population movement from center to periphery between 2010 and 2020. The dynamics of the HUEs within these cities were relatively low. This type contained 26 cities. Cities in this type are mainly concentrated in the coastal areas of China.
Cities of type 3 exhibited medium dynamics of urban housing, population and HUE between 2010 and 2020, with a degree falling between that of type 1 and type 2. There are 34 cities of this type. The cities are primarily small-sized and dispersedly distributed across China.
Cities of type 4 exhibited relatively high dynamics of urban housing, and their urban population movement was able to fill in the gap created by newly constructed urban housing. This led to only a slight decrease of HUEs in those areas. Twenty cities were classified as this type. The cities are distributed mainly in Eastern China.
Four representative cities illustrating the four types
We selected four representative cities for illustrating the detailed intraurban evolution characteristics of the four evolution types, including urban population change (UPC) rates, urban housing change (UHC) rates and HUE variations across subdistricts between 2010 and 2020.
We selected Changsha to illustrate type 1. Changsha is the capital of Hunan Province, and it is located in Central China. Significant differences of urban population movement, urban housing increase and HUEC between 2010 and 2020 were observed among different subdistricts (Fig. 3a). Meanwhile, the urban housing growth was obviously faster than the urban population movement. Furthermore, subdistricts with the most notable dynamics were located mainly in the outer urban areas.

a–d, Urban population and housing change rates, along with HUE variations between 2010 and 2020, observed across subdistricts in four typical cities representing four evolution types: Changsha (a), Shanghai (b), Shijiazhuang (c) and Suzhou (d).
For type 2, we selected Shanghai. Shanghai is one of China’s mega cities and the core city of the Yangtze River Delta urban agglomeration. The general dynamics of the urban population movement, the urban housing increase and the HUEC across all subdistricts between 2010 and 2020 were obviously lower than those observed in cities categorized as type 1 (Fig. 3b). The growth rate of urban housing was slightly higher than that of urban population movement.
We selected Shijiazhuang for type 3. It is the capital of Hebei Province and located in the Beijing–Tianjin–Hebei urban agglomeration. The degree of dynamics of urban population movement, urban housing increase and HUEC in all subdistricts of Shijiazhuang between 2010 and 2020 fell between those observed in cities classified as type 1 and type 2 (Fig. 3c). Moreover, subdistricts with notable dynamics were located mainly in the outer urban areas.
Suzhou was selected as the typical city for type 4. It is the most economically developed city in Jiangsu Province and one of the core cities of the Yangtze River Delta urban agglomeration. The dynamics of urban housing growth and urban population movement were relatively high, like cities of type 3. However, the dynamics of the HUE were lower compared with type 3 (Fig. 3d).
Discussion
The measurement or assessment of the HUE is challenging. The census in China does not report this issue, and limitations of other multisource emerging data include resolution, accuracy and accessibility. Tracking the exact status of specific housing units (for example, consistently occupied, seasonally unoccupied or year-round unoccupied)15, which can be reliably determined by traditional in situ surveys and investigations, is time and resource consuming. Against this background, we present and adopt the HUE as a straightforward replacement for the traditionally used HVR to measure the gap between urban housing supply and demand. The HUE represents the ratio of actual population to population capacity within specific spatial units, making it suitable for investigating urban housing supply and demand by utilizing multisource emerging data. This conversion from the traditional HVR concept helps to avoid the challenges associated with monitoring and calculating vacant housing units.
The population capacity within specific spatial units is theoretically determined by all urban housing units physically suitable for occupancy and the average living space or the theoretical reasonable living space. Currently, however, authoritative sources of housing data for reference are inexistent in China. The rapid urban housing growth and high transaction volumes in China over the past two decades have spurred the emergence of several nationwide real-estate information service platforms20. These platforms provide detailed urban housing information. Consequently, they have become the primary source of urban housing data, supported by web crawler technology15. Ensuring the accuracy, large scale, high resolution and comprehensiveness of urban housing information collected from these platforms is a common challenge faced by related studies21. However, our study encompasses all of these aspects. We collected housing data at the neighborhood level, for 108 cities across China, and we devised a standardized cross-verification process to harmonize and collate housing data gathered from multiple platforms. Specifically, collecting housing data from multiple platforms aims to minimize missing data, while cross-verification ensures data accuracy.
The census typically serves as the most authoritative source of population data for various countries and regions, although it is also frequently criticized for its limitations, particularly regarding certain inaccuracies (for example, miscounts of urban population and missing informal population) and the lack of spatial information22. In addition, partial miscounts are often caused by frequent changes in administrative divisions. With the widespread utilization of various emerging big data, studies have attempted to enhance spatial resolutions or supplement spatial information for new population assessments, although they cannot resolve the errors generated during the census process. This is because the modeling, estimation and spatialization processes rely on census data as input. Examples are the WorldPop dataset, the Gridded Population of the World dataset and the Landscan Global Population dataset23. In this study, we directly utilized the actual population at the subdistrict level obtained from the Sixth and Seventh Census. Furthermore, we devoted a significant amount of effort on tracking and adjusting the subdistrict boundaries between 2010 and 2020 to mitigate miscounts of urban population resulting from changes in administrative divisions.
Although this study allows investigating HUEs across China at the subdistrict level between 2010 and 2020, we still face challenges due to limitations of the input data: First, information about informal housing located in urban areas is challenging to obtain, such as self-built and makeshift houses. For the majority of urban areas in China, these informal housings account for a very small percentage and rarely affect the investigation accuracy of the HUE. However, in a few cities in Guangdong Province, this phenomenon is more prevalent due to the legacy of their urbanization process24. Let us take Guangzhou, the city with the highest concentration of informal housing, as an example. Peng et al.25 reported that, in 2020, the area of informal housing in the main urbanized region of Guangzhou was approximately 30.42 km2, with a population density of 20,800 people km−2. Thus, informal housing accommodated around 632,700 individuals. This population accounted for 4.16% of the total urban population of Guangzhou in 2020. This indicates that 4.16% of the urban population lived in informal housing. However, this number was counted as living in formal housing when calculating the HUE. Thus, we infer that the actual HUE of Guangzhou in 2020 was around 4–5% lower than our initial estimate. For other cities, the presence of informal housing is reported with fewer shares than in Guangzhou, suggesting that errors would be less than 4%. However, due to the lack of exact references for the scale of informal housing in these cities, precise corrections remain challenging. Second, the basic spatial unit for analysis in this study is designated as the subdistrict. Based on the current available multisource data, we argue that this approach is currently the optimal trade-off between high spatial resolution and at the same time allows a large-scale analysis of HUEs across China at two time stages, 2010 and 2020. However, investigating additional HUEs at various time points between 2010 and 2020 is limited due to the frequent changes in administrative divisions and a shortage of population data at the subdistrict level.
We found by our definition and approach that the HUE across China was estimated at 84% in 2010 and 78% in 2020. As a check of plausibility, we refer to several notable large-scale investigations on the utilization of urban housing in China. A survey conducted by the Southwest University of Finance and Economics, involving 40,011 sampled households and over 2,000 surveyors, revealed that China’s HVR was 18.4% in 2011 and increased to 21.4% in 201726. Based on the emerging big data, Pan and Dong27 estimated a HVR of 27.3% for China’s prefecture-level cities in 2013, and Tan et al.13 estimated that the HVR for China’s 49 major cities generally exceeded 20% in 2018. We can speculate that the HVR in China’s urban areas for 2020 may have been higher than the values that they previously estimated, considering the ongoing upward trend of urban housing. In other words, it suggests that the occupancy rate of China’s urban housing should have fallen below 80%. However, the exact figure is uncertain due to the varying results estimated by them and the lack of authoritative references on this matter. Although the definition of the HUE that we have introduced is not identical to the definition of the traditional HVR, their similarities in measuring the discrepancy between urban housing supply and demand allow a check of plausibility in the absence of authoritative reference data. These figures in other studies show great similarities with our results. Even if this is not a quantitative validation, plausibility in the cross-comparisons is given.
The heavy reliance of local public finance on land transfer revenue over the past two decades in China has been extensively documented and referred to as ‘land finance’. Statistics from the Ministry of Natural Resources of China reveal that land transfer revenue accounted for over 40% of total local government revenue in 2020. This figure is expected to exceed 50% for many local governments when considering other related land taxes28. Against this background, the motivation for urban construction was greatly stimulated in many local governments. An investigation by the Urban and Small Towns Reform and Development Center of China revealed that, by May 2016, more than 3,500 new towns and districts had been planned and constructed in China29. Numerous urban housing complexes, commercial properties, industrial facilities and infrastructure were constructed, accompanied by the development of these new towns and districts. To accelerate capital flow, the government allows real-estate developers to presell their commercial housing, often characterized by homes being sold (or even sold out) before their construction is completed. This has led to a typical model of urbanization in China amid the significant wave of urban construction, where new developments are initially constructed and sold and subsequently populated30.
Populating these new developments became the primary challenge for many local governments for a considerable period afterward. Relocating urban functions (for example, administrations, schools and hospitals) in new developments is one of the most commonly adopted approaches by many local governments in China. The well-known ghost city Ordos is a typical example of this7. The expected populations come mainly from two sources: first, populations migrate from inner urban areas to these new developments in the peripheral urban areas for improving their housing conditions; and second, populations migrate from surrounding rural areas or some lower-tier cities in search of more opportunities31. Thus, population loss was observed between 2010 and 2020 in the inner urban areas of many cities, but not throughout the entire city. Conversely, the population in the outer urban areas of these cities generally increased, accompanied by extensive urban housing growth during the same period. Thus, this development is a result of the outward migration or relocation of downtown functions, accompanied by rural–urban migration.
In comparison with the spatial distributions of China’s ‘ghost areas’ monitored by Jin et al.32 and Shi et al.6, we observed that regions with notably low HUEs or extensive decreases in HUEs between 2010 and 2020 were concentrated in areas where ghost areas were detected by these studies. This indicates that some new developments have failed to attract enough residents, despite many of their properties having been purchased through presales. As a result, they contributed to the emergence of the ghost city phenomenon. Low-tier cities located in eastern China suffered more from it, due to their large number of new developments but low attractiveness between 2010 and 2020.
The four evolution types of HUE within cities, in our perspective, represent different stages in China’s urbanization process. Cities of type 1 are at the stage of rapid spatial expansion at urban peripheries. The primary characteristic for this urbanization stage is the intensive growth in urban housing and population at the urban peripheries. Cities of type 2 are generally at a later, more mature stage of urban spatial expansion. The growth of urban housing and population at the urban peripheries is relatively slow. Meanwhile, cities of type 2 present the highest population loss at the center layer of their urban extents among the four types. Cities of type 3 and type 4 are primarily at the stages of urbanization between those of type 1 and type 2. They experienced similar urban housing growth but varied in population attractiveness, leading to different dynamics in HUEs between 2010 and 2020.
In general, this study accurately quantifies the discrepancy between urban housing supply and demand in China at a high spatial resolution, helping to address the wide variation in previous reports. Furthermore, it deepens our understanding of China’s urban housing supply and demand in relation to its specific urbanization characteristics and policies. In addition, the transferability of the framework for measuring the HUE suggests its potential for future applications or adaptation in broader research areas.
Methods
HUE
The HVR is widely adopted as a regular indicator in studies investigating the gap between urban housing supply and demand15. It is commonly regarded as the percentage of vacant housing, with a definition that appears to be clear and uncontroversial. This interpretation has simplified some official definitions of the HVR, as the exact meaning of ‘vacant’ is not clear. More specifically, the US Census Bureau defines the HVR as the percentage of housing units that are unoccupied but physically suitable for occupancy. Both year-round and seasonal housing units that currently remain unoccupied are counted33. The United Nations (UN), in comparison, define the HVR as the percentage of the total number of housing units that are presently unoccupied, with a separate consideration for year-round and seasonal unoccupied housing units34.
The above definitions of HVR offered by official authorities (for example, the United States and the UN) were developed from the traditional investigation approach for the HVR. For instance, the investigation of HVR in the United States is funded by the US Department of Housing and Urban Development and sampled monthly by the US Census Bureau, using a combination of phone calls and home visits31. The precise status of investigated housing units, whether consistently occupied, seasonally unoccupied or year-round unoccupied, can be confirmed through callbacks or return visits. Therefore, in this situation, the HVR can be calculated precisely according to its original definitions.
However, the traditional investigation approach demands extensive manpower and resources, which are beyond the reach of the typical capabilities of research endeavors. Therefore, the utilization of multisource emerging data for investigating urban housing supply and demand is becoming an increasingly inevitable trend in urban housing studies. Currently, obtaining the precise status of a specific housing unit using multisource emerging data, such as nighttime light satellite data, point of interest data or location-based data, remains challenging35,36. While previous studies presented their findings on urban housing supply and demand using the term ‘HVR’, they primarily compared the relative level of human activities across urban areas11,12,13,14 or measured the gap between population capacity and actual population within specific spatial units15,16,17. Their HVRs were not calculated according to its original definitions, nor were the exact numbers, types and distributions of vacant housing provided. In other words, they indeed examined the relationship between urban housing supply and demand from a certain perspective, rather than the HVR as they had claimed.
In this study, we aim to investigate urban housing supply and demand across China for the years 2010 and 2020 by utilizing multiple emerging data. The exact numbers and percentages of vacant housing units are not available with current data and methodologies. Therefore, we refer to the traditional HVR and convert it straightforwardly to the HUE, which is defined as the ratio between the actual population of a specific spatial unit and the theoretical population capacity of all housing units physically suitable for occupancy within that unit during the measurement period.
HUE is based on the traditionally used indicator HVR and can generally be regarded as the opposite of HVR. However, there are some conceptual differences between HUE and HVR. HVR is traditionally quantified by the proportion of vacant housing. In contrast to the HVR, the HUE avoids the identification and enumeration of vacant housing and focuses instead on measuring the overall utilization efficiency of all housing units. Adopting HUE circumvents the challenge of establishing criteria for ‘vacant’, and it eliminates uncertainties generated during the process of identifying vacant housing units. Thus, we consider the HUE for assessing urban housing supply and demand at larger scales and across multiple phases when utilizing emerging data to be a more appropriate measure than the HVR.
Study area and spatial units for analysis
Our investigation of the urban HUE was carried out within the highly urbanized subdistricts of 108 selected cities in China, all of which exhibit urban population rates exceeding 60%. The spatial reach of these highly urbanized subdistricts within each city encompasses the entirety of the urban areas defined within the city’s boundaries. We do so because the commercial housing data for low urbanized areas are unavailable due to their lower degrees of commercialization. The subdistrict level serves as the smallest census unit in China. Thus, we apply it as the basic spatial unit for analysis in this study.
The 108 cities were selected according to the ranking list of the ‘Cities’ Business Attractiveness’ released by the First Financial-New First tier City Research Institute (FF-NFTCRI)37. The city rankings were determined by FF-NFTCRI across five dimensions: commercial resource agglomeration, urban hub, urban human activity, lifestyle diversity and future potential. Among the selected 108 cities, 4 of them are ranked as first-tier cities (that is, Beijing, Shanghai, Guangzhou and Shenzhen), 15 of them are ranked as second-tier cities (for example, Chengdu, Wuhan, Chongqing and Xi’an), 30 of them are ranked as third-tier cities (for example, Guiyang, Yantai and Wuxi) and the remaining 59 cities (for example, Weihai, Sanya and Daqing) are ranked as fourth-tier cities. First- and second-tier cities are typically categorized as high-tier or large-sized cities, whereas third- and fourth-tier cities are commonly regarded as low-tier, which includes medium- or small-sized cities. These selected cities effectively cover all regions of China that have experienced rapid urban housing development over the past decade (Extended Data Fig. 2).
Datasets
Administrative boundaries of subdistricts
In this study, we investigate the urban HUE for the years 2010 and 2020 at the subdistrict level. The spatial extent of each subdistrict, defined by its 2020 vectorial administrative boundaries, was extracted from the National Platform for Common Geospatial Information Services (https://www.tianditu.gov.cn/) (Fig. 4a). This dataset was created on the basis of the administrative divisions, and it maps the subdistricts released by the Ministry of Civil Affairs. The spatial extent of each city, in turn, is determined by the combined boundaries of all subdistricts within its administrative divisions as of 2020. The data processing involved steps such as raster alignment, boundary vectorization, administrative code matching and topology check. These steps were carried out through human–computer interaction.

a, An illustration of vectorial administrative boundaries of subdistricts. b, An illustration of three types of adjustment in the subdistrict administrative division between 2010 and 2020. Labels A, B, C and D refer to the subdistricts involved in the adjustments. c, An illustration of residential neighborhoods within a subdistrict with information crawled from real-estate platforms.
Subsequently, we identified the administrative divisions at the subdistrict level that were not spatially static between 2010 and 2020. Here, we relied on the announcements issued by the Ministry of Civil Affairs (https://www.mca.gov.cn/). We merged the adjacent subdistricts that had been adjusted into a new subdistrict. Figure 4b illustrates three types of adjustment at the subdistrict administrative division between 2010 and 2020. We adopted the adjusted vectorial boundaries of subdistricts for the analysis of both 2010 and 2020. With that, we have a spatial reference unit available to analyze the evolutions of urban housing within the same spatial extent of each subdistrict from 2010 to 2020. Finally, the 108 selected cities contain a total of 503 highly urbanized districts and 4,626 highly urbanized subdistricts. The typical coverage area for a subdistrict located in the central layer of urbanized areas is 3–5 km2, while those in the outer layer typically cover around 10 km2 (Fig. 4a). A district (that is, the district level) mentioned in current studies typically comprises approximately ten subdistricts (that is, the subdistrict level) that are described in this study.
Census data
For population data, we collected the permanent residents of each subdistrict for the years 2010 and 2020 from the Sixth and Seventh Census data of China. Permanent residents are individuals who live in a town, township or subdistrict and either have their household registration (hukou) there or their registration is undetermined. It also includes those who have lived in the area for more than 6 months after leaving their registered location, as well as those whose registration is in the area but who have been away for less than 6 months or are abroad for work or study38. These data represent the total population of all subdistricts at the end of the years 2010 and 2020, rather than the urban population. Subsequently, we calculated their urban population by multiplying their urbanization rates collected from the census data. In addition to the population data, we also collected average household size information from the Sixth and Seventh Census data for each subdistrict in 2010 and 2020. This index represents the average number of individuals residing in a single household within a specific subdistrict37.
Urban housing data
We collected urban housing data for all highly urbanized subdistricts in the 108 Chinese cities in April 2020. For supplementing and updating urban housing data, we conducted another round of data collection in December 2020. We used web crawler technology to gather the data from several of China’s largest real-estate information service platforms (for example, Anjuke, Beike or Fangtianxia) (Fig. 4c). The link provided here is an exemplar list of residential neighborhoods in Shanghai (https://shanghai.anjuke.com/community/). As data gaps were frequently encountered at a single platform, we applied housing information data collected from multiple real-estate information service platforms to complement one another and cross-verify the data through comparison. For instance, platform A may provide the exact location and the number of apartments for a particular residential neighborhood, but the construction year might be missing. Conversely, platform B provides the construction year and the number of apartments for the same residential neighborhood. In this data acquisition, we adopted precise name matching of residential neighborhoods to provide a comprehensive and verified cross-validated dataset.
The key information collected from these platforms includes (1) the exact location (that is, latitude and longitude) of each residential neighborhood, which is used to establish a spatial relationship with the census data; (2) the number of housing units in each residential neighborhood, which is used to estimate the population capacity of the neighborhood; and (3) the construction year of each residential neighborhood, which is used to determine the year of completion of the neighborhood.
We considered all residential neighborhoods that were constructed and physically habitable before 2020 as our urban housing dataset for the year 2020. Residential neighborhoods that were still under construction in 2020 are not included in the analysis. The urban housing dataset for the year 2010 was constructed in a backward manner from the established urban housing dataset for the year 2020 according to the construction year of each residential neighborhood. In fact, as part of China’s urban renewal process, an annual demolition rate of 2% is existent for urban housing that exceeded their service lifespan. The information regarding residential neighborhoods demolished between 2010 and 2020 was not available from these platforms. However, this absence of data does not affect the analysis of urban HUE, as they accounted for a very small proportion and were no longer physically habitable.
Data processing
Estimation of population capacity in subdistricts
The population capacity defines the upper limit of people that can be housed at the average accommodation conditions of a subdistrict. This capacity is determined by the amount of urban housing within that subdistrict, which can be measured either by the total urban housing area or by the total number of housing units.
Commercial urban housing established after the real-estate reform in China generally encounters the concept of a ‘shared area’, which is a portion of area borne by all owners for public use, including spaces such as stairwells, hallways and elevators. It indicates that the actual living area of involved residential buildings is typically smaller than the floor area (or the property area). Conversely, older urban housing established before the real-estate reform in China usually did not include the shared area. To reduce uncertainties, we measured the amount of urban housing by the number of housing units, which is also in line with the traditional understanding of urban housing.
In a standard scenario, one household typically occupies one housing unit by default. This principle was commonly recognized and adopted during the process of traditional investigations of the HVR39. Thus, the theoretical population capacity of a subdistrict can be estimated as the product of its total number of housing units and its average household size. The total number of housing units of each subdistrict can be counted on the basis of the housing data collected from multiple real-estate information service platforms. The average household sizes of each subdistrict in 2010 and 2020 were provided by the Sixth and Seventh Census data. We calculate the population capacity of a subdistrict at a particular moment (that is, at 2010 or 2020) as follows:
where HU_Sk is the total number of housing units of subdistrict k; HU_Ri is the total number of housing units of residential neighborhood i within subdistrict k; n is the total number of residential neighborhoods within subdistrict k; PC_Sk is the population capacity of subdistrict k; and AHSk is the average household size of subdistrict k.
Calculating HUEs of subdistricts
The HUE of a particular subdistrict is defined as the ratio between the actual population of a subdistrict and the population capacity of all housing units physically suitable for occupancy within that particular subdistrict. The actual population of each subdistrict refers to the actual residential population numbers at the end of the years 2010 and 2020. Equation (3) introduces the derivation of the HUE of a subdistrict at a particular moment (that is, in 2010 or 2020):
where AP_Sk and PC_Sk are the actual population and the population capacity of subdistrict k, respectively, and HUE_Sk is the HUE of subdistrict k, which theoretically ranges from 0% to 100%. However, we found that the AP_Sk values were a little higher than PC_Sk values in a very small proportion of subdistricts. This indicates that informal dwellings (that is, shanty towns) existed in those subdistricts in 2010 or 2020, accommodating some urban population that has not been recorded in real-estate information service platforms. In this case, we consider the HUEs of these subdistricts to be 100%.
For further analysis, the HUE of a particular city is calculated as the ratio of the actual population across all its subdistricts to the total population capacity of these subdistricts.
Identifying city centers for spatial analysis
To identify patterns at the intraurban level of varying HUEs and for pattern comparisons across cities, a spatial reference point is required. We use here the center of each city, by employing a monocentric city model. In Chinese cities, complex polycentric structures as well as monocentric structures exist. However, from the perspective of spatial analysis, the monocentric model remains effective in explaining an essential part of the variation in urbanized areas40, and it is suitable for the comparisons among various cities at the intraurban level. Thus, the monocentric structure still serves as a reliable theoretical and empirical foundation for assessing intraurban locations41.
In this study, we identified the center of each city by employing the methodology introduced by Shi et al.42. The city center is identified on the basis of the following three conditions: (1) if a city has only one main train station, and it is also located in the center of the old town, we define this location as the city center; (2) if a city has more than one main train station, and they are all located in the center of the old town, we take their geometric center as the city center; (3) if a city has no main train station, we identify the location of the main CBD as the city center.
Based on the identified center of each city, we establish a relation between the HUE of each subdistrict and its spatial distance to the respective city center. For the analysis, we categorize urban space within a city into four location types according to their spatial distances from the city center: center layer, expansion layer, suburb layer and periphery layer. The center layer comprises the closest 25% of all subdistricts within this city, while the expansion layer comprises the subsequent 25% of subdistricts. Moving outward, the suburb layer follows, and finally, the periphery layer comprises the farthest 25% of subdistricts. Subsequently, we calculate the average HUEs for the subdistricts within the four layers of every city.
Categorizing evolution types of HUE within cities
In our multitemporal analysis, the HUEs change over the years. We aim to categorize these changes in ‘HUE evolution types’. The evolution types are formed by both population movement and urban housing growth. At the city level, urban population and housing exhibited generally similar characteristics across China between 2010 and 2020. However, at the subdistrict level, discernible differences in the evolutions of urban population and housing become apparent. Thus, we applied the difference of UPC, the difference of UHC and the difference of HUEC (equations (4)–(6)). With it, we categorized evolution types of HUE between 2010 and 2020.
where UP_Ri, UH_Ri and HUEi are the UPC rate, the UHC rate and the HUEC value of subdistrict i of a certain city, respectively; (overline{{{mathrm{UP}}_{mathrm{R}}}}), (overline{{{mathrm{UH}}_{mathrm{R}}}}) and (overline{{{mathrm{HUE}}}}) are the average UPC rate, the average UHC rate and the average HUEC value of all subdistricts of a certain city, respectively; UPC, UHC and HUEC are the standard deviation of the UPC rate, the standard deviation of the UHC rate and the standard deviation of the HUEC value of a certain city, respectively; and n is the total number of subdistricts within a certain city.
The values of UPC, HUC and HUEC are, of course, not uniform. For a categorization, we grade the individual metrics by assigning intensity values based on the interquartile ranges. The top 25% of each metric, that is, the 25% highest measured population increases, growth of housing or decrease of the HUE, receives the highest intensity value, followed by the subsequent 50%, and the bottom 25% is assigned the lowest respective intensity value (Extended Data Table 1).
For a final categorization of HUE evolution types within cities, we combined the grading results of HPC, UHC and UHEC. In theory, there are 27 possible combinations. However, in practice, many of them do not exist. Nevertheless, the number of combinations remains relatively large. To make the analysis clearer, we grouped some combinations that were adjacent to each other. For instance, we combined cities with intensive urban population movement and cities with medium urban population movement into a category representing cities with intensive or medium urban population movement. With that, we aimed to simplify the final HUE evolution types within cities. We also highlighted the distinct characteristics of different combinations by a clear terminology.
Reporting summary
Further information on research design is available in the Nature Research Reporting Summary linked to this article.
Responses