The effect of high-sugar feeding on rodent metabolic phenotype: a systematic review and meta-analysis

Introduction
Obesity is a chronic lifestyle disease associated with comorbidities that present major clinical challenges to the modern health landscape throughout both developed and developing nations1. Highly palatable, hypercaloric foods alter reward pathways within the brain and continued exposure drives increased food intake leading to deposition of fat mass2. The obesogenic, or Western, diet is typically described as high in fat and sugar but low in protein and is energy dense. The diet has been extensively explored in both animal and human populations, robustly producing an obese phenotype often accompanied by insulin resistance3. A similar phenotype is shown in animals who consume a high-fat, low-sugar diet4.
However, understanding the effect of high-sugar, independent of fat, is more difficult to ascertain. While dietary sugar intake and fructose-containing sugars, have been the focus of intense research, inconsistencies in the literature exist due to several issues with pre-clinical study design. The first, is that sugar intake has most often been explored within the context of a high-fat diet, confusing the direct effects of sugar on adiposity and metabolic dysfunction in mechanistic studies5. Secondly, other studies that explore sugar intake supplement solid food with high-sugar liquids, often leading to increased energy intake, which makes it hard to delineate the effects of overconsumption from the sugar-specific effects themselves6.
Chronic consumption of fructose and fructose-containing sugars has been linked to obesity, type 2 diabetes mellitus, high blood pressure, cardiovascular disease, Metabolic dysfunction-associated steatotic liver disease (MASLD)7,8. Although, as stated above, many of these links have been drawn from studies with confounders (e.g., a high-fat exposure) which were not adequately considered. Meta-analyses performed on human studies suggest that the cardiometabolic effects of these sugars are more nuanced and that sugar alone is not metabolically harmful when energy is not consumed in excess9.
Given the challenges of interpreting human studies in the context of complex dietary intake, here we aim to focus on the effects of sugar-feeding independent of dietary fat in rodents. We determined the effect sizes and significance of two solid isocaloric sugar-based diets, sucrose and fructose, on a range of metabolic parameters from publications in the literature systematically identified.
Results
Article selection
In total, 25 articles were identified from the original search and 15 more were found from manual searching of the reference lists. The systematic search procedure with the number of articles included and excluded at each step is show in Fig. 1. Two studies were removed as they were the only studies that contained female mice or rats. Of the remaining 38 articles, there were 21 mouse and 17 rat. Four of the studies used two strains for different experiments, reflected in k, which signifies the number of effect sizes. As this occurred in only a small amount of studies, we chose not to use a multi-level approach with this data. All studies contained body weight data and most contained energy intake, plasma triglyceride, plasma cholesterol, and fasting insulin data. Each study also included a control diet which was either standard chow formulations or low-sugar, low-fat diets comprising of predominantly starch in comparison to the high-sugar diets.

A flow chart detailing the number of articles included and excluded throughout the systematic review process. Adapted from Ainge et al. 201130.
Meta-analysis
The meta-analysis was performed on 12 traits, divided into 4 categories: body weight/energy intake, liver parameters, glucose homoeostasis, and plasma parameters (Table 1). The characteristics of each study are shown in Table 2. The results of these meta-analyses are shown in Figs. 2–5. We segregated the results of the meta-analyses in terms of type of sugar, species, length of diet, dietary fat content, starting age, fasting time, and use of anaesthesia to demonstrate some of the confounding factors. In summary, eight of the twelve traits were significantly increased by high-sugar feeding. We detected publication bias in one of the twelve traits (Table 3).
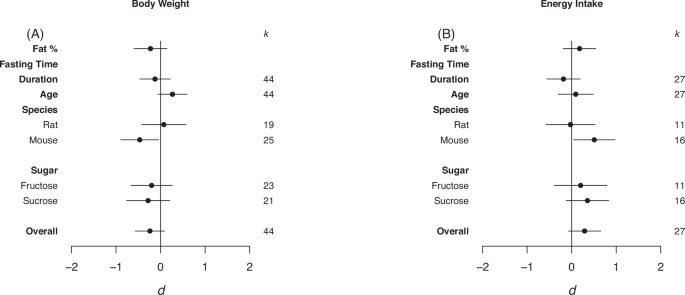
Forrest plots depicting the effects of high-sugar feeding on (A) Body weight, (B) Energy intake. The effect is quantified as d, the difference between the mean of the treatment and control groups. Positive values indicate a higher mean in the sugar-fed groups compared to the control group (and vice versa). Overall estimates were determined by random‐effects meta‐analysis and species- and sugar-specific effects were determined by random-effects meta-regressions. Estimates for fat as a percentage of diet, fasting time, duration, and age diet was started, correspond to slopes from random‐effects meta‐regression. k is the number of effect sizes on which each estimate is based, and bars correspond to 95% confidence intervals.
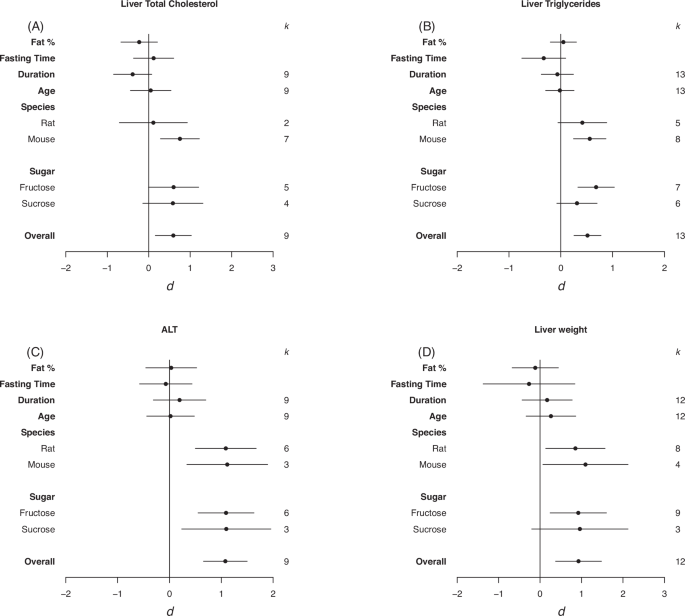
Forrest plots depicting the effects of high-sugar feeding on (A) Liver total cholesterol, (B) Liver triglycerides, (C) ALT, (D) Liver weight. The effect is quantified as d, which are the differences between the means of the treatment and control groups. Positive values indicate a higher mean in the sugar-fed groups compared to the control group (and vice versa). Overall estimates were estimated by random‐effects meta‐analysis and species- and sugar-specific effect were determined by random-effects meta-regressions. Estimates for fat as a percentage of diet, fasting time, duration, and age diet started, correspond to slopes from random‐effects meta‐regression. k is the number of effect sizes on which each estimate is based, and bars correspond to 95% confidence intervals.
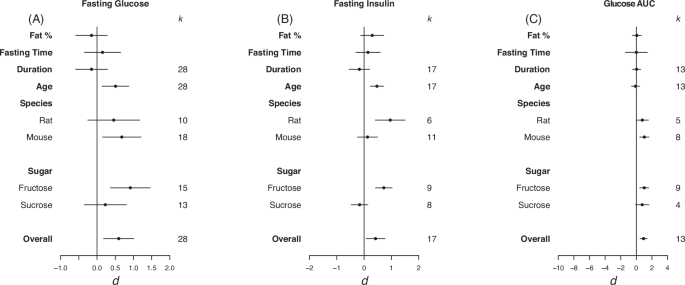
Forrest plots depicting the effects of high-sugar feeding on (A) Fasting glucose, (B) Fasting insulin and (C) Glucose AUC. The effect is quantified as d, which are the difference between the means of the treatment and control groups. Positive values indicate a higher mean in the sugar-fed groups compared to the control group (and vice versa). Overall estimates were estimated by random‐effects meta‐analysis and species- and sugar-specific effect were determined by random-effects meta-regressions. Estimates for fat as a percentage of diet, fasting time, duration, and age that diet was started on correspond to slopes from random‐effects meta‐regression. k is the number of effect sizes on which each estimate is based, and bars correspond to 95% confidence intervals.
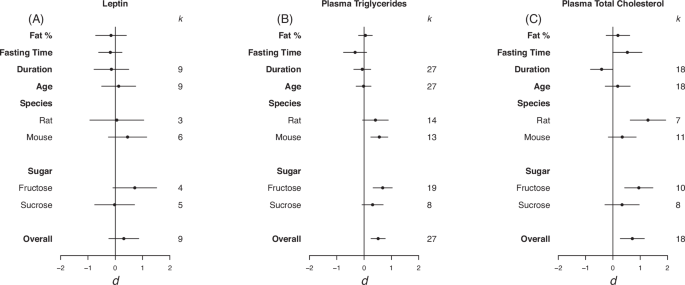
Forrest plots depicting the effects of high-sugar feeding on (A) Leptin, (B) plasma triglycerides and (C) plasma total cholesterol. The effect is quantified as d, which are the difference between the means of the treatment and control groups. Positive values indicate a higher mean in the sugar-fed groups compared to the control group (and vice versa). Overall estimates were estimated by random‐effects meta‐analysis and species- and sugar-specific effect were determined by random-effects meta-regressions. Estimates for fat as a percentage of diet, fasting time, duration, and age diet started, correspond to slopes from random‐effects meta‐regression. k is the number of effect sizes on which each estimate is based, and bars correspond to 95% confidence intervals.
Body weight and energy intake
Overall, there was no statistically significant effect of high-sugar feeding on body weight or energy intake relative to the control diet (Body Weight d = –0.24, LCL = –0.57, UCL = 0.09; Energy Intake d = 0.29, LCL = –0.07, UCL = 0.65; Fig. 2). Heterogeneity was high in both body weight and energy intake (I2 = 84.76%, I2 = 79.88%, respectively). When sub-setting the data by species, high-sugar feeding had a small, but statistically significant, negative effect on mouse body weight yet a positive moderate effect on energy intake (Body Weight d = –0.47, LCL = –0.89, UCL = –0.04; Energy Intake d = 0.51, LCL = 0.04, UCL = 0.097; Fig. 2).
Eggers regression detected evidence of publication bias, and missing effects from the left hand side of the funnel, for Energy Intake (Table 3). However, trim and fill analysis detected no missing effects (see Fig. S1 in appendix for funnel plots).
Liver parameters
There was a significant moderate positive effect of high-sugar feeding on total liver cholesterol and liver triglycerides, and a large positive effect on plasma ALT compared to controls and on absolute liver weight (total liver cholesterol d = 0.59, LCL = 0.16, UCL = 1.03 ; liver triglycerides d = 0.52, LCL = 0.25, UCL = 0.78; plasma ALT d = 1.08, LCL = 0.66, UCL = 1.50; liver weight d = 0.93, LCL = 0.37, UCL = 1.48; Fig. 3). Heterogeneity was small for cholesterol and ALT (I2 = 44.44%, I2 = 27.92%, respectively) and moderate for liver weight (I2 = 65.90%). For total liver cholesterol and triglycerides there was an effect in mice but not rats (total liver cholesterol d = 0.75, LCL = 0.28, UCL = 1.22 ; liver triglycerides d = 0.56, LCL = 0.25, UCL = 0.87; Fig. 3A, B). Plasma ALT was increased in response to both sucrose and fructose high-sugar feeding (fructose d = 1.09, LCL = 0.55, UCL = 1.63; sucrose d = 1.10, LCL = 0.24, UCL = 1.96)Fig. 3C). For ALT and liver weights there was an increase in both mice and rats (plasma ALT; mice d = 1.12, LCL = 0.34, UCL = 1.89; rats d = 1.09, LCL = 0.50, UCL = 1.67; Liver weight; mice d = 1.10, LCL = 0.07, UCL = 2.12; rats d = 0.85, LCL = 0.14, UCL = 1.57; Fig. 3D). For liver triglycerides and liver weight there was an effect of fructose feeding but not sucrose (liver triglycerides d = 0.68, LCL = 0.33, UCL = 1.03 ; liver weight d = 0.92, LCL = 0.24, UCL = 1.60; Fig. 3B–D). There was no effect of fat as percentage of diet, fasting time, duration on the diet, or age diet started on any of the liver parameters.
Glucose homoeostasis
Overall, high-sugar feeding had a moderate positive effect on fasting blood glucose, no significant effect on fasting insulin (though the size of effect was consistent to that for other traits), and a large effect on glucose AUC (fasting glucose d = 0.60, LCL = 0.18, UCL = 1.01; fasting insulin d = 0.42, LCL = –0.07, UCL = 0.77; glucose AUC d = 0.93, LCL = 0.47, UCL = 1.40; Fig. 4). High heterogeneity was detected in fasting glucose (I2 = 81.7) and moderate heterogeneity was detected in fasting insulin and glucose AUC (I2 = 65.9, I2 = 58.3, respectively). For fasting glucose and glucose area under the curve there was an effect in mice but not rats (fasting glucose d = 0.68, LCL = 0.15, UCL = 1.21; glucose AUC d = 1.03, LCL = 0.44, UCL = 1.62; Fig. 4A, C). For fasting insulin there was an effect in rats but not mice (d = 0.96, LCL = 0.41, UCL = 1.51; Fig. 4B). When subset for sugar type, fructose had a strong positive effect on fasting glucose and glucose AUC, and a moderate positive effect on fasting insulin (fasting glucose d = 0.91, LCL = 0.36, UCL = 1.46; fasting insulin d = 0.72, LCL = 0.42, UCL = 1.03; glucose AUC d = 0.1,02, LCL = 0.44, UCL = 1.59; Fig. 4).
Via REMR we detected a significant positive effect of starting age on fasting glucose and insulin (fasting glucose d = 0.51, LCL = 0.14, UCL = 0.87; fasting insulin d 0.47, LCL = 0.23, UCL = 0.71; Fig. 4A, B). This suggests that the older the animals were placed on the diet the larger the difference between animals fed sugar based and control diets, suggesting later exposure has a significantly more dramatic effect on fasting glucose and insulin.
Eggers regression detected evidence of publication bias for fasting glucose and insulin (Table 3). In the case of fasting glucose, effects were missing from the left hand side of the funnel, however, trim and fill analysis detected no missing effects (see Fig. S3 in appendix for funnel plots). For fasting insulin, effects were also detected to be missing from the left side, and trim and fill analysis detected 4 missing effects.
Plasma parameters
Overall, there was a moderate positive effect of sugar-feeding on plasma triglycerides and total plasma cholesterol but not plasma leptin levels (leptin d = 0.31, LCL = -0.24 UCL = 0.86 ; plasma triglycerides d = 0.52, LCL = 0.25, UCL = 0.78; plasma total cholesterol d = 0.71, LCL = 0.27, UCL = 1.15; Fig. 5). Moderate heterogeneity was detected in leptin (I2 = 60.12%) and plasma total cholesterol (I2 = 71.36%). For plasma triglycerides, there was a positive effect in mice but not rats (d = 0.56, LCL = 0.25, UCL = 0.87; Fig. 5B). A positive significant difference was seen in rats and not mice for plasma total cholesterol (d = 1.28, LCL = 0.63, UCL = 1.94; Fig. 5B). For both plasma triglycerides and total plasma cholesterol there was a significant positive effect of fructose and not sucrose (plasma triglycerides d = 0.68, LCL = 0.33, UCL = 1.03 ; plasma total cholesterol d = 0.95, LCL = 0.43, UCL = 1.47; Fig. 5B, C). Via REMR we detected a negative effect of duration on the diet on total cholesterol (d = -0.41, LCL = -0.82, UCL = -0.01; Fig. 5C). This suggests that the longer the mice were on the diet the smaller the difference between the two means were.
Eggers regression detected evidence of publication bias for plasma cholesterol (Table 3). It was detected that effects were missing from the left hand side of the funnel, however, trim and fill analysis detected no missing effects (see Fig. S4 in appendix for funnel plots).
Discussion
This meta-analysis of experimental pre-clinical animal studies found consistent evidence that high-sugar diets, notably high-fructose diets, detrimentally effect biological parameters of metabolic health. Compared with animals fed control diets, male animals fed high-sugar diets had bigger livers, increased liver triglyceride and cholesterol content, and elevated plasma ALT. These rodents were glucose intolerant and present with increased fasting plasma glucose, cholesterol and triglyceride levels. When studies were sub-grouped by sugar (sucrose or fructose), these findings were statistically significant for fructose-fed but seem completely absent or not significant in sucrose-fed animals and more pronounced in mice than in rats. There were no significant differences detected in body weight, energy intake, fasting insulin or plasma leptin. These findings suggest that high-sugar intake, especially fructose, can drive metabolic changes without changes in energy intake or body weight.
An issue that arises with high-sugar feeding studies is the choice of control or reference diets and the broad range of macronutrient compositions within these diets. In this meta-analysis, the majority of the studies used diets matched to the high-sugar diets, where starch replaces sugar, and therefore reasonably isocaloric. However, there are a number of options of control diets for high-sugar studies including regular brown laboratory chow, AIN-93G, AIN-93M, AIN-76A, and other semi-processed diets that maintain healthy protein and low-fat levels10. In this meta-analysis, 5 of the studies used AIN-93G and 6 used AIN-93M, the current diets recommended for control animal studies. Two older studies used AIN-97A, the previously recommended control while 8 used standard laboratory chow and 17 used non-AIN low sugar purified diets. This variation in control diets, and subsequently the composition of the experimental diets may at least contribute to the high heterogeneity in many aspects of this study and stricter inclusion criteria may have minimised this. One well cited study was excluded from the meta-analysis as the control diet contained sugar comprising 30% of total energy6. It is also important to consider that different control diets have different levels of processing, so it is important to match levels of processing between the two diets to remove any confounding variables, such as food matrix, fibre, and phytochemical content. Another confounding factor potentially altering metabolic phenotype is the macronutrient content of the experimental diet. Within the literature a notable macronutrient discrepancy is within fat (contribution to energy and fatty acid type), which is why we included low- or -moderate fat in our search terms and capped fat at 30% of total energy, but even with this there was a large discrepancy in fat from 1.7% to 20% of total dietary energy amongst the studies included and analysed. A large comprehensive study had to be excluded because, although controlled, fat was present at 41.7% of total energy11. This would suggest that this diet is rich in fat along with sugar, making it hard to elucidate the effects of sugar feeding compared to fat feeding. Overall, it is difficult to elucidate the effects of high-sugar feeding if the diet composition of both the experimental and control groups are not carefully considered. In this analysis we have tried to ensure that studies with limited confounders were analysed to ensure the most accurate results.
On the pathogenicity of fructose containing sugars it is often proposed that fructose itself is not metabolically worse than other simple carbohydrates however, in much of the western world, fructose is consumed in a manner which increases energy intake and leads to increased weight and adiposity which drives metabolic disease12. Human studies have shown that fructose eaten as part of an isocaloric diet leads to little metabolic change, in both observational and acute settings, although a meta-analysis detected bias in a number of these studies13. Here we have shown no overall effect of ad libitum high-sugar feeding on bodyweight or energy intake. When sub-setting the data by type of sugar or species, we saw no differences between fructose or sucrose, nor any effect in rats. There was a negative effect on body weight in mice and a positive effect on energy intake. The detection of differences within species may be due to an improved susceptibility of specific mouse strains such as c57bl6 mice, while rat models are more complex, Sprague-Dawley rats have similar behaviour patterns to humans when it comes to feeding behaviours while Wistar rats are more susceptible to diet induced obesity14. Limited data availability on adiposity and energy expenditure across the studies hindered conclusions about the effect of sugar on body composition or energy expenditure. This data set makes it impossible to rule out a possible upregulation in energy expenditure to compensate for increased energy intake. Additionally, there is no longitudinal food intake data in many of these studies, which might be of use as the palatability of intensely sweet food may alter consumption over time. Whilst not complete, the data refutes the common misconception that fructose, either by itself or in sucrose, increases body weight in mice.
Excessive fructose intake has been strongly associated with hepatic steatosis through the activation of hepatic de novo lipogenesis (DNL) and fructose is thought to be a major contributor to MASLD pathogenesis, a disease often said to be the liver manifestation of metabolic syndrome15,16. In human meta-analyses, increased fructose intake is correlated with increase MASLD risk however, almost all of these studies have shown that increased energy intake obfuscates the true effect of fructose17,13. To reduce these findings in our own meta-analysis we chose isocaloric sugar feeding, which is easier to achieve in rodent studies. In this meta-analysis, high-sugar feeding increased all liver parameters that were able to be extracted, total cholesterol, liver triglycerides, ALT and liver weight. In all, fructose appeared to have more of an effect than sucrose, but there were less studies published with fructose compared with sucrose. Additionally, these findings are consistent with the effects of liquid sugars, like those found in sugar sweetened beverages, on the liver18. It is interesting that a number of the studies, while measuring ALT did not report or measure other liver function markers such as aspartate aminotransferase (AST), gamma-glutamyl transferase (GGT), albumin, or bilirubin. These markers, in addition to some histological analysis of liver tissue, would support the findings that high-sugar feeding increases MASLD risk. It is notable that the confidence intervals are augmented in many of the liver parameters, especially when subsetting as some of the subsets have small numbers of studies available, suggesting that an increase in study number may strengthen findings. A more standardised approach to measuring liver function parameters in mouse studies would benefit findings by increasing study numbers and making studies more comparable. The parameters we were able to analyse suggest that high-sugar feeding, particularly fructose, is detrimental to liver function despite having no profound effect on body weight.
Excess fructose consumption has been linked through observational population studies to an increase in insulin resistance in humans19,20,21. The mechanistic link between fructose and insulin resistance has, however, not been fully elucidated. Fructose generally produces smaller insulin excursions than glucose, thought to be protective against insulin resistance22. While we did not aim to study risk of metabolic diseases such as diabetes in this meta-analysis, glucose homoeostasis is an important metric to understand the metabolic milieu produced by high-sugar feeding. We saw a significant positive effect of high-sugar feeding on fasting glucose and glucose AUC but not fasting insulin. Again, these findings seem to be more apparent in fructose than sucrose feeding and in mice than in rats. Notably, many studies did not report the insulin response to an oral glucose tolerance test making it harder to determine the overall effect of high-sugar feeding on glucose homoeostasis. Although there were some changes in glucose AUC, we did not see an increase in body weight, and adiposity data was not available. These finding suggest that sugar feeding may play a role in dysregulating glucose homoeostasis, however, the story is not completely clear.
There was no significant effect of sugar-feeding on plasma leptin levels in rodents, which concurs with the bodyweight data and implies that adiposity is also not increased. However, there was a positive significant effect of sugar on plasma triglycerides and cholesterol. In human studies, fructose consumption is often associated with a reduction in circulating leptin, which is thought to lead to overeating, but there was no evidence for these relationships in the preclinical data23. The positive effect on both plasma and liver triglycerides in this meta-analysis is supported by fructose containing sugars promoting DNL in the liver24,25. These same lipogenic properties are also thought to increase serum cholesterol which we also observed in this analysis. Both these parameters were also elevated in the liver26. These findings support the common theory that consumption of high fructose or sucrose diet promotes lipogenesis, particularly in the liver.
Overall, when taking these findings into account we must consider the evidence for publication bias, which was striking in some traits. Body weight, fasting insulin, and leptin all showed evidence for publication bias, indicating marginal or non-significant results were not submitted or not accepted for publication27,28. This bias means that we cannot fully evaluate the strength of an effect when studies are missing from the literature. It is notable that there were no studies left out for liver parameters, which is often the focus of sugar studies. However, missing so much data from body weight is troubling as changes in body weight has been hypothesised as the main driver of fructose related metabolic changes, and easy data to measure in rodent populations. This analysis indicates that if data is missing or left out because it isn’t significant that we are overestimating the magnitude of effect that sugar feeding has on metabolic health.
When performing the screening, eligibility, and analysis of the studies, it became apparent that we would not be able to look at sex, with only one study containing female data available and therefore, excluded. This is a significant limitation to our analyses as MASLD is an extremely sexually dimorphic disease, with the vast majority of human studies suggesting that males are significantly more susceptible to MASLD, however once females go through menopause they lose this protection29. One reason for this disparity could be the long-held belief that hormonal cycles in female mice confound results too much, although this belief has been shifting in previous years. For animal models to become more robust and replicate findings from human population studies they need to be able to make comments on the effects on both sexes, something we could not achieve in this analysis.
This meta-analysis showed that high-sugar feeding has an overall effect on liver pathogenesis and glucose homoeostasis. Limitations in the data show that there is a need for more studies to investigate solid sugar feeding in males and females with more focus on adiposity and energy expenditure. The consumption of fructose containing sugars is an important area of study, especially in liver pathogenesis, and the underlying mechanisms are important to elucidate and understand when considering translation to population health.
Methods
Eligibility criteria and literature search
We searched the literature for studies testing high-sugar exposure to an isocaloric no sugar control diet in rodent models and used published methodologies for the systematic review, which are based on the Cochrane Guidelines, Version 5.0.1 Part 2 General methods for Cochrane reviews30. In order to reduce bias during the literature search phase, inclusion and exclusion criteria were specified prior (Table 4). The criteria were guided by our central question for the systematic review: “What is the effect of high-sugar diets on the metabolic phenotype of mice and rats?” As the review focuses on high-sugar feeding it was necessary for carbohydrate portions of the diet to contain solid sugar. Liquid sugars were excluded as there are potential metabolic differences in the rate of digestion between the two forms as well as differences in regulation of energy intake31. Additionally, energy from fat was restricted to less than 30% in order to reduce the confounding effects fat has on metabolic health by promoting adiposity and insulin resistance3. Sufficient protein intake was controlled at 10-25% of total energy intake. No time limit was imposed on publication date, however, full diet and macronutrient information must have been available.
Five databases, PubMed, Medline, Scopus, Web of Science, and Embase, were searched for articles containing high-sugar diets fed to mice or rats (Table 5). Boolean operators, alternate phrases and spellings, truncated search terms (using *) and quotation marks were used to ensure the literature search was as comprehensive and explicit as possible. The initial search was conducted on the 13th September 2019 and updated 19 April 2024.
A summary of the methodology is shown in Fig. 1. Firstly, we removed all duplicate articles. After duplicates were removed the abstracts of each paper were screened for the pre-set inclusion and exclusion criteria. The remaining articles were screened based on methodology. The reference lists of all included articles were obtained, and these articles were screened under the same procedure. Where relevant information was omitted, it was assumed that the article failed the specified standards for that point. An example of this is if the macronutrient or ingredient list of the diets were not available it was assumed that the article would not meet the requirements and was excluded. Studies including multiple different treatment groups were included as long as they contained appropriate control and high-sugar treatment groups with data only extracted from groups of interest. Female mice were excluded due to only 2 relevant studies.
Data extraction
The full text of the remaining articles were examined and the required information was extracted for the relevant comparator groups (i.e., high-sugar diet vs control), including mean, variance, and sample size of 12 traits (Table 1). Specific details of the animal studies were also collected including animal, strain, sex, age, and dietary information.
Data was collected primarily from text and tables, however, when they were unavailable the data was extracted from graphs using GetData Graph Digitizer software version 2.26 (GetData, Kogarah, Australia). To maximise the chances of detection of any effect of the high-sugar feeding, data was taken from the latest time point for each trait for each study. Standard error of the mean (SEM) was extracted from all studies. Where SEM was not available standard deviation (SD) was collected. When no SEM or SD was available but individual results were, SEM was calculated from that. Sample size was also collected. Where needed, SD were estimated following the quantile method described in the study of Wan et al. 32. All SEM values were back calculated to SD for the effect size calculations. Where more than one experimental group was provided but the control group was shared, the sample size was halved to prevent double counting of animals in the control group (which would yield inflated statistical power).
In addition to these data, moderator data was also collected to help interrogate how common categorical and continuous variables interact with high-sugar exposure within studies. The variables were type of sugar, species, sex, length of time on diet, dietary fat content, starting age, length of fasting time, and use of anaesthesia. Categorical variables (type of sugar, species and use of anaesthesia) were recorded as binary variables, fructose or sucrose, mouse or rat, male or female, and yes or no, respectively. Continuous variables (time on diet, fat content as percentage of total energy, age at starting, and fasting time length) were recorded as an integer with length of time on diet and starting age shown in days, fat content as percentage of total energy, and fasting length in hours. When fasting time was specified qualitatively in text, ‘short fasts’ were considered to be 6 hours and ‘overnight’ 15 h. In papers with no starting age, starting age was estimated with growth charts from animal suppliers if starting weight was available taking strain and sex into account. Where no starting age or weight was available the paper was excluded from that meta-regression. All continuous variables were scaled to SDs and mean-centred (i.e., z transformed) for ease of graphical representation.
Effect size calculation and analysis
For each experimental comparison within a study, Hedge’s d was calculated (hereafter, simply d). A standardised effect size, such as Hedge’s d, was selected as the different outcomes can have been reported in different units and scales (e.g., body mass in rats and mice differ in absolute magnitude). The following equations were used to calculate d and it’s sampling variance33.
We used the following three-step analytical procedure to analyse the data: 1. Meta-analysis 2. Meta-regression 3. Evaluation of publication bias.
The high-sugar diet groups were considered as the treatment group, therefore positive instances of d indicate a greater population mean in the sugar group than in the control group. d values of 0.3, 0.5 and 0.8 were considered small, moderate and strong differences, respectively33. All effect size calculations and subsequent meta-analyses were conducted using the statistical programming language R v3.3.1 (R Foundation, Vienna, Austria). The traits were analysed separately but identically. The initial step was implementing a random effects meta-analysis model (REMA)34. REMA estimates the overall magnitude and statistical significance of an effect using all data collected for a trait. REMA was implemented using the “rma” function in the metafor R package which fits each value of d as a response variable and the square of the SEd as a measure of sampling variance35. Full REMA output can be seen in Appendix Table S1. Additionally, the REMA model estimates heterogeneity or the differences among effects that cannot be attributed to sampling variance, which is expected in multispecies analysis27,36. Heterogeneity was deemed low, moderate or high for an I2 of 25%, 50% and 75% respectively27.
In the second step we implented random-effects meta-regressions (REMRs), which perform the same basic function as REMA, however, these include moderator variables to investigate the effects of different moderators on the magnitude of the reported effects. As above, REMR were implemented using the “rma” function in metafor. The linear predictors were z transformed to one SD, for ease of interpretation37. Full REMA output can be seen in Appendix Tables S2–5.
To complete the third step, we used two tests to assess for evidence of publication bias. The first test, an Egger’s regression, checks for funnel plot asymmetry by evaluating whether effect sizes are distributed as expected when sampling errors are taken into account27,38. The “regtest” function in metafor was used for this test. A p-value of <0.05 indicated significant evidence of bias. Additionally, we also performed a trim and fill analysis where the regtest was significant with the “trimfill” function in metafor, which estimates the number of effect sizes that are missing owing to bias and re-estimates the overall REMA mean effect, accounting for missing studies. Full publication bias output can be seen in Appendix Table S6 and funnel plots in Figures S1-S4.
For both REMA and REMR we interpreted statistical significance when the associated 95% confidence interval excluded 0.
Responses