The gain-of-function UBE3AQ588E variant causes Angelman-like neurodevelopmental phenotypes in mice

Background
UBE3A encodes a HECT (Homologous to E6AP C-Terminus) domain E3 ubiquitin ligase known to target substrate proteins for ubiquitination and subsequent degradation through the ubiquitin–proteasome pathway1. UBE3A is located within chromosome 15q11-13 and its expression is imprinted specifically in neurons such that only the maternal allele is expressed2,3,4,5. Deletion or null mutation of maternal UBE3A causes Angelman syndrome, a severe form of intellectual disability characterized by motor deficits, epilepsy, microcephaly, dysmorphic facial features, and a unique happy demeanor6. On the other hand, duplication or triplication of maternal chromosome 15q11-13, the genomic region that contains UBE3A, causes a prevalent genetic form of autism known as Dup15q syndrome7,8,9. Individuals with this syndrome usually exhibit autistic behaviors, motor dysfunction, intellectual disability, and epilepsy.
Emerging evidence strongly supports that excessive UBE3A activity alone is sufficient to drive neurodevelopmental phenotypes. A previous study identified a family with a microduplication in chromosome 15 encompassing only UBE3A and found this duplication segregates with behavioral disorders, mood disorders, and neuropsychiatric phenotypes10. More recently, we characterized single nucleotide, non-truncating variants in UBE3A using large scale functional analysis and found that ~ 12% of variants increase the ubiquitin ligase activity of the UBE3A enzyme, thereby representing gain-of-function mutations11. Individuals possessing these mutations in maternal UBE3A did not possess a diagnosis of Angelman syndrome and exhibited phenotypes that centered on autism, intellectual disability, and motor deficits11,12. However, these phenotypes were also highly heterogeneous and varied in their severity, raising questions as to how excessive UBE3A activity can lead to such pleiotropic phenotypes.
Here, we focus on the UBE3AQ588E mutation (Ube3aQ606E in mouse), which was identified originally as a maternally-inherited variant of uncertain significance (VUS) in an affected individual referred for genetic testing13. In a previous study, we tested the functional significance of this mutation along with two others that occurred at the same position (UBE3AQ588P and UBE3AQ588R). Whereas both UBE3AQ588P and UBE3AQ588R lacked discernible ubiquitin ligase activity, we found the UBE3AQ588E mutation caused an enzyme gain-of-function and increased UBE3A activity 388% above WT enzyme levels in vitro11. Neonatal mice carrying a maternally-inherited Ube3aQ606E mutation (Ube3amQ606E) possessed motor and communication deficits11, demonstrating that maternal transmission of the Ube3amQ606E variant was sufficient to cause neurodevelopmental dysfunction.
In the current study, we performed detailed phenotypic analysis of adult Ube3amQ606E mice with the goal of identifying behaviors perturbed specifically by UBE3A gain-of-function. Surprisingly, we found these mice possess phenotypes that closely align with those described for Angelman syndrome model mice that lack a maternal copy of Ube3a (Ube3am-/p+)14. These include microcephaly of postnatal onset, pronounced motor deficits, hypoactivity, and reduced stereotypic behaviors. Additional biochemical analyses demonstrated very low levels of UBE3A protein as well as an increased abundance of substrates described for UBE3A, suggesting the Ube3aQ606E mutation causes an overall loss of UBE3A function in vivo, likely through enhanced self-targeted degradation. These results suggest that UBE3A gain-of-function mutations can produce diverse molecular outcomes in vivo which likely contribute to the continuum of phenotypes observed in patients.
Results
Mice with a maternal Ube3a
Q606
E variant display deficits in strength and coordination tasks.
We previously characterized a mouse line possessing a knock-in gain-of-function mutation in Ube3a (Ube3aT503A; UBE3AT485A in human). Adult mice carrying a maternally-inherited mutation (Ube3amT503A) exhibit generally mild phenotypes that predominantly consist of increased locomotor activity15. Given that the Ube3aT503A mutation elevates UBE3A activity ~ 75% above WT enzyme levels11, we hypothesized that mice carrying the stronger Ube3aQ606E mutation (388% above WT enzyme activity) on the maternal allele would exhibit pronounced behavioral phenotypes that could be attributed specifically to UBE3A gain-of-function (Fig. 1A).

Ube3amQ606E causes motor deficits. (A) Graphical depiction of the Ube3amQ606E breeding scheme. (B) Graphical depiction of the behavioral assay timeline. (C–E) Latency to fall from an accelerating rotarod for all animals (C), male (D) and female (E) mice. Values represent the mean ± SE. WT n = 17: 10 male, 7 female; Ube3amQ606E n = 22, 15 male, 7 female. Repeated measures ANOVA; *p < 0.05. (F) Hang time on inverted mesh wire screen. WT n = 16: 9 male, 7 female; Ube3amQ606E n = 20: 13 male, 7 female. Mann–Whitney U Test, 2-tailed (exact significance). (G) Time to turn head-downward on a vertical pole. Values represent the median ± range. WT n = 17: 10 male, 7 female; Ube3amQ606E n = 22: 15 male, 7 female. Mann–Whitney U Test, 2-tailed (exact significance); *p < 0.05. (H) Time to descend from a vertical pole. Values represent the median ± range. WT n = 17: 10 male, 7 female; Ube3amQ606E n = 22: 15 male, 7 female. Mann–Whitney U Test, 2-tailed (exact significance); *p < 0.05. (I) Average startle response to a 120 dB tone above background. Values represent the mean ± SE. WT n = 17: 10 male, 7 female; Ube3amQ606E n = 21: 14 male, 7 female. Statistical significance was tested using UNIANOVA. (J) Percentage inhibition of startle following a pre-pulse tone. WT n = 17: 10 male, 7 female; Ube3amQ606E n = 21: 14 male, 7 female. Statistical significance was tested using repeated measures ANOVA.
Ube3amQ606E mutant mice underwent extensive behavioral assessments from 5–15 weeks of age (Fig. 1B). To determine deficits in motor ability, animals were trained on a rotarod for three subsequent days and the amount of time the mouse was able to remain on the rod was recorded. Ube3amQ606E mutants showed no significant difference in their baseline ability to balance on a stationary rotarod (Fig. S1A). When introduced to a rod rotating at a constant rate, a difference in ability to remain on the rod began to appear (Fig. S1B). We next measured performance on an accelerating rotarod. Overall, we found that Ube3amQ606E mice performed worse compared to WT littermates (Fig. 1C). Although an apparent pronounced difference was observed for male mice compared to female mice in this task (Fig. 1D and 1E), we note this was likely due to the difference in performance between WT male and female animals.
To further understand the extent and nature of motor deficits present in the mutants, we introduced animals to a battery of sensorimotor tests for both gross and fine motor movements. We began tests of gross motor ability with a walking initiation test, measuring the time required for a mouse to exit a 24 × 24 cm square on a flat surface. The test yielded no significant differences between Ube3amQ606E mice and their WT littermates (Fig. S1C). Moreover, we observed no significant differences in basic balance ability on the ledge and platform tasks (Fig. S1D and S1E), nor in the time to climb to the top of a 60° or 90° incline (Fig. S1F and S1G). A test of grip strength revealed no significant difference in time to fall. However, we observed that only Ube3amQ606E mice fell from the screen before the time limit of 60 s (Fig. 1F). As a measure of fine motor coordination and strength, we conducted a pole performance test, in which mice were placed head-upward on a vertical pole and the time to turn head-downward and time to climb to the bottom was measured. In both regards, Ube3amQ606E mice performed worse compared to WT littermates (Fig. 1G and 1H). Analyzing these results by sex revealed that males performed moderately worse for turning on the pole.
To test for differences in sensorimotor reactivity and gating, acoustic startle and pre-pulse inhibition (PPI) tests were performed as previously described16,17. Genotype did not predict startle reactions (Fig. 1I), suggesting that basic motor reflexes are not affected in Ube3amQ606E animals at this timepoint. There was similarly no effect of genotype on PPI, indicating that mutant animals have no disruption in the ability to filter out stimuli or attend to stimuli (Fig. 1J).
Ube3a
mQ606E mice display hypoactivity with only minor deficits in anxiety-like behaviors, learning, and memory
In the open field assay, we found that the total distance traveled by Ube3amQ606E mutants was reduced compared to WT littermates (Fig. 2A), and entries into both the center circle and the perimeter were correspondingly fewer (Fig. S2A and S2B). This was in stark contrast to Ube3amT503A mice, which show increased locomotion15. We also observed that Ube3amQ606E mutants strongly trended towards increased time at rest (Fig. 2B). As for anxiety-like behaviors, we found that there was no significant difference between WT and mutants in time spent in the center or perimeter (Fig. 2C and Fig. S2C). We found that males comparatively spent significantly more time at rest in the center of the open field (Fig. 2D), while there was no difference in time at rest in the perimeter (Fig. S2D).
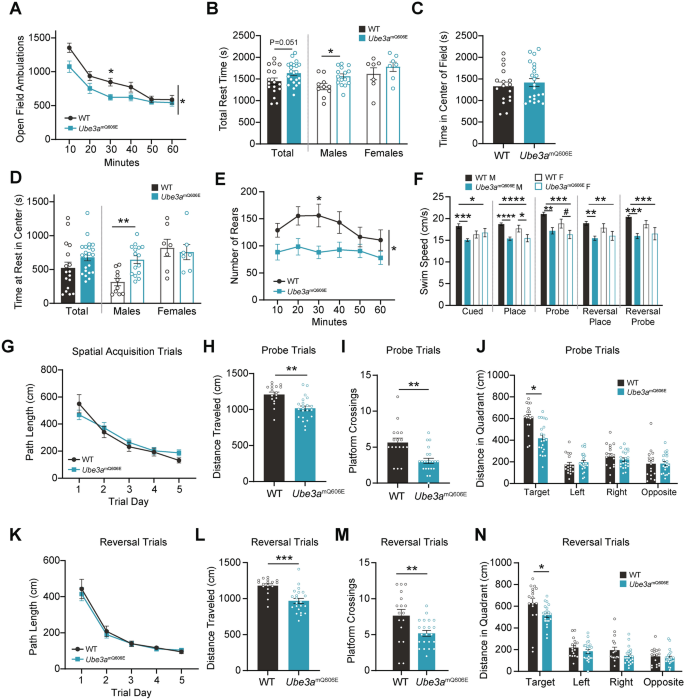
Ube3amQ606E causes hypoactivity. (A) Open Field Assay: number of beam crosses (“ambulations”) over the 60-min course of the trial. Timepoints represent the average number of ambulations ± SE binned for a 10-min period. WT n = 17: 10 male, 7 female; Ube3amQ606E n = 22: 15 male, 7 female. Repeated measures ANOVA; *p < 0.05. (B) Total time spent at rest during the open field test. Values represent the mean ± SE. UNIANOVA; *p < 0.05. (C) Time spent in the center circle of the open field. Values represent the mean ± SE. UNIANOVA. (D) Time spent at rest in the center circle of the open field. Values represent the mean ± SE. UNIANOVA; **p < 0.01. (E) Number of rearing events in the open field test. Timepoints represent the average number of rears ± SE binned for a 10-min period. Repeated measures ANOVA; *p < 0.05. (F) Swim speed measured during different phases of the Morris Water Maze. Values represent the mean ± SE. WT n = 17: 10 male, 7 female; Ube3amQ606E n = 22: 15 male, 7 female. UNIANOVA; *p < 0.05, **p < 0.01, ***p < 0.001, ****p < 0.0001, #p = 0.051. (G) Path length taken to the platform during spatial acquisition trials. Values represent the mean ± SE. Statistical significance was tested using repeated measures ANOVA. (H) Total distance travelled over the course of the probe trial. Values represent the mean ± SE. UNIANOVA; ***p < 0.001. (I) Number of times the animal crossed over the platform zone in the probe trial. Values represent the mean ± SE. UNIVANOVA; **p < 0.001. (J) Total distance traveled in each quadrant during the probe trial. Values represent the mean ± SE. UNIANOVA; ***p < 0.001. (K) Path length taken to the platform during reversal spatial acquisition trials. Values represent the mean ± SE. Statistical significance was tested using repeated measures ANOVA. (L) Total distance traveled over the course of the reversal probe trial. Values represent the mean ± SE. UNIANOVA; ***p < 0.001. (M) Number of times the animal crossed over the platform zone in the reversal probe trial. Values represent the mean ± SE. UNIVANOVA; **p < 0.01. (N) Total distance traveled in each quadrant during the reversal probe trial. Values represent the mean ± SE. UNIANOVA; *p < 0.05.
Hind-limb rearing is considered a motor coordination-dependent exploratory behavior which has been shown to be affected in Ube3a-related mouse models18. We observed that both male and female Ube3amQ606E mice showed fewer vertical rears at all timepoints, indicating that they have decreased exploratory habits (Fig. 2E). This finding may be explained by decreased hind limb strength, as shown in the motor battery, as well as by general hypoactivity.
Next, we employed the Morris Water Maze assay, a widely used test for deficits in spatial learning and memory. The first set of trials were cued trials, in which mice swam to a visible escape platform. These trials were to assess baseline swimming behavior. We found that swim speed was reduced in our mutant mice (Fig. 2F), which was a variable that we considered throughout our interpretation of performance in this assay. To test learning ability, the second set of trials were spatial acquisition trials, in which the platform was hidden, and spatial cues were placed on the walls by which the animals learned to navigate. Here, mutant mice showed an increased latency to reach the hidden platform (Fig. S2E), which is normally interpreted as a deficit in spatial learning; however, the total path length to the platform was unaffected (Fig. 2G). Therefore, we conclude that Ube3amQ606E mutants exhibit reduced swim speeds and do not show spatial acquisition deficits.
To test spatial memory, we performed “probe” trials in which the platform was removed entirely in order to assess the animals’ memory for its former position. Again, we observed slower swim speeds in mutant animals, and total distance traveled over the course of the minute-long trial was significantly reduced (Fig. 2H). In line with this, mutants crossed over the platform’s former location fewer times (Fig. 2I). In probe trials, a mouse spending less time in the target quadrant is traditionally interpreted as an indicator of memory deficits. The time in the target quadrant for Ube3amQ606E was significantly reduced (Fig. S2F), but this effect was again confounded by their slower swim speeds. Further investigation of distance showed that mutants traveled a significantly lower distance within the target quadrant, and that their path efficiency to the target area was significantly higher than WT (Fig. 2J and Fig. S2G). Putting all this information together, we conclude that the mutants show only reduced swimming speeds, but not learning deficits.
To test flexibility in learning and cognition, we performed reversal trials, in which the spatial acquisition and probe trials were repeated, but with the platform now placed in the opposite quadrant. As before, swim speeds were reduced, although the latency to the platform was unaffected (Fig. S2H). Mutants showed no difference in path length (Fig. 2K). In the reversal probe trial, the total distance traveled over the course of the minute-long trial was reduced and mutants crossed the platform location fewer times (Fig. 2L and 2M). Time spent in the target quadrant was unaffected (Fig. S2I), and distance in the target quadrant was reduced (Fig. 2N). Together, our data indicate that Ube3amQ606E mice display hypoactivity, but no learning deficits.
The Ube3a
Q606
E variant does not cause effects on psychological or social behaviors
We next tested Autism and ADHD-relevant deficits in stereotypic, depressive-like, and social behavior. We explored changes in stereotypic behaviors with a marble-burying assay, which takes advantage of a mouse’s natural tendency to bury marbles placed on top of the bedding of their cage. Mutant animals showed a marked decrease in the number of marbles buried compared to WT littermates (Fig. 3A). The forced swim task has been used in previous UBE3A-related mouse models as an output for depressive-like passive coping behavior. In this task, we observed that Ube3amQ606E mice showed no differences in immobility time (Fig. 3B).
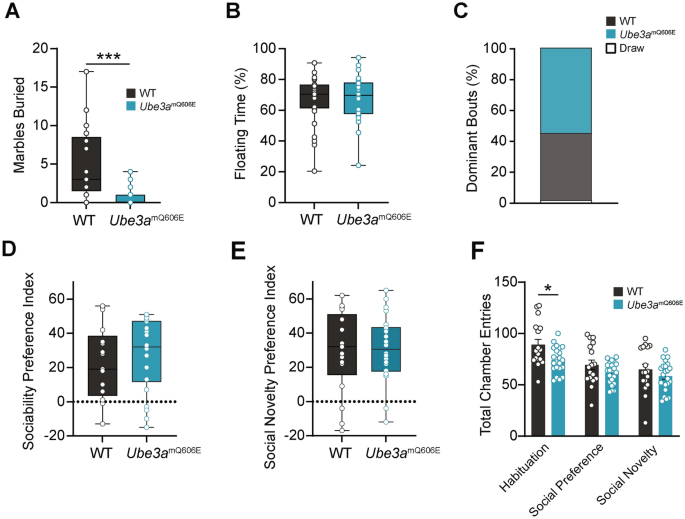
Ube3amQ606E causes decreased stereotypic behavior, but no change in social or depressive phenotypes. (A) Number of marbles buried. WT n = 17: 10 male, 7 female; Ube3amQ606E n = 22: 15 male, 7 female. Values represent the mean ± range. Mann–Whitney U Test, 2-tailed (exact significance); ****p < 0.0001. (B) Percent of time spent floating (inactive, only minimal movements to keep head above water) in the forced swim test. Values represent the mean ± range. WT n = 27: 15 male, 12 female; Ube3amQ606E n = 26: 10 male, 16 female. Mann–Whitney U Test, 2-tailed (exact significance). (C) Tube Test: percentage of “dominant” bouts; i.e. in which an animal caused its opponent to back out of the tube. WT n = 17: 10 male, 7 female; Ube3amQ606E n = 17: 10 male, 7 female. Pearson’s Chi-Square test, 2-sided (exact significance). (D–E) Social preference indexes in the 3-chamber social approach assay. (E) depicts preference for a novel, conspecific mouse over an empty cup. Values represent the mean ± range. (F) depicts preference for a novel conspecific over a familiar conspecific. WT n = 17: 10 male, 7 female; Ube3amQ606E n = 22: 15 male, 7 female. UNIANOVA. (F) Number of total entries into either chamber over the course of the trial period in the 3-chamber task. Values represent the mean ± SE. UNIANOVA; *p < 0.05.
To assess differences in social dominance, we used a tube test, in which mice are placed on opposite ends of a tube and the mouse that does not back out of the tube is considered the dominant animal. Here, we found no impairments in social dominance or recognition of hierarchy, as mutant Ube3amQ606E mice achieved a similar number of dominant bouts as WT (Fig. 3C). Finally, to assess differences in social preferences we introduced mice to the 3-chamber social approach assay. Ube3amQ606E mutants showed no difference from WT animals in their preference for either a novel object or an unfamiliar, sex-matched wild-type C57BL/6 mouse (Fig. 3D and 3E). However, consistent with our observations in the open field and Morris water maze assays, mutants displayed hypoactivity, as evidenced by fewer entries into either chamber across all trials (Fig. 3F). These results show that the Ube3amQ606E variant has no effect on sociability, social novelty preference, or social dominance performance. Together, the Ube3amQ606E mouse shows increased stereotypic behaviors, but no social or depressive differences, and only somewhat lessened anxiety behaviors, as seen in the open field assay.
Ube3a
Q606E mice display acquired microcephaly
Our behavioral assessments of Ube3amQ606E animals indicated a large degree of overlap with phenotypes described for Ube3am-/p+ mice14. We next turned our attention to microcephaly, a neuroanatomical phenotype that is present in both individuals with Angelman syndrome and in mouse models19. We collected whole brain weights in Ube3amQ606E mice from postnatal day zero to eight months of age. We found these animals exhibited reduced brain weights during the postnatal period (Fig. 4A and 4B). This decrease in brain weight was independent of body mass (Fig. 4C) and we observed that brain weights of mutants differed significantly from WT littermates by postnatal day five (Fig. 4B).
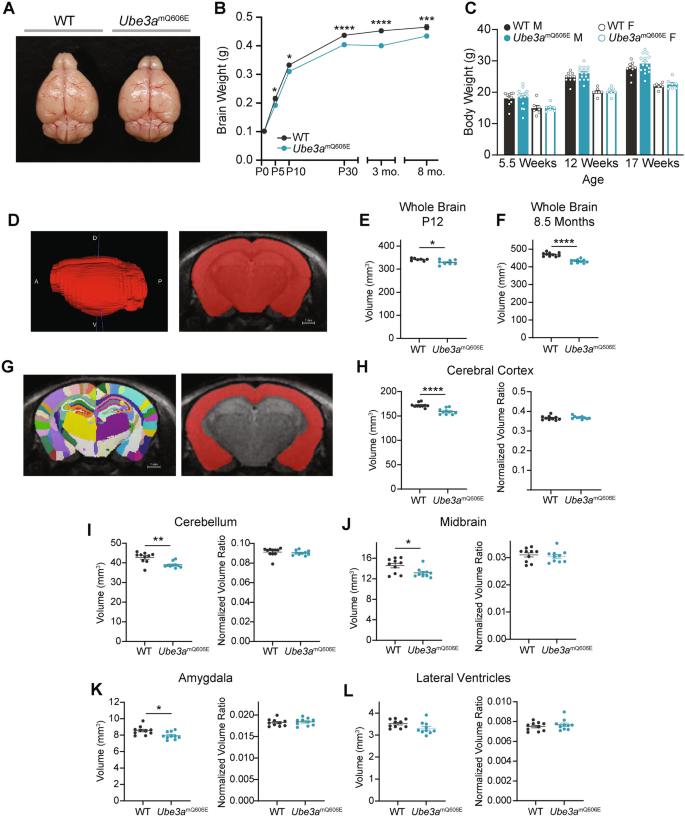
Ube3amQ606E mice display microcephaly with a postnatal onset. (A) Representative image of 3-month WT (left) and Ube3amQ606E (right) brains post gross dissection. Brain weights were 0.44 and 0.43 g, respectively. (B) Cross-sectional analysis of littermate WT and Ube3amQ606E postmortem brain weights. Values represent the mean ± SE in grams (g). P1: WT n = 24, mUbe3aQ606E n = 13; P5: WT n = 11, mUbe3aQ606E n = 10; P10: WT n = 11, Ube3amQ606E n = 12; P30: WT n = 27, mUbe3aQ606E n = 28; 3 month: WT n = 13, mUbe3aQ606E n = 9; 8 month: WT n = 12, Ube3amQ606E n = 14. Genotype effect from 2-way ANOVA with Tukey’s multiple post-hoc analysis for within-subject comparisons; *p < 0.05, ***p < 0.001, ****p < 0.0001. No significant sex-dependent effect was observed. (C) Body weights of animals used in behavioral studies. Values represent the mean ± SE. WT n = 17: 10 male, 7 female; Ube3amQ606E n = 22: 15 male, 7 female. Statistical significance was tested using an unpaired t-test. (D) Representative MR image of adult whole brain (left) and coronal segmentation. A – anterior, P –posterior, D – dorsal, V – ventral. (E) Quantification of whole brain volume in postnatal day 12 mice. WT n = 8; 5 male, 3 female; Ube3amQ606E n = 8; 3 male, 5 female; 2-way ANOVA; *p < 0.05. (F) Quantification of whole brain volume in 8.5 month mice. WT n = 10; 5 male, 5 female; Ube3amQ606E n = 10; 5 male, 5 female. 2-way ANOVA; ****p < 0.0001. (G) Representative image of brain segmentation as viewed from a coronal section (left) and example segmentation of cerebral cortex (right). (H–L) Quantification of absolute volumes (left) and volumes normalized to whole brain volume (right) of regions of interest in 8.5 month old mice: cerebral cortex (E), cerebellum (F), midbrain (G), amygdala (H), and lateral ventricles (I). *p < 0.05, 2-way ANOVA; **p < 0.01, ****p < 0.0001.
We further interrogated brain size and structure by conducting anatomic magnetic resonance imaging (MRI) and diffusion tensor imaging (DTI), which allow for in vivo structural analysis of the whole brain. (Representative image, Fig. 4D). As expected, whole-brain volume was reduced at both postnatal day 12 (P12) and at 8.5 months of age (Fig. 4E and 4F), indicating neuroanatomical deficits throughout the lifespan. We found no gross structural differences in mutant brains. We next analyzed segmented brain regions of interest (representative image, Fig. 4G). All regions analyzed, including the cerebral cortex, cerebellum, midbrain, and amygdala, showed significantly reduced brain volumes, whereas lateral ventricle volumes were unchanged (Fig. 4H–4L). However, no region was affected disproportionately to whole brain volume, indicating a global effect on brain size (Fig. 4H–4L). When we performed DTI to examine white matter tracts (representative image, Fig. S3A), we found that similar to all other brain regions, absolute white matter volume was significantly reduced (Fig. S3B–S3D). Altogether, these results suggest that Ube3amQ606E animals possess microcephaly, similar to the microcephaly widely reported in Angelman syndrome model mice.
The Ube3aQ606
E variant causes subtle changes to the global brain proteome
We next sought to uncover the molecular pathways affected by the Ube3amQ606E mutation in the developing brain. To achieve this, we conducted tandem mass tag proteomic analysis on lysates derived from the cortex of P1 animals (experimental workflow, Fig. 5A). We found that the abundance of only a few proteins were significantly altered in the Ube3amQ606E cortex (Fig. 5B; Table S2). In mutant animals, UBE3A itself was the only significantly downregulated protein. Paradoxically, all other differentially abundant proteins were upregulated. These included the HECT domain E3 ubiquitin ligase HERC2, whose encoding gene resides in chromosome 15q11-13, and is known to physically interact with UBE3A and stimulate its ubiquitin ligase activity20. Mutations in HERC2 are linked to a neurodevelopmental disorder with phenotypic overlaps with Angelman syndrome21,22. BOD1, a protein characterized in chromosome orientation, is known to localize to the synapses, and its dysregulation has been linked to schizophrenia and intellectual disability23,24. SOGA1 is a microtubule-associated protein involved in glucose production and chromosome segregation that is expressed almost exclusively in the brain25. Differentially upregulated proteins reached significance only in female animals (Fig. S4A and S4B), however, as many of these proteins showed trends toward significance in male animals (Table S2), we conclude these differences likely arose from variations in our samples and not due to sex-specific effects. In addition to HERC2 and SOGA1 upregulation in females, we found upregulation of REXO2, an oligoribonuclease involved in mitochondrial maintenance26, and the deubiquitinating enzyme UCHL5, which is proposed to be a substrate of UBE3A27.
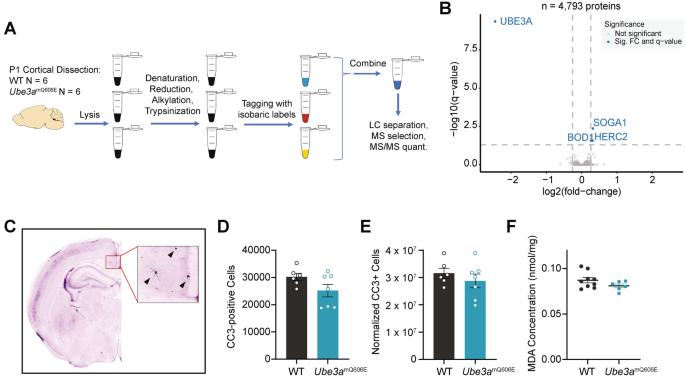
Proteomic alterations and apoptosis in Ube3amQ606E mutants are lacking. (A) Schematic showing tissue collection and processing for proteomics. (B) Volcano plot depicting differentially regulated proteins for pooled samples. Significantly differentially regulated proteins are indicated in blue. P-values were adjusted with Benjamini–Hochberg multiple comparison correction (FDR = 0.05). All proteins with p-values, log2FC, and FDR are provided in Table S1. (C) Representative image of cleaved caspase 3 immunohistochemistry. Arrowheads point to CC3-positive neurons. (D) Total number of cleaved caspase 3 cells in whole brain as estimated by stereological results. Values represent the mean ± SE. 2-way ANOVA with Sidak’s multiple testing correction. (E) Total number of cleaved caspase 3 cells in whole brain normalized to whole brain volume as estimated by stereological results. Values represent the mean ± SE. 2-way ANOVA with Sidak’s multiple testing correction. (F) Lipid Peroxidation (MDA) Assay for amount of lipid peroxidation in adult (3.5 month) cortical lysate. Values represent the mean ± SE. 2-way ANOVA with Sidak’s multiple testing correction.
We next turned to pathway analysis to analyze broad trends in the proteomic landscape. We used the Gene Ontology Cellular Component (GO:CC) database, which was used in a previous study that examined the proteome of Angelman syndrome model mice27. When we examined the top 500 differentially regulated proteins, we found an enrichment in pathways related to the mitochondria and the glutamatergic synapse (Fig. S4C). These responses were driven predominantly by downregulated proteins as an analysis of the top 500 downregulated proteins showed an enrichment of near identical pathways (Fig. S4D). We found an enrichment of pathways related to aminoacyl tRNA synthetase and the proteasome when we analyzed upregulated proteins. Intriguingly, these pathways were similar to ones identified in Ube3am-/p+ mice in a previous proteomics study (Fig. S4E)27, suggesting considerable overlaps between Ube3am-/p+ and Ube3amQ606E animals.
Our proteomic analysis implicated pathways related to mitochondrial dysfunction, and we next examined whether these pathways led to increased cell death in the brain, thereby accounting for the microcephaly observed in Ube3amQ606E mice. Notably, microcephaly due to increased apoptosis would mark a mechanistic divergence from microcephaly in Ube3am-/p+ mice19. To test this possibility, we conducted immunohistological staining for cleaved caspase 3 (CC3), a marker of cell death via apoptosis. We collected brain tissue from postnatal day seven (P7), a timepoint which falls at the tail end of a period of extensive programmed cell death in the neonatal mouse brain28,29. To measure total amount of cell death in the whole brain, we conducted unbiased stereology, imaging a standardized set of coronal sections spanning the whole brain to extrapolate the total number of CC3-positive cells (representative image, Fig. 5C). We found there was no significant difference in apoptosis between WT and Ube3amQ606E brains (Fig. 5D and 5E). Next, we examined the buildup of lipid peroxides, which is caused by increased reactive oxygen species in the cell and leads to cell membrane damage and eventual cell death. We conducted a lipid peroxidation assay on cortical lysates derived from 3.5 month old mice and found no significant difference between the amount of lipid peroxidation in WT and mutant mice (Fig. 5F). Together, these results suggest that increased apoptosis in the brain does not account for the microcephaly observed in Ube3amQ606E animals.
The Ube3a
Q606
E variant causes a loss of UBE3A activity in vivo
Thus far, our data suggested that Ube3amQ606E mice have a high degree of overlap in behavioral and neuroanatomical phenotypes with Ube3am-/p+ animals. Moreover, our proteomics data suggested that UBE3A protein abundance was low in brains of Ube3amQ606E mice. These observations led us to consider the possibility that the Ube3aQ606E mutation, despite increasing UBE3A activity in vitro, represents a loss of activity in vivo due to a reduced abundance of UBE3A protein. To test this directly, we performed western blot analysis using protein samples extracted from the cortex and hippocampus. We first examined the abundance of UBE3A protein in the brains of Ube3amQ606E mice and compared it to levels found in WT and Ube3am-/p+ animals. We found that Ube3amQ606E mice possessed ~ 20% of UBE3A protein levels found in WT animals, which surprisingly, was similar to residual UBE3A levels found in the brains of Ube3am-/p+ animals (Fig. 6A–6H; original blots in Fig. S6 and S7). This indicated that Ube3amQ606E animals have a near complete loss of UBE3A protein in the brain.
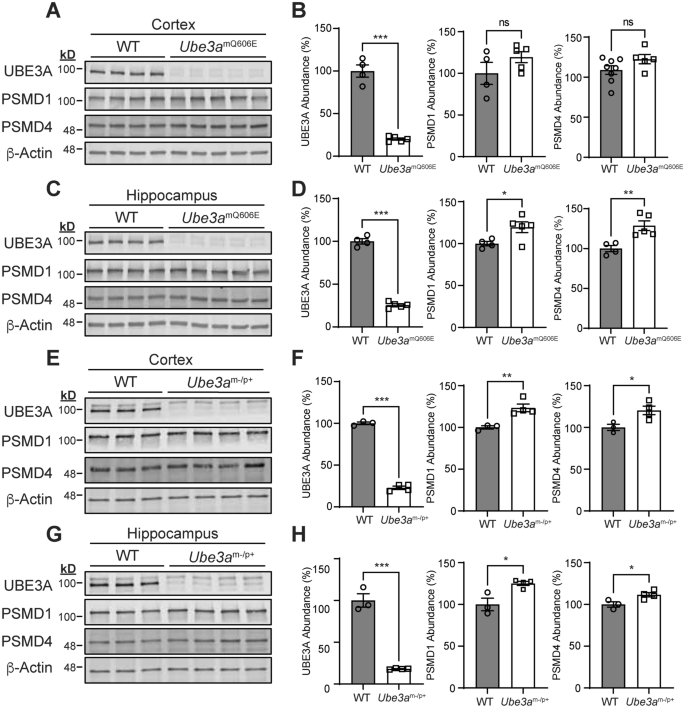
The Ube3amQ606E mutations causes an overall loss of UBE3A activity in vivo. (A–D) Western blot analysis and quantification of proteins extracted from the cortex (A,B) and hippocampus (C,D) of age P21 WT and Ube3amQ606E animals. WT n = 4; Ube3amQ606E n = 5; *p = 0.03, **p = 0.01, ***p < 0.01, Unpaired t-test. (E–H) Western blot analysis and quantification of proteins extracted from the cortex (E,F) and hippocampus (G,H) of age P21 WT and Ube3am-/p+ animals. WT n = 3; Ube3am-/p+ n = 4; *p = 0.03, **p = 0.01, ***p < 0.01, Unpaired t-test.
Our previous work11, as well as the work of others30, showed the human UBE3AQ588E mutation leads to enhanced self-targeted ubiquitination, leading to lower levels of UBE3A protein in cells. However, to rule out this mutation introducing structural instability within UBE3A, we introduced a second ligase-dead mutation (C820A) into a plasmid encoding human UBE3AQ588E (UBE3AQ588E-LD) and expressed it alongside a ligase-dead only plasmid (UBE3A-LD) in HEK293T cells. We reasoned that if the UBE3AQ588E mutation causes structural instability, then it should be reflected in lower levels of UBE3AQ588E-LD protein compared to UBE3A-LD. Our results indicated no difference in protein levels, suggesting the low level of protein in Ube3amQ606E mice likely occurs due to the enhanced self-targeted degradation of UBE3A (Fig. S5A–S5C; original blots in Fig. S8).
Finally, we tested how the Ube3amQ606E mutation affects UBE3A activity toward its substrates in vivo. We examined protein levels of PSMD1 and PSMD4, two components of the proteasome that are ubiquitinated by UBE3A in vitro and shown to be decreased in the brains of mice possessing a Ube3amT503A gain-of-function mutation15,31. When we examined PSMD1 and PSMD4 abundance in Ube3am-/p+ animals, we found a slight increase in the levels of both proteins in the cortex and hippocampus, confirming that these proteins are sensitive to overall UBE3A activity in neurons (Fig. 6E–6H). Likewise, we found an increase in the abundance of both proteins in the hippocampus and a trend in the cortex in Ube3amQ606E (Fig. 6A–6D). Considering all of these data, we conclude the Ube3aQ606E mutation has an overall loss-of-function effect on UBE3A in vivo.
Discussion
The phenotypic outcomes of UBE3A gain-of-function variants are not fully understood. In previous work, mice carrying a maternal Ube3aT503A mutation that increases UBE3A activity ~ 75% above WT enzyme levels, were shown to possess generally mild phenotypes consisting of increased locomotive behaviors15. Here, we hypothesized that a stronger Ube3aQ606E gain-of-function mutation (388% above WT) would result in pronounced phenotypes, thereby allowing us to identify specific behavioral domains caused by excessive UBE3A activity. Surprisingly, we found that Ube3amQ606E animals exhibited phenotypes similar to Angelman syndrome model mice including motor deficits and microcephaly with a postnatal onset. Proteomic and biochemical analyses of brain tissue from these animals revealed that UBE3A was nearly undetectable, and we found an increased abundance of the UBE3A substrates PSMD1 and PSMD4 in the hippocampus. Altogether, these data suggest that despite exhibiting increased activity in vitro, the Ube3aQ606E mutation has an overall inhibitory effect in vivo, likely through increased self-targeted degradation.
It is well established that gain-of-function variants of UBE3A typically enhance their own ubiquitination and degradation11,12,15. While both the Ube3amT503A and Ube3amQ606E mutations lower the abundance of UBE3A protein in the brain, our study found that their effects on adult mouse behaviors are divergent. One possibility that may account for this difference is that neurons are highly sensitive to the levels of hyperactive UBE3A protein in the cell. Whereas Ube3amT503A mice possess 39% of UBE3A levels in the cortex compared to WT mice15, we found that Ube3amQ606E animals possess roughly half that amount (~ 20%), which is in line with levels of residual UBE3A that remain in the brains of Ube3am-/p+ animals (Fig. 6E–6H). Thus, it is possible that even moderate differences in the abundance of a hyperactive enzyme can dictate whether an overall loss or gain-of-function effect is achieved in the cell. A second possibility is that gain-of-function mutations differentially affect how UBE3A targets itself versus its substrates32. For example, we previously demonstrated the Ube3aT503A mutation causes enzyme gain-of-function by enhancing the binding between UBE3A and its substrates12. In contrast, we found the Ube3aQ606E mutation enhances the ability of UBE3A to bind ubiquitin molecules at its exosite, thereby enhancing its ability to form polyubiquitin chains on substrate proteins11. Such mechanistic differences may dictate how UBE3A decides to target itself or a substrate protein for ubiquitination. Although the details of this decision process are poorly understood, it is worth noting that other variants of UBE3A (notably UBE3AT106P and UBE3AI130T) have been observed to cause a loss-of-function due to enhanced self-targeted degradation12,30. These observations suggest there is a subclass of causative Angelman syndrome mutations resulting from the constitutive self-degradation of UBE3A.
Our mass spectrometry analysis identified very few changes in the cortical proteomes of Ube3amQ606E animals. Among individual proteins, UBE3A was the only significantly downregulated protein whereas HERC2, BOD1, and SOGA1 were all found to be upregulated (Fig. 5B). Although further study is clearly needed, we consider it unlikely these proteins represent substrates of UBE3A. In particular, HERC2 is known to bind and stimulate the ubiquitin ligase activity of UBE3A, but it was determined not to be a substrate20. For BOD1 and SOGA1, these proteins have not been identified as substrates or interactors of UBE3A in other studies. We also found that female mice exhibited more robust changes in their proteomes compared to male animals (Fig. S4A and S4B). However, this observation runs counter to our behavioral characterization where male Ube3amQ606E mice exhibited somewhat exaggerated phenotypes (i.e., rotarod, pole turning, open field). Based on these observations, we conclude that sex-dependent differences in our proteomics results likely reflect inconsistencies in sample preparations, but additional study is required to resolve this discrepancy.
At the pathway level, we found an enrichment of proteins involved in the aminoacyl-tRNA synthetase multienzyme complex and the proteasome complex (Fig. S4C–S4E). Intriguingly, this replicated findings from a previous study that examined proteomes from the cortex of Ube3am-/p+ mice27. As our study validates these results in an independent UBE3A loss-of-function model, our results raise the intriguing possibility that these pathways play an important role in the etiology of Angelman syndrome phenotypes.
Finally, our results have implications for the treatment of at least some individuals with gain-of-function mutations in UBE3A. There are currently intense efforts to develop antisense oligonucleotides (ASOs) that target the imprinting mechanism of UBE3A to reinstate expression of the paternal gene33,34. As our study demonstrates the Ube3amQ606E mutation causes a near complete loss of UBE3A protein in the brain as well as loss-of-function phenotypes in mice, it stands to reason that reinstating the WT copy of paternal UBE3A in this model may rescue behavioral phenotypes observed in these animals. Although this raises an interesting possibility for therapeutic development, our results also suggest the in vivo impact of each UBE3A gain-of-function mutation is neomorphic and thus, must be carefully weighed with empirical data.
Conclusions
This study shows that Ube3amQ606E mice show behavioral phenotypes distinct from previous reports of UBE3A gain-of-function mouse models and instead, show considerable overlaps with phenotypes described for Angelman syndrome mouse models. Ube3amQ606E animals exhibited deficits in fine motor strength and coordination along with hypoactivity. We did not observe changes in learning, memory, psychological or social behaviors. In addition, we found that Ube3amQ606E mice develop global microcephaly with a postnatal onset. MRI characterization showed that white matter was reduced proportionately to global microcephaly. Our proteomic screen of neonatal cortical lysate revealed mild upregulation of several proteins of interest and enrichment of pathways related to the mitochondria, glutamatergic synapses, and protein synthesis. Finally, we found that microcephaly is not caused by increased apoptotic cell death.
Methods
Animal husbandry
Our research complies with all relevant ethical and ARRIVE (Animal Research: Reporting of In Vivo Experiments) guidelines. All animal procedures were done in accordance with the guidelines for the ethical treatment of animals as approved by the Washington University Institutional Animal Care and Use Committee under protocol #22–0293. Animals were housed in a standard barrier facility with a 12:12 light:dark cycle, with temperature set 20–22 °C , and a relative humidity of 50%. Food and water were available to the animals ad libitum. All euthanasia was performed by CO2 asphyxiation followed by cervical dislocation unless otherwise noted. Ube3amQ606 mice used in this study were described in a previous publication11. Ube3am-/p+ animals were obtained from Jackson Laboratories (#016,590). For both lines, mutations were maintained on the paternal allele by crossing Ube3amWT/pQ606E or Ube3am+/p- males to WT C57BL/6 J females (Jackson Labs #000,664). All experimental mice used in experiments were generated by crossing Ube3amWT/pQ606E or Ube3am+/p- females to WT C57BL/6 J males. Genotyping was performed with tail tip DNA. Tail tip tissue was incubated overnight at 50 °C in 400uL digest buffer overnight (0.1 M Tris pH8.8, 0.2 M NaCl, 0.005 M EDTA, 0.5% SDS + 8 µL proteinase K (Thermo Scientific #BP1700500). The following day, proteinase K was inactivated by heating samples at 90 °C for 10 min. Remaining tissue matter was removed from the samples by centrifugation, and the DNA in the supernatant was purified via isopropanol precipitation. An Amplification Refractory Mutation System PCR (ARMS-PCR) was used selectively amplify either the WT or Q606E allele using the following primer pairs: WT primers: F-5’-CATCTTCTTTTGAAACTGAGGGTC-3’, R-5’-CGAAGGACAACTTACTGGGTGA-3’ (176 bp). Q606E primers: F-5’- TCATGTGAAGCTGAAAGATCACAA-3’, R-5’- GACTATGCCAATCAGAGTAAACTC-3’ (285 bp). PCR was performed using GoTaq DNA polymerase (Promega #M3001) with the following thermocycler conditions: Denaturation at 95 °C for 10 min, followed by 28 cycles of 95 °C for 30 s, 62 °C for 25 s, and 72 °C for 30 s. Final annealing time was 72 °C for 1 min, and then products were kept at 4 degrees until bands were visualized on a 2% agarose gel.
Animal behavior assays
Mice were housed in mixed-genotype cages of 1–5 mice. All behavioral experiments were performed by female experimenters who were blinded to genotype. Mice were adults of 5–16 weeks during testing. A cohort of 39 mice in total was used: 14 female (7 WT, 7 Ube3amQ606E) and 25 male (10 WT, 15 Ube3amQ606E). All tests were performed during the light cycle.
Continuous and accelerating rotarod
Motor coordination and balance were tested using the rotarod test as previously described35. Mice were place on a rotarod (Rotamex-5, Columbus Instruments, Columbus, OH). The continuous rod rotated at a constant three rotations per minute (rpm), and the accelerating rod was set to an initial rotation of 3 rpm, and set such that rotation speed was 5 rpm by 60 s, 11 rpm by 120 s, 17 rpm by 180 s. Mice were tested in two trials per day on three separate days.
Sensorimotor battery
Abilities in walking initiation, balance (on a ledge and platform), coordination (vertical pole and inclined screens), and strength (inverted screen) were tested in a sensorimotor battery as previously described16,17. For the walking initiation test, animals were placed on a flat surface inside a square measuring 24 cm × 24 cm, marked with white tape. Time until the mouse had exited the square with all four paws was recorded, up to 60 s. In the balance tests, the mouse was placed on either a Plexiglass ledge (0.5 cm deep and standing 38 cm high) or a wooden platform (3.5 cm thick, 3 cm in diameter, and elevated 25.5 cm high). Time to balance until 60 s was recorded. For the pole tests, the mice were placed head upward on a vertical pole with a fine-textured surface. Time for the mouse to turn downward 180° and time to climb to the bottom of the pole was recorded up to 120 s. In the inclined screen tests, the mice were placed head downwards at the center of a mesh wire grid (16 squares per 10 cm), which was elevated 47 cm and inclined to either 60° or 90°. Time the mouse took to turn upward 180° and climb to the top of the screen was recorded up to 60 s. For the inverted screen test, the mouse was placed head downward at the center of the same mesh wire grid screen, elevated 47 cm as before. When the mouse had gained a proper grip on the screen, the screen was inverted 180° such that the mouse was on the underside of the screen. Time the mouse was able to grip the screen without falling was recorded up to 60 s.
Prepulse inhibition/startle
Sensorimotor reactivity and gating were assessed using the prepulse inhibition (PPI)/acoustic startle assay as previously described16,17. Briefly, computerized instrumentation (StartleMonitor, Kinder Scientific) was used to measure the acoustic startle (the animals’ response to 120 dBA auditory stimulus pulse (40 ms broadband burst)) and the PPI (the animals’ response to a prepulse plus the startle pulse). There were a total of 65 trials. 20 startle trials were conducted over the course of a 20 min period, with the first 5 min of each trial serving as an acclimation period with no stimuli being presented above the 65 dB background noise. The trial session began and ended with five consecutive startle trials (120 dB pulse alone) and no other trial types. Ten startle trials were presented between the first and last five. These ten trials were interspersed with 30 PPI trials, in which 120 dB stimuli were preceded by a prepulse stimuli of 4, 12, or 20 dB above background (10 of each volume trial type). The percent PPI score per trial was calculated with the equation:
Open field
Locomotor ambulatory activity to assess activity, exploration, and anxiety-like behavior was performed using an open field assay as previously described35. In this test, mice were evaluated over a one hour period in a transparent acrylic enclosure (50 × 49.5 × 45 cm) with an acrylic floor, enclosed within a custom sound-attenuating chamber (70.5 × 50.5 × 60 cm). A computer software program (ANY-maze, Stoelting Co.) used photobeam breaks to track and quantify the animal’s horizontal movement (“ambulations”) within a 35.4 × 35.4 cm “central zone” or a bordering 7.3 cm “perimeter” zone.
Morris water maze
To assess spatial learning and memory, we used the Morris Water Maze as previously described35. Mice were placed in a pool of water made opaque with non-toxic white paint. A submerged platform was placed ~ 1 cm−1 inch below the water’s surface. A computer software program (ANY-maze, Stoelting Co.) was used to track the time and distance per mouse to reach an escape platform. The maximum trial duration was one minute. There were two days of cued trials, with four trials per day. Following cued trials were five place trials. Finally, one probe trial per animal was run following the place trials on the last day of testing. For cued trials, the platform was made visible by attaching a red tennis ball with a stick. The platform was moved to a new location each trial, for 4 trials per day separated by 30 min inter-trial intervals, for two consecutive days. Place trials were conducted three days later. These occurred daily for five days, with two blocks of two consecutive trials each day. Here, the escape platform remained in the same pool quadrant for the entirety of the trials. The tennis ball was removed and spatial cues were placed on the walls surrounding the pool for the animals’ use in locating the submerged platform. Mice were released from a different location in the pool each trial, and the release order was different each day, in a pre-determined manner. Data was averaged across the trials within each day. The probe trials were conducted one hour after the place trials. Here, the platform was removed, the mouse was released from the quadrant opposite from the learned platform location, and the mouse was allowed to swim for one minute. Time spent in each quadrant, swim speed, and the number of crossings over the zone where the platform was formerly placed were recorded.
Marble burying
To assess repetitive digging behavior, the marble burying assay was used as previously described36. Here, mice were brought into the testing room to acclimate for 30–60 min prior to testing. They were placed in a transparent enclosure filled 3 cm deep with autoclaved aspen bedding. 20 marbles were placed in a grid formation on top of the bedding. The mouse was placed in the cage and 30 min of exploration were allowed before the mouse was removed and number of marbles not buried under the bedding were recorded. Marbles were considered “buried” when it was at least 2/3 covered by bedding. Bedding was changed out and the enclosure and marbles were cleaned thoroughly between animals.
Social dominance tube test
A tube test was used to assess social hierarchy behavior as previously described16. In this test, mice were introduced to a clear acrylic tube apparatus (30 cm in length and 3.6 cm in diameter) for two consecutive days to acclimate. Then, on days 3–5, sex-matched pairs of WT and Ube3amQ606E mice were gently introduced to the tube, avoiding cage-mate pairings. New WT-Ube3amQ606E pairings were used on each trial day to allow for three different matches per animal. When the mice met at the center, an acrylic divider at the center of the tube was lifted, indicating the beginning of the bout. The time for one mouse to back out of the tube, for a duration up to two minutes, was recorded, with this mouse being recorded as the “submissive” mouse and the other mouse as the “dominant” mouse. The tube was thoroughly cleaned between bouts, and scores were recorded by a researcher blinded to genotype.
3-chamber social approach
To test sociability and social novelty, the 3-chamber social task was used as previously described16. Mice were placed in a clear acrylic apparatus (60 X 39 X 22 cm) divided into three equal chambers (19.5 X 39 X 22 cm each) with a door between the central and side chambers (5 X 8 cm each). During the testing periods, a clear acrylic cover with four air holes was placed on the apparatus. The apparatus was placed inside a custom-built sound-attenuating chamber (70.5 X 50.5 X 60 cm). In the center of each of the side chambers, a stainless steel cup with vertical bars was placed to house the “novel” or “familiar” mice according to the conditions of that trial (10 X 10 cm, Galaxy Pencil/Utility Cup, Spectrum Diversified Designs, Inc). The trials were conducted under low illumination by red light (~ 11 lx) by LED Flex Ribbon Lights (Commercial Electric, Home Depot). Trials were captured on video with a CCTV camera (SuperCircuits) that was mounted onto the ceiling of the sound-attenuated chamber. The animals’ movement inside the chambers during testing was recorded and analyzed with a computer software program (ANY-maze, Stoelting Co., Wood Dale, IL). The program tracked the nose, body and tail of each mouse to determine distance traveled, time spent in each chamber, time spent in the investigation zone (defined as the time the mouse’s nose was within a 2 cm-wide area surrounding the cup), and entries into each chamber. The social preference index was calculated as: (time in social / (time in social + time in empty))*100. The novelty preference score was calculated as (time in novel / (time in novel + time in familiar))*100. Statistical analysis was performed as previously described16,37.
Testing was comprised of four consecutive ten-minute trials, with the first and second trials habituating the mouse to the center chamber and whole apparatus, respectively. The third trial tested sociability. In this trial, an unfamiliar, conspecific, sex-matched mouse was placed in the cup of one of the side chambers, with the cup in the opposite side chamber standing empty. The test mouse began the trial in the center chamber and was allowed to explore freely for the duration of ten minutes. After the allotted time, the mouse was gently guided back to the center chamber, the doors were closed, and the side chambers were prepared for the fourth trial. The fourth trial tested for social novelty preference. In this trial, a second conspecific, sex-matched mouse was added to the empty cup in the side chamber opposite the mouse that was introduced in Trial Three. In this arrangement, the first novel mouse served as the “familiar” mouse and the second novel mouse as the “novel” mouse. Again, the test mouse was allowed to explore the apparatus freely for the duration of ten minutes.
Forced swim
To test for behaviors analogous to depression, the forced swim task was conducted as previously described38. Mice were placed in a cylindrical tank (19 cm in height and 12.5 cm in diameter) filled with 26 ± 1 °C water and were filmed for a total of six minutes. The first two minutes were counted as “acclimation time” and were not used for analysis. The remaining four minutes were analyzed by a single researcher, who recorded the amount of time the mouse spent immobile. The mouse was considered “immobile” when it ceased all swimming behavior except for minimal movements required to float and keep its head above water.
Statistics
All behavioral statistical analyses were performed in SPSS (v.28). Assumption of normality was assessed using the Shapiro–Wilks test and a manual assessment of the z-score histogram plot outputs. Mice with values greater than 3.29 standard deviations from mean were deemed influential outliers and removed from analysis. ANOVA assumption of equal variances was assessed with the Levene’s test. For all reported behavioral tests which were found to violate the assumptions of normality, non-parametric tests were performed. Chi-square goodness of fit tests was used to assess associations between categorical variables. Post-hoc analyses to adjust p-values were conducted with the Benjamini–Hochberg correction.
In vivo magnetic resonance imaging (MRI) and diffusion tensor imaging (DTI)
All animal experiments were approved by Washington University’s Institutional Animal Care and Use Committee. MRI imaging was performed as previously described16. For the duration of the scanning session, mice were anesthetized with isoflurane/O2 (1.2–1.5% v/v). Circulating warm water was used to maintain body temperature at 37 ± 0.5 °C, measured via rectal probe. The respiratory rate (90–120 breaths/min) and body temperature were monitored using a Small Animal Instruments monitoring and gating unit (SAI, Stony Brook, NY). Imaging was performed on an Agilent/Varian (Santa Clara, CA) DirectDrive™ 4.7-T small-animal MR scanner. Data were collected with a laboratory-built, actively-decoupled 7.5-cm ID volume coil (transmit)/1.5-cm OD surface coil (receive) RF coil pair. Total imaging time per animal was approximately two hours. 20 mice were used in total: 10 WT, 10 Ube3amQ606E, with 5 males and 5 females per genotype.
T2-weighted (T2W) transaxial images were collected with a 2D fast spin-echo multislice sequence (FSEMS) as previously described16, with 25 slices, slice thickness = 0.5 mm, with 4 averages. Diffusion Tensor Imaging (DTI) was used to measure the directional water movement alongside and perpendicular to axons (fractional anisotropy: FA). This was used to measure white matter integrity and for structural assessments. DTI data were collected with a multi-echo, spin-echo diffusion weighted sequence as previously described16. DTI data was processed in MATLAB (The MathWorks®, Natick MA) according to the standard MR diffusion equation39, using the standard MR diffusion equation. Parametric maps of the apparent diffusion coefficient (ADC), axial diffusion (Daxial), radial diffusion (Dradial), and fractional anisotropy (FA) were calculated as previously described using standard methods16,40,41. The parametric maps were converted into NIfTI (.nii) files and imported into the program, ITK-SNAP (http://www.itksnap.org), for ROI (region of interest) segmentation. MRI anatomic images were read into MatLab, smoothed with a Gaussian filter (Sigma 0.75), and then converted into NIfTI format (.nii). Regions of interest (ROIs) were auto-segmented with the ANTs program42 using skull-stripped anatomic T2W images with the ‘skull-stripped’ mouse brain atlas at 40 μm isotropic resolution43. For whole cortex, whole cerebellum, and total white matter tract volume, individual ROIs were combined in MatLab and exported as NIfTI files. ROIs were refined manually in ITK-SNAP. All manual segmentation was performed by a single experimenter blinded to sex and genotype. All statistical analyses were performed in GraphPad Prism.
Proteomics
Tissue collection
Postnatal day 1 mice were anesthetized by placing on aluminum foil on ice for approximately 5 min. They were then decapitated and the brain was removed. The cortex was isolated under a microscope in ice cold sterile 1XPBS and immediately placed in a -80 °C freezer until use. Tissue was manually lysed in 5 volumes (5uL/g) of RIPA buffer (150 mM NaCl, 5 mM EDTA, pH8.0, 50 mM Tris, pH 8.0, 1% Triton X-100, 0.5% sodium deoxycholate, with Pierce™ Protease inhibitor (ThermoFisher, Cat#A32953) and Pierce™ Phosphatase inhibitor (ThermoFisher, Cat#A32957)). SDS was added to the lysates to a final concentration of 1%. Lysate was sonicated (40% amplitude, 5 s on, 5 s off, 2 cycles) and centrifuged at 15,000 rpm at 4 °C for 30 min. Supernatant was collected and frozen at -80 °C until use.
Proteomics sample preparation
Protein from mouse brain lysates were precipitated with acetone at -20 °C overnight. Samples were pelleted, resuspended in 7 M urea, reduced with 5 mM dithiothreitol and alkylated with 15 mM chloroacetamide. Samples were diluted with 50 mM ammonium bicarbonate so the urea concentration was less than 1 M and a standard tryptic digest was performed overnight at 37 °C with agitation. Samples were acidified with TFA to a pH below 3. Solid phase extraction (SPE) was performed using C18 Prep Sep cartridges (Waters, WAT054960) with the following protocol. The SPE cartridge was washed with conditioning solution (90% methanol with 0.1% TFA) then equilibrated with 0.1% TFA. The sample was passed slowly (1 drop/s) through the equilibrated cartridge and the cartridge desalted with equilibration solution. The sample was slowly eluted (1 drop/s) with an elution solution of 50% acetonitrile (ACN) with 0.1% TFA. Following elution, samples were speed vac’d, and resuspended in HEPES buffer for TMTpro labeling and quantified using the Pierce peptide quantification kit (Pierce 23290) so that the same concentration of each sample was TMTpro labeled (lot VJ30926). TMTpro labeling was performed according to kit specifications (Thermo Fisher Scientific, 90110), with the exception that labeling was performed for 6 h instead of 1 h. Samples were then combined, dried down, and resuspended for a second SPE cleanup (described above). Peptides were fractionated utilizing a High pH Reversed-Phase Peptide Fractionation kit (Pierce, 84868), as per the manufacturer’s specifications. A final clean-up step was performed using C18 Spin Columns (Pierce, 89870).
Proteomics data acquisition and analysis
TMT-labeled peptide fractions were analyzed in technical duplicate. Peptides were separated via reverse-phase nano-HPLC using an RSLCnano Ultimate 3000 (Thermo Fisher Scientific). The mobile phase consisted of water + 0.1% formic acid as buffer A and acetonitrile + 0.1% formic acid as buffer B. Peptides were loaded onto a µPAC™ Trapping column (PharmaFluidics) and separated on a 50 cm µPAC™ column (PharmaFluidics) operated at 35 °C flowing at 300 nL/min using a segmented 120 min gradient as follows: 5 min from 2–7% buffer B, then 105 min from 7–25% B, and finally 10 min from 25–35% B. Mass spectrometry analysis was performed on an Orbitrap Eclipse (Thermo Fisher Scientific) using a TMT-RTS-MS3 data acquisition method. MS1 scans were obtained at 120,000 resolution in the Orbitrap with a scan range from 350–2000 m/z, 50 ms max injection time, and automated gain control (AGC) target of 1e6. All precursors were filtered for monoisotopic peaks, charge states 2–7, mass between 800 and 8000 Da, dynamic exclusion of 60 s with 10 ppm mass tolerance excluding isotopes, and a precursor fit of 50% with a window width of 1.2 m/z. Precursors selected for MS2 were isolated in the quadrupole with an isolation window width of 0.7 m/z. MS2 ions were obtained in the ion trap with 35 ms max injection time and 1e4 AGC and fragmented with collision induced dissociation (CID) collision energy of 35% with 10 ms activation time. Precursors selected for MS3 scans were based on real-time search synchronous precursor selection (RTS-SPS, Orbitrap Eclipse 3.4.3072.18). MS2 spectra were searched against the UniProtKB/Swiss-Prot mouse sequence database with isoforms (25,622 entries, downloaded in May 2021) appended with common contaminants. For all analyses, the following RTS parameters were used: specific tryptic digestion with up to 1 missed cleavage, carbamidomethyl and TMTpro16plex fixed modifications, and variable methionine oxidation. Real-time FDR filtering was used along with the following scoring thresholds were used: xcorr ≥ 2, dCN ≥ 0.1, and precursor ppm ≤ 10. MS3 scans were obtained in the Orbitrap at 50,000 resolution with a 100–500 m/z scan range, 86 ms max injection time, higher-energy collision dissociation (HCD) collision energy of 55%, and an MS2 isolation window of 3 m/z.
After data acquisition, raw files were processed for peptide identifications by Comet (2021.01 rev. 0) and Percolator (version 3.05.0) with the same database and parameters used for RTS. Identifications with percolator q values < 0.01 that matched the RTS identifications (same sequence, charge state and MS2 scan) were kept. TMT lot-specific purity correction was performed using non-negative least squares regression using an in-house script. The mass spectrometry proteomics data was deposited to the ProteomeXchange Consortium via the PRIDE partner repository with the dataset identifier PXD055901.
Downstream analysis was achieved with MSstatsTMT (version 1.6.6). Only peptides that were unique to a gene were considered for protein quantification. For redundant MS3 spectra, the spectra with highest total TMT intensity were used. Proteins with less than 2 unique peptides were filtered out. Protein summarization was performed by MSstatsTMT with global normalization. All reporter intensities then underwent log2 transformation for statistical analysis. PCA clustering and differential expression were performed with these normalized data.
Pathway analysis: Overrepresentation analysis was conducted using the ShinyGO web platform (http://bioinformatics.sdstate.edu/go/)44. A protein list of either upregulated or downregulated proteins with a significant unadjusted p-value (p < 0.05) were used for each analysis. Shown are enriched terms from the GeneOntology (GO)45 Cellular Component pathway database, with an FDR cutoff of 0.05, and a minimum pathway size of 2.
Stereology
Tissue collection
Postnatal day 7 pups were anesthetized by being placed on a thin foil lining on ice. Pups were then transcardially perfused at a rate of 1.5 mL/min for 3 min. Mice were then decapitated and the brain removed. Brains were stored in 4% paraformaldehyde at 4 °C for > 1 week. Tissue was sectioned on a vibratome in ice cold 1XPBS at 75 μm thickness and slices were stored in sterile 1XPBS at 4 °C in the dark until use.
Immunohistochemistry
Staining for cleaved caspase 3 was performed as previously described46. In short, a set consisting of every 8th slice of P7 coronal brain tissue was quenched in 90% methanol and 3% H202 in 1XPBS for 10 min. Tissue was washed 3 X 2 min in 0.1% Triton X-100 in 1XPBS. Tissue was then blocked for one hour (Blocking buffer: 2% Bovine Serum Albumin, 0.2% Dry Nonfat Milk powder, in 0.5% Triton X-100), and then transferred into primary antibody solution (Cell Signaling Technology® Cleaved Caspase-3 (Asp175) Cat# 9661S, diluted at 1:1000 in 1% BSA, 0.1% Triton X-100 in 1XPBS) overnight at 4 °C. The next day, tissue was washed as before and incubated for one hour in a biotinylated secondary antibody solution (1:200 Vector Laboratories Goat anti-Rabbit IgG (H + L) Biotinylated, Cat# BA-1000, suspended in 1% BSA in 1XPBS). Tissue was washed 3 X 5 min and then reacted with an avidin–biotin conjugate for one hour in a humidified 37 °C chamber (Vectastain® Elite® ABC solution, Vector Laboratories, Inc. Cat# PK-610) as per the manufacturer’s instructions. Tissue was washed 3 X 5 min, and visualized by incubation for 2 min in the chromogen VIP (Vector® VIP peroxidase substrate solution, Vector Laboratories, Cat#SK-4600). Tissue was washed 3 X 2 min and then incubated in PBS until mounting. Tissue was mounted and dried on glass slides, in the dark, overnight, and coverslips applied with DPX mounting medium (Electron Microscopy Sciences, Cat#13,510). Slides were kept in the dark at 4 °C until use.
Imaging and analysis
Imaging was performed using Stereoinvestigator Software (version 2019.1.3, MBF Bioscience, Williston, Vermont, USA) running on a Dell Precision Tower 5810 computer connected to a QImaging 2000R camera and a Labophot-2 Nikon microscope with an electronically driven motorized stage. A single rater, blinded to sex and genotype, manually traced each hemisection and stereologically quantified the number of CC3-positive cells, using the unbiased optical fractionator method. Data was exported and used to estimate the number of apoptotic cells per hemisphere, which was multiplied by two to estimate the total number per brain. Statistical analysis was performed with GraphPad Prism.
Lipid peroxidation assay
The lipid peroxidation assay was performed with the Abcam Lipid Peroxidation (MDA) Assay Kit (Colorimetric/Fluorometric) (catalog #ab118970). Mice were anesthetized in an isoflurane chamber, decapitated, and the brain removed. Immediately, ~ 10 mg each of the left and right hemisphere prefrontal cortex were taken, the weight of that tissue measured, and the tissue was placed in a 1.5 mL tube. The MDA assay was carried out according to the manufacturer’s instructions, with minor alterations. The tissue was briefly washed by pipetting 500uL of ice-cold 1XPBS into and then out of the tube. The tissue was homogenized in 303uL Lysis Solution Buffer by pipetting for 20 passes, followed by pipetting with a 20xG needle and syringe for 20 passes. Lysates were centrifuged at 13,000 × g for 15 min. Once the MDA protocol was complete, absorbance was measured on a microplate reader at 532 nm, and final MDA concentration was calculated according to the manufacturer’s protocol.
Cell culture and transfection
HEK293T cells (ATCC) were maintained in a 5% CO2 humidified incubator in DMEM supplemented with 25 mM glucose, 0.4 mM glutamine, 1 mM Sodium Pyruvate (Gibco #10,569,044), 10% fetal bovine serum (Gibco, #16,140,071), and 1 × antibiotic–antimycotic containing penicillin, streptomycin, and amphotericin B (ThermoFisher #15,240,062). For biochemical analyses, transfections were performed using FuGENE (Promega) according to the manufacturer’s instructions.
Molecular biology and antibodies
The nomenclature used in this study was based on the amino acid sequence from human UBE3A isoform I (NCBI accession: NP_001361390.1). A detailed protocol to generate Myc-tagged variants of human UBE3A is published47. In brief, Myc epitope tags were placed on the N-terminus of UBE3A by polymerase chain reaction and all UBE3A constructs were cloned into pCIG2 plasmid DNA using SacI and XmaI sites. Primary antibodies used were mouse anti-Myc (1:1,000, Millipore Sigma #05-419), mouse anti-Actin (1:5,000, EMD Millipore, #MAB1501), rabbit anti-UBE3A (1:1,000, Bethyl, #A300-352A), rabbit anti-PSMD1 (1:1,000, Invitrogen, #PA1-973), and rabbit anti-PSMD4 (1:1,000, Cell Signaling, #3846). All secondary antibodies were obtained from LI-COR Biosciences: donkey anti-mouse 800CW (926-32212), donkey anti-rabbit 800CW (926-32213), donkey anti-mouse 680RD (926-68072), and donkey anti-rabbit 680RD (926-68073); all used at a dilution of 1:10,000.
For western blotting, brain tissue was lysed in ice-cold RIPA buffer composed of 50 mM Tris–HCl (pH7.4), 150 mM NaCl, 1% Triton X-100, 0.1% sodium dodecyl sulfate and 0.25% sodium deoxy-cholate, and supplemented with EDTA-free protease (ThermoFisher, #78437) and phosphatase (ThermoFisher, #78428) inhibitor cocktails. After lysis, samples were centrifuged and protein concentrations determined using the Pierce BCA protein assay kit (Invitrogen, #23227). Equal amounts of protein were resuspended in 1 × LDS sample buffer (ThermoFisher, #84788) and resolved by SDS-PAGE on a 4–20% gradient polyacrylamide gel and transferred to nitrocellulose membranes (Bio-Rad). Membranes were blocked in 1 × fish gelatin blocking agent (Biotium #22,010) and probed with the appropriate primary antibodies overnight at 4 °C or 2 h at RT. Protein bands were visualized using the Odyssey CLx infrared imaging system and Image Studio v5.2 software (LI-Cor Biosciences) and western blots analyzed using ImageJ v2.1.0/1.53c.


Responses