The genetic and observational nexus between diabetes and arthritis: a national health survey and mendelian randomization analysis

Introduction
Diabetes (diabetes mellitus, DM) is a common disease in the worldwide [1]. In 2011, the prevalence of DM was estimated to be 366 million, and it is anticipated that by 2030, the prevalence will reach 552 million [2]. Although DM is not fatal in and of itself, chronic hyperglycemia in DM can have deleterious effects on multiple organs and lead to severe complications such as cardiovascular diseases, premature death, kidney failure, and depression [3]. Meanwhile, although people with DM have a poor prognosis, the risk of death nearly doubles when infected by COVID-19 [4].
Arthritis, mainly osteoarthritis (OA) and rheumatoid arthritis (RA), is a prevalent chronic disease affecting adults globally. In the US, between 2013 and 2015, 49% of adult patients with arthritis had diabetes [5]. By 2040, arthritis is projected to affect 600 million people [6]. There is growing evidence linking arthritis to neurodegeneration, cardiovascular events, and mortality [7, 8]. There are likely common pathophysiological pathways between diabetes and arthritis, such as chronic inflammation and microangiopathy [9]. Glucocorticoid, a key factor in blood sugar regulation, is also a classic drug for the treatment of arthritis [10]. However, there is no evidence of their direct association.
According to various reports, the prevalence of diabetes in patients with arthritis ranges from 8.6% to 14.4% [11,12,13]. Although there have been some studies examining the relationship between diabetes and arthritis, the results of these studies have been inconsistent and most of the studies have been observational, which does not allow for causality to be established. Given the complex relationship between diabetes and other comorbidities, guidelines recommend focusing on diabetes control to manage comorbidities [14, 15]. Therefore, understanding the relationship between diabetes and arthritis will pave the way for a more comprehensive approach to treat both diseases.
Mendelian Randomization (MR) is a robust epidemiological technique that leverages genetic variants as instrumental variables to ascertain the causal impact of an exposure on an outcome. This methodology, under certain key assumptions, effectively mitigates the challenges posed by reverse causality and confounding factors, which frequently complicate the interpretation of epidemiological studies [16]. MR is conceptualized as a mean to procure unbiased estimates of putative causal variable effects, circumventing the need for traditional randomized controlled trials. It has since evolved into a widely embraced instrument in the realm of causal epidemiology [17]. MR employs genetic variants that are strongly correlated with the exposure of interest as proxies. These proxies are used to test and estimate the causal effect of the exposure on the outcome using observational data [18]. The three fundamental assumptions in MR are: the genetic variant is associated with the exposure (relevance assumption), the variant is not associated with any confounders of the exposure-outcome relationship (independence or exchangeability assumption), and there are no independent paths from the variant to the outcome (exclusion restriction or no horizontal pleiotropy assumption). This innovative method has proven instrumental in establishing causal relationships between diseases and has gained significant traction in recent years.
In this current study, we aimed to investigate the relationship between diabetes and arthritis using data from the National Health and Nutrition Examination Survey (NHANES). In addition, we intend to delve into the causal relationship between diabetes and arthritis by employing Genome-Wide Association Study (GWAS) data from the FinnGen and European Bioinformatics Institute and conducting a MR analysis. This research endeavor aims to elucidate the intricate relationship between diabetes and arthritis, thereby contributing to the enhancement of health policies.
Patients and methods
NHANES methodology and participant selection
The NHANES is a cross-sectional survey designed to collect comprehensive health and nutrition data from a nationally representative sample of the U.S. population. The design of this sampling strategy is crucial for producing reliable and generalizable data. The key components of NHANES’ sampling strategy are including sampling strategies, response rates and data collection procedures. Sampling strategies include multistage sampling, stratification and oversampling, weighting adjustments and nonresponse, and rotational design; NHANES maintains high response rates (70–80%) through multiple strategies, including repeated contact attempts, in-home interviews, mobile examination centers (MECs), financial incentives, bilingual staff, and follow-up procedures; Additionally, NHANES follows a three-step data collection process including in-home interviews, physical examinations, laboratory testing, standardization and quality control, privacy and security. The more detailed sampling strategy referred to NHANES methodology part in Supporting Information (SI). The study was approved by the Research Ethics Review Board of the National Center for Health Statistics, and all participants provided written informed consent. For this study, data from six consecutive NHANES cycles from 2007 to 2018 were selected, involving a total of 59,842 participants (Fig. 1). The 34,770 participants were excluded due to age younger than 20 years; 462 participants were excluded due to pregnant; 730 participants were excluded due to not MEC examined; 75 participants were excluded due to diagnosis or disease history was missing or uncertain; 3529 participants were excluded due to incomplete data of BMI, physical activity, energy intake or Health Eating Index (HEI). The final study sample comprised 30,062 eligible participants, each representing approximately 7000 individuals in the U.S. population (Fig. 2). For normally distributed continuous variables, such as age, one-way ANOVA is employed, while for categorical variables, chi-square tests are utilized. Non-parametric tests are applied for variables that do not adhere to normal distribution. The confounding factors are inferred by using directed acyclic graphs and incorporated into the regression equation (Fig. S1). For more details on data coding, transformation, and completeness, please refer to the Supporting Information section under the subtitle “Data Coding and Completeness” (Fig. S2).

The total number of participants for each NHANES cycle from 2007–2008 to 2017–2018. The blue indicates included values, and light blue indicates excluded or with missing values.
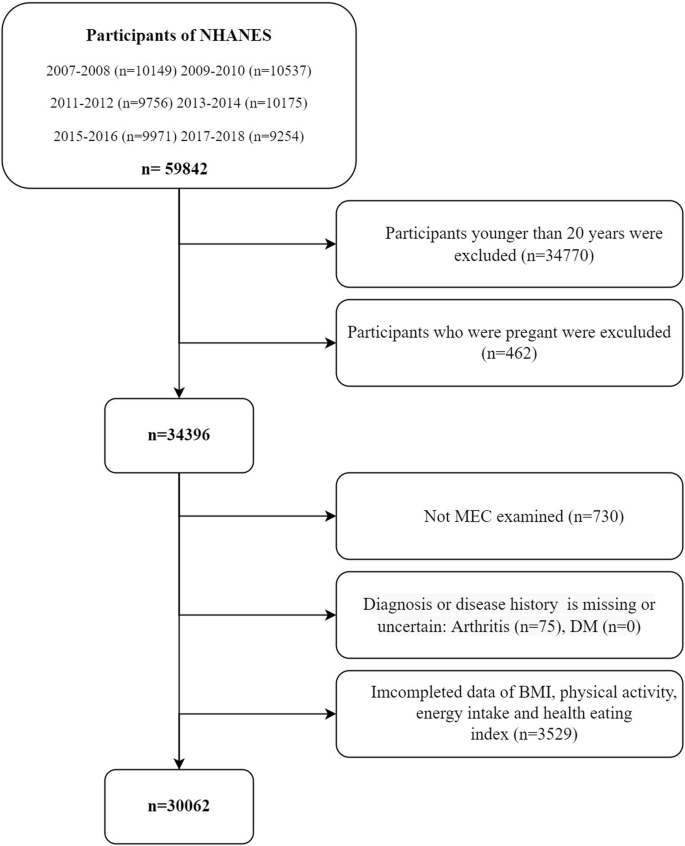
NHANES participants from 2007–2018 started with 59,842 participants. Exclusions were made based on age (<20 years), pregnancy, missing or incomplete data, and non-MEC examination, ultimately resulting in 30,062 eligible participants for analysis.
Disease definition
The study population was categorized into age groups: <45, 45–60, and >60 years old. Race/ethnicity was divided into White, Black, Mexican, and other groups. Socioeconomic factors included health insurance coverage, education level, poverty-to-income ratio, marital status, and military service. Body Mass Index (BMI) was recorded, with participants having a BMI over 25.0 considered overweight and over 30.0 considered obese. Physical activity status was defined based on the availability and performance of leisure time physical activity. Participants were also categorized based on their HEI scores. According to the fasting glucose and oral glucose tolerance test (OGTT), subjects were divided into four groups: DM, Impaired Fasting Glucose, Impaired Glucose Tolerance, and normal subjects. According to the ADA’s diabetes diagnostic criteria, diabetes is defined by self-reported diagnosis, use of insulin or oral hypoglycemic medication, FBG ≥ 126 mg/dL or HbA1c level ≥ 6.5% [19]. The diagnostic criteria of NHANES database for type 2 diabetes was based on the following index: (1) individuals have been told by doctor that they have DM; (2) fasting blood glucose levels ≥ 7.0 mmol/L; (3) two-hour OGTT blood glucose levels ≥ 11.1 mmol/L; (4) random blood glucose levels ≥ 11.1 mmol/L; (5) glycated hemoglobin (HbA1c) ≥ 6.5%; (6) use of glucose-lowering medications or insulin; (7) exclusion of type 1 DM [20]. Meanwhile, the type 1 diabetes was defined as a diagnosis of diabetes before 30 years of age with the use of insulin within 1 year of diabetes diagnosis [21]; We have taken into account the differences between these two types of diabetes and have analyzed them accordingly. In cases where differentiation between the two types is necessary, we have employed specific criteria mentioned above to ensure accurate classification and analysis. Similarly, the diagnosis of arthritis is according to self-reported data. Participants are questioned about whether a doctor or other healthcare professional had informed them of having arthritis (MCQ160A) and prescribed products to deal with arthritis (DSQ128L). Specifically, participants were asked that “Has a doctor or other health professional ever told you that you had arthritis?” The response options were “Yes” or “No.” Arthritis subtypes were assessed via the following question: “Which type of arthritis was it?” The response options were “Rheumatoid arthritis,” Osteoarthritis,” “Psoriatic arthritis,” “Other,” “Refused,” and “Don’t know.” For more detailed disease definitions and classifications, please refer to the Extended Definitions and Classifications of Study Variables in the Supporting Information (Tables S1–S4).
Methodology of mendelian randomization
Mendelian Randomization (MR) offers a unique approach to investigate the causal relationship between diabetes and arthritis. Unlike traditional randomized controlled studies, MR leverages genetic variants that are stable, long-term exposure factors that are independent of external environment and social behavior. These variants are randomly assigned during gamete formation, reducing bias and reverse causation. Our MR study employed a two-sample design, utilizing summary statistics from large Genome-Wide Association Studies (GWAS) datasets. The study included data from both Type I diabetes and osteoarthritis (self-reported), which are from European Bioinformatics Institute, and Type II diabetes, seropositive rheumatoid arthritis and other arthritis genetic, which are from FinnGen. All instrumental variables were derived from the European population. Multiple MR methods were employed to explore the causal relationship between diabetes and arthritis, including inverse-variance weighted (IVW) Meta-analysis (Fig. 3). For more details on SNP selection and sensitivity analyses, please refer to the Supporting Information section under the subtitle “Detailed SNP Selection and Sensitivity Analyses in MR”.
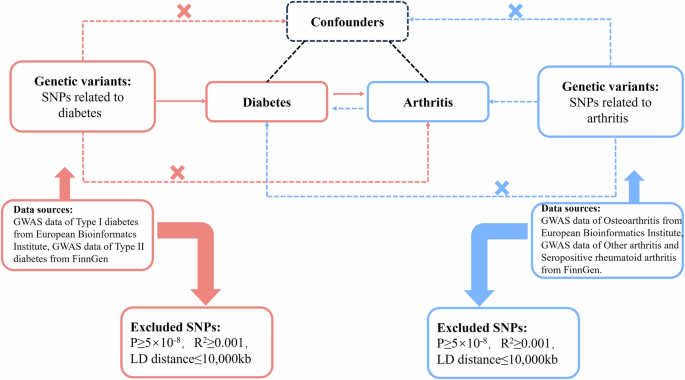
The red pathway evaluates the causal relationship between diabetes and arthritis. The blue pathway indicates reverse randomization hypothesis between diabetes and arthritis.
Statistical analysis
Statistical analysis of data was performed using the R language (R 4.1.3). To minimize the impact of selection bias, several measures were implemented during our study design and data analysis. Firstly, detailed inclusion and exclusion criteria were established before the study commenced to ensure that these criteria were applied consistently across all participants. A comparative analysis of included and excluded participants were conducted to identify any significant differences in key demographic variables and clinical characteristics. Besides, utilizing sensitivity analyses to assess the impact of different selection criteria on our findings. Finally, the inclusion and exclusion criteria and the process in our manuscript were transparently reported. We also provided detailed information on the number and characteristics of excluded participants, discussing the potential impact of selection bias on our results and the study’s limitations. To avoid sampling selection bias, we applied complex sample weighting to address oversampling and nonresponse. The demographic characteristics and the overall prevalence of hypertension (HT), diabetes, arthritis, overweight, and obesity were estimated using a complex sample weight. The time trend of the prevalence of HT, diabetes, overweight, and arthritis was assessed by adjusting age, gender, and race. Categorical variables were compared using Chi-square. Logistic regression models were used for covariate adjustments. Basing on basic demographic characteristics as well as the covariate affecting both arthritis and diabetes, we stratified the covariate and performed stepwise logistic regression models as following: First, basic demographic characteristics, such as age, gender and race, were adjusted for logistic regression models; Basing on this results, then social factors, such as health insurance coverage, education level, poverty to income ratio (PIR), military service history and marital status were adjusted for logistic regression models; similarly ways, other factors potentially affecting the outcome including exercise, energy metabolism, BMI, HEI2015_score and hypertension were further adjusted for logistic regression models; Additionally, we used directed acyclic graphs (DAGs) to determine covariate. The more detailed explanation of these reasons for the covariates referred to SI. Furthermore, sensitivity analyses with different covariate sets to assess robustness was performed. We performed subgroup analyses, including age, gender, and baseline health status, to assess the robustness of the association between the diabetes and arthritis across different population strata. Next, to further evaluate the robustness of our findings, we constructed multiple regression models using different sets of covariates, such as basic demographic variables, socioeconomic status and comorbid conditions. These allowed us to assess whether the observed associations were sensitive to changes in covariate inclusion and exclusion. Odds ratios (OR) with 95% confidence intervals (CI) and p values were calculated. A two-tailed test with p values < 0.05 was considered statistically significant.The expression format for weighted continuous variables is: mean ± standard deviation. The expression format for weighted categorical variables is: percentage (standard error).
Results
Characteristics of study participants
The study included 30,062 eligible participants, representing a weighted sample of 207,672,407 non-hospitalized adults in the U.S. No significant demographic differences were observed between the overall study population and those excluded due to missing data or lack of MEC tests (Fig. S3). The weighted percentages of various characteristics are summarized in Table S5. The sample comprised 14% with diabetes and 26.14% with arthritis. Over 12 years the prevalence of diabetes increased from 19.14% to 21.40%, while the overall prevalence of arthritis remained relatively stable. People with diabetes were significantly older and had a higher prevalence of arthritis compared to those without diabetes (Table 1). The prevalence of arthritis in diabetic patients was almost twice that of non-diabetic patients. The characteristics of participants with self-reported Rheumatoid Arthritis (RA), Osteoarthritis (OA), and other types of arthritis are detailed in Table 2. More comprehensive demographic and lifestyle characteristics are shown in Extended Demographic and Lifestyle Characteristics of Study Participants in Supporting Information.
Logistic regression revealed the association between diabetes and arthritis
The logistic regression analysis of arthritis before and after covariate adjustments shows that diabetes is significantly associated with arthritis (OR = 2.90; 95% CI: 2.66–3.16) (Table 3). After adjusting for age, gender, race, socioeconomic factors, physical activity, BMI, dietary index, and energy intake, the association remained marginally significant (OR = 1.14; 95% CI: 1.00–1.29). However, after further adjusting the HT, the above association became insignificant (OR = 1.08; 95% CI: 0.95–1.23). When stratified into different types of arthritis, only RA remained significant association with diabetes (OR = 1.12; 95% CI: 1.02–1.32).
Interaction effects of diabetes mellitus and hypertension on arthritis
In the complex sampling logistic regression model examining the interaction between DM and HT about various types of arthritis, the inclusion of the interaction term generally resulted in lower AIC and BIC values, suggesting improved model fit (Table S6). Notably, a significant interaction between DM and HT was observed for ‘Total’ arthritis (P = 0.05) and ‘Other’ types of arthritis (P < 0.001) (Fig. 4). For ‘Total’ arthritis, the interaction term estimate was −0.25 with a 95% CI of [0.61, 1.00], while for ‘Other’ types, the estimate was −0.46 with a 95% CI of [0.50, 0.80]. However, the interaction was not statistically significant for Rheumatoid Arthritis (RA) and Osteoarthritis (OA), with P-values of 0.49 and 0.66, respectively.
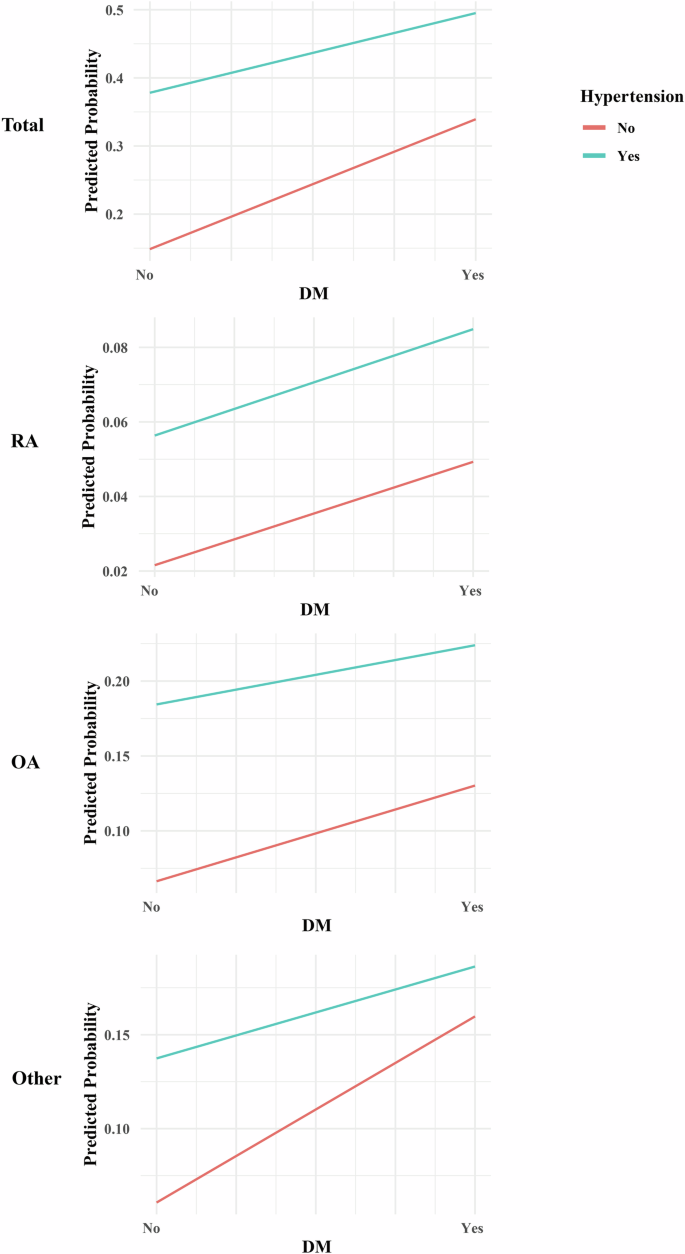
Differences in slope or intersecting indicate an interaction.
Stratified analysis between diabetes mellitus and arthritis types
The subgroup analysis revealed notable variations in the association between arthritis subtypes and diabetes, warranting stratified analyses. Overall, the odds of diabetes were not significantly different for individuals with any type of arthritis compared to those without, with an OR of 1.08 (95% CI: 0.95, 1.23, p = 0.23). However, individuals with Rheumatoid Arthritis (RA) had significantly higher odds of diabetes (OR = 1.12, 95% CI: 1.02, 1.32, p = 0.03), while those with Osteoarthritis (OA) or other types of arthritis did not show a significant association (OR = 0.94, p = 0.42 and OR = 1.15, p = 0.02, respectively). Females with any subtype of arthritis had significantly higher odds of diabetes, with ORs ranging from 1.52 to 1.98 (p < 0.0001), whereas males also showed a significant association with ORs ranging from 1.34 to 1.66 (p < 0.031 to <0.0001). Age-stratified analysis indicated that younger individuals (<45 years) with arthritis had significantly higher odds of diabetes (ORs ranging from 1.71 to 1.91, p < 0.008), while older individuals (>60 years) did not show a significant association. Individuals with hypertension and arthritis had an OR of 1.29 (p < 0.001), whereas those without hypertension but with arthritis had significantly higher odds of diabetes with an OR of 1.94 (p < 0.0001) (Table 4).
Evidence of correlation from MR analyses
Mixed effects were estimated using random effects models for instrumental variables of individual factors. The IVW results suggested that Type I Diabetes had a causal effect on RA (OR = 1.176, 95%CI: 0.048, 0.276, P = 0.005), no causal effect on OA (OR = 1.004, 95%CI: −0.009, 0.016, P = 0.557) and other arthritis (OR = 1.012, 95%CI: −0.015, 0.038, P = 0.384), respectively. Similar outcomes can be seen that Type II Diabetes had no causal effect on RA (OR = 0.977, 95%CI: −0.155, 0.108, P = 0.727), OA (OR = 0.979, 95%CI: −0.076, 0.033, P = 0.444) and other arthritis (OR = 1.041, 95%CI: −0.035, 0.114, P = 0.295). When MR analyses were further studied, these showed a significant association between Type I Diabetes and RA, especially in the MR-Egger model (OR = 1.407, p = 0.002, FDR < 0.001). In contrast, Type II Diabetes demonstrated no significant correlation with any form of arthritis across other MR models. These findings suggest that the genetic predisposition for Type I Diabetes may have a notable impact on the risk of developing RA, while no such relationship was observed for Type II Diabetes (Table 5 and Fig. 5). The simple mode and weighted mode outcomes were conducted in Table S7. The Funnel plot, forest plot and leave one out plot were about diabetes and arthritis conducted in Figs. S4–S16. We also performed a variance heterogeneity test to check the robustness of the IVW results, which showed a low level of evidence of heterogeneity (Table S8). There was no significant horizontal pleiotropy through the outcoming of MR-Egger regression (Table S9). We also used arthritis-associated gene IVs to detect the inverse effect of all subtypes of arthritis risk on type I and type II diabetes. The 1 – SD increase in the causal effect level for arthritis risk was not statistically significant, ruling out the possibility of reverse causality. The detailed SNPs as instrumental variables were listed in Tables S10–S15 additionally. We further conduct reverse MR to assess whether different types of arthritis have a causal relationship with DM. In the causal relationship analysis between RA and DM, we encountered difficulties in extracting sufficient SNPs from the RA database to assess causality. Similarly, in the examination of the causal relationship between OA and DM, only one effective SNP, rs2425059, could be extracted from the OA database, rendering an effective causal inference unattainable. Notably, the instrumental variable (IVW) analysis results indicated a lack of causal relationship between other forms of arthritis and DM1(OR = 0.65, 95%CI: 0.372, 1.140, P = 0.27). Comparable outcomes were observed in the evaluation of the relationship between other forms of arthritis and DM2(OR = 0.93, 95%CI: 0.851, 1.020, P = 0.20) (Tables S16–S18).
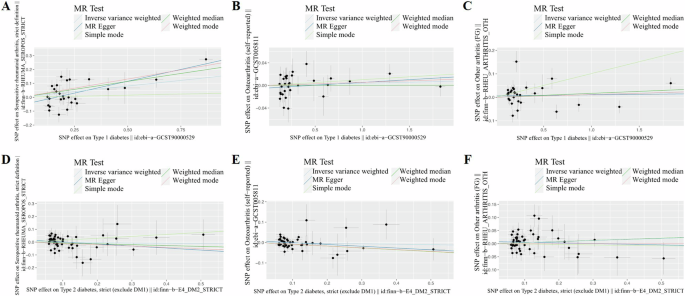
Scatter plot of the MR study investigating the effect: A Type 1 diabetes on rheumatoid arthritis. B Type 1 diabetes on osteoarthritis. C Type 1 diabetes on other arthritis. D Type 2 diabetes on rheumatoid arthritis. E Type 2 diabetes on osteoarthritis. F Type 2 diabetes on other arthritis.
Discussion
There is a potential genetic and epigenetic link between diabetes and arthritis. The current study delves into the intricate connection between diabetes and arthritis through utilizing both empirical data from the NHANES and causal inference methods through Mendelian Randomization. This research endeavor seeks to unravel the complex interplay between these conditions, with a particular focus on Rheumatoid Arthritis (RA), which has been identified as a significant association in our findings. However, after adjusting for HT, the relationship between diabetes and arthritis loses its statistical significance. The use of Mendelian Randomization further strengthens our understanding of the genetic predisposition linking Type 1 DM and RA, while it remains less evident in the context of residual arthritis and diabetes. This study sheds light on the potential genetic factors that contribute to the development of arthritis in individuals with diabetes, shedding new light on the pathogenesis of this complex disorder.
The prevalence of arthritis was found to be almost twice as high in diabetic patients compared to non-diabetic patients, indicating a potential relationship. This association, particularly with RA, supports prior studies linking diabetes and arthritis [22,23,24,25]. Bolla et al. identified a relationship between metabolic syndrome and rheumatoid arthritis, mirroring our observations [26]. Conversely, Okais et al. found diabetes prevalence in RA patients comparable to controls [27], suggesting potential variations in study design or demographics. Mahroug et al. highlighted a link between rheumatoid cachexia and RA disease parameters [28], hinting at shared metabolic disturbances. Sewell et al. reported increased odds of obesity, diabetes, HT, and dyslipidemia in arthritis patients [29], consistent with our findings and emphasizing the intricate relationship between these conditions.
During the regression analysis, total energy intake and physical activity were incorporated into the adjusted model. These variables are recognized as being correlated with both diabetes and arthritis, acting as potential confounders that may distort the genuine relationship between these conditions if not appropriately considered [12, 30]. Total energy intake serves as a reflection of overall dietary patterns, which can exert an influence on metabolic health, subsequently affecting the susceptibility to both diabetes and arthritis. Similarly, physical activity is pivotal in maintaining optimal weight, insulin sensitivity, and joint health, all of which are directly implicated in the onset and progression of both conditions.
Although the logistic regression model showed a significant gross association between arthritis and diabetes, upon adjusting for confounding factors such as age, gender, and race, the strength of this association was attenuated, yielding a marginally significant OR of 1.14. Interestingly, when we further accounted for HT, the association became statistically insignificant with an OR of 1.08. Notably, among the various arthritis subtypes, only Rheumatoid Arthritis (RA) maintained a significant association with diabetes, evidenced by an OR of 1.12. These findings add nuance to this relationship between diabetes and arthritis by showing that it may be confounded by HT, a common comorbidity in both conditions.
The observed interaction between DM and HT in relation to ‘Total’ arthritis and ‘Other’ types of arthritis is noteworthy. When examining DM and HT individually, both conditions have been found to elevate the risk of specific subtypes of arthritis. Nevertheless, upon combining DM and HT, a surprising negative correlation with arthritis incidence was observed. Initially, we postulated the existence of a shared mediator that independently promotes arthritis incidence through both DM and HT. However, upon further investigation, it became evident that the combined influence of DM and HT on arthritis does not exhibit a synergistic effect, where the combined risk exceeds the sum of their risks (i.e., 1 + 1 > 2). Instead, an antagonistic relationship was identified, indicating that the combined effect of DM and HT on arthritis risk is less than the sum of their individual effects (i.e., 1 + 1 < 2). Interestingly, this interaction was not observed for Rheumatoid Arthritis (RA) and Osteoarthritis (OA), indicating that the relationship between DM, hypertension, and these specific arthritis types might be independent or modulated by other factors. This finding is particularly relevant for clinicians as it underscores the importance of comprehensive management of both DM and hypertension in patients with arthritis, and is consistent with guidelines that recommend focusing on diabetes control to manage comorbidities [14, 15]. Further research is needed to elucidate the underlying common influencing factors and clinical implications of these interactions.
Some previous literature seems to suggest a risk factor of diabetes for osteoarthritis [31, 32]. However, our conclusion indicates that there is no definite relationship between the two. The main reason is that this study controlled for confounding factors such as age, gender, BMI, especially hypertension. Additionally, our data was obtained from the NHANES database, which minimized the potential data bias caused by small sample sizes in clinical trials. Undoubtedly, basic experiments demonstrated that a hyperglycemic microenvironment can alter chondrocyte phenotypes and induce oxidative stress, indicating a potential link between diabetes and arthritis [31]. Considering that there exists a significant disparity between ideal experimental conditions and the complex environments of real life, this conclusion seems invalid. Thus, further support from additional clinical trials and theoretical data is required to establish a correlation between diabetes and osteoarthritis.
Notably, our findings suggest there was a strong association between diabetes and arthritis among young adult subjects under 45 years of age, but the association weakened with age, especially after age 60. This contradicts previous research findings suggesting a high comorbid burden of arthritis and prediabetes among people ≥ 65 years of age, females, and non-Hispanic Whites [33]. Age-dependent insulin resistance causes a gradual increase in the prevalence of diabetes in the population. Similarly, the prevalence of arthritis increases owing to age. This could potentially be attributed to a range of factors, including but not limited to, biological predispositions, lifestyle choices, or differential access to healthcare. These findings underscore the importance of targeted interventions and tailored healthcare strategies for these specific demographic groups.
We conjecture that the discordance in the degree of association between the two diseases in young adults and older adults may be attributable to distinct pathological factors that contribute to arthritis. In young adults, mechanical trauma and oxidative stress cause chondrocytes to acquire a deterioration phenotype and produce a series of cytokines and inflammatory mediator-induced arthritis [34]. In elderly patients, the viability of cartilage and subchondral bone cells decreases with age [35]. Programmed death such as autophagy and apoptosis occur, resulting in diabetic-independent progression of OA [36]. Moreover, elderly patients have poorer physical conditions and more confounding factors [30], resulting in a weak correlation between the prevalence of arthritis and diabetes at the age of 60 years. Simultaneously, certain data were omitted during data collection, which may influence the correlation between the two variables.
Considering different arthritis patients, OA has a clear age-related relationship, with OA prevalence increasing with age. However, RA and other types of arthritis have a specific pathogenesis and have little to do with age. Patients with OA are significantly associated with diabetes under the age of 60, whereas patients with RA and other types of arthritis have a correlation between arthritis and diabetes only under the age of 45, indicating that there are different pathogenesis types of arthritis affecting the prevalence of diabetes.
The female patients in this study were found more frequently comorbid with arthritis, which is consistent with previous literature [11,12,13, 23, 24], and there is a clear association between diabetes and arthritis in females across all subtypes of arthritis. The proportion of males with diabetes is higher than that of females. However, neither total arthritis nor individual subtypes of arthritis were associated with diabetes in males. On the one hand, there are gender differences in the absolute levels of sex hormones in diabetes because of gender differences in biological processes linking diabetes and sex hormone production [37]. Clear sex differences were observed in how sex steroid hormones may modulate the risk of DM [38, 39]. Diabetes, Type 2 DM, obesity, and sex differences majorly affect intracellular glucose handling [40], which plays an important role in cartilage matrix formation and chondrocyte metabolism. On the other hand, the male participants in this study were more commonly associated with unhealthy eating habits and chronic stressful environments [41]. These factors may result in more interference between arthritis and diabetes in male patients. The interpretation of results requires more caution.
About half of the adults with prediabetes and arthritis are either physically inactive or obese, increasing their risk of developing Type 2 Diabetes [33]. Excessive physical activity is a risk factor for arthritis. However, we found that non-arthritis patients in this study were more physically active. This could result from arthritis symptoms or an underlying factor in the comorbidity of arthritis and diabetes. Arthritis can hinder the ability of adults with prediabetes to engage in physical activity to induce Type 2 Diabetes. A combination of arthritis and other chronic diseases such as obesity, has been linked to higher levels of physical activity [42]. Moderate physical activity may improve physical function and mobility and lowers blood sugar levels and body weight, thereby decreasing the risk of Type 2 Diabetes and arthritis symptoms.
Furthermore, the MR analyses provide a novel insight into the causal pathways between diabetes and arthritis. Our MR analyses suggested the significant association between Type 1 Diabetes and RA that common genetic factors or pathways may underlie both conditions. This is in line with the known role of chronic inflammation in both diseases [9]. Besides, diabetes does not appear to be a genetic risk factor for other arthritis.
One of the strengths of our study is the use of MR, which minimizes the risk of confounding and reverse causality, thus providing more robust evidence for causality [16,17,18]. Additionally, the large sample size and the use of nationally representative NHANES data enhance the generalizability of our findings. This study has certain limitations. Firstly, potential biases related to self-reported data. Our study relies on self-reported data from participants, which may be subject to recall bias and social desirability bias. These biases can affect the accuracy of the data and the study results [43]. Secondly, unmeasured confounding. While we included multiple known confounders in our analysis, there may still be unmeasured confounding factors that could influence the relationship between the independent and dependent variables [44]. Thirdly, lack of temporality in cross-sectional design. Our study uses a cross-sectional design, which limits our ability to establish causality. Since data were collected at a single point in time, we cannot determine the temporal sequence of the relationships between variables [45]. Fourthly, we lacked conversion of variables during utilizing sensitivity analyses to assess robustness. This approach involves converting continuous variables into categorical variables or vice versa to observe how these transformations impact the model outcomes. Fifthly, the NHANES database in the US is a horizontal questionnaire survey database, and it does not conduct individual follow-up research. This was a retrospective study without evidence for a specific cause-and-effect relationship between arthritis and diabetes. Sixthly, the effects of drugs were not considered in this study. Further research is needed on hypoglycemic drugs used by diabetic patients, NSAID drugs used by arthritis patients, and the relationships between different drugs and between drugs and diseases. Finally, there was missing data concerning the confounding variables. Further prospective cohort studies or animal models can better exemplify the question.
Conclusion
In conclusion, our study provides evidence for a significant association between diabetes and arthritis, particularly RA. While hypertension appears to confound this relationship, a genetic predisposition for Type 1 Diabetes may increase the risk of developing RA. Further studies are needed to confirm these findings and explore their clinical implications.
Responses