The immediate alteration of cerebellar Glx/GABA and cerebello-thalamo-cortical connectivity in patients with schizophrenia after cerebellar TMS

Introduction
Cerebellar dysfunction is one of the most consistent pathophysiological features of schizophrenia (SCZ)1,2,3,4,5. Abnormal cerebellar-cortical functional connectivity has been repeatedly observed in first-episode patients, chronic patients, individuals at clinical or genetic risk for schizophrenia, and even youths with mild childhood psychotic experiences, suggesting its potential as a reliable trait marker for psychosis6. Furthermore, our previous research showed that the cerebello-thalamo-cortical (CTC) circuitry hyperconnectivity serves as a robust, state-independent neural signature for psychosis, as this abnormal connectivity did not significantly normalize over a two-year follow-up period in schizophrenia patients7.
Meanwhile, neurotransmitters are the material basis for the functional activity of the cerebellum. Specifically, gamma-aminobutyric acid (GABA), an inhibitory neurotransmitter, serves as the primary mediator for inter-synaptic information transfer in Purkinje cells, which constitute the sole output of the cerebellar cortex. The abnormal expression of GABA-related proteins and genes8,9,10,11 in animal12 and postmortem studies8,13 indicates that impaired GABAergic neurons are the neurobiological basis of cerebellar dysfunction in SCZ8,9,10,11,12,13. A recent neuroimaging study quantifying in vivo GABA levels also revealed that higher cerebellar GABA level was associated with lower verbal fluency performance in SCZ14. On the other hand, glutamate (Glu), an excitatory neurotransmitter, facilitates neuronal excitation and activity within the nervous system. Additionally, astrocytes convert glutamate into glutamine, which is then transported back to neurons where it is reconverted into glutamate, establishing a cycle between neurons and astrocytes15. The imbalance between excitatory and inhibitory influences (E/I imbalance) in the brain has been proposed as a potential mechanism underlying SCZ16. Some evidence suggests an E/I imbalance in language and cognitive control regions in SCZ patients17. Due to the limitations of the measurement techniques and the multiple roles of these neurometabolites, magnetic resonance spectroscopy (MRS) cannot distinguish between glutamate and glutamine, so they are collectively referred to as Glx. Consequently, relative changes in Glx (glutamate + glutamine) and GABA levels could partially reflect the E/I state. Furthermore, studies assessing the reproducibility of GABA and glutamate measurements in a comparison group without medication, both within the same day and two weeks apart, have shown stable levels18. This suggests that the observed neurotransmitter changes in our study are unlikely to result from the passage of time alone, but rather from interventions that induce change. This reinforces the reliability of our cerebellar neurochemical measurements.
Recent studies suggest that intermittent theta-burst stimulation (iTBS)19 of the cerebellum alleviates negative symptoms in schizophrenia by modulating functional connectivity (FC) within the cerebellar-prefrontal network. This effect may result from increased excitatory postsynaptic potentials, which enhances neuronal excitation at the stimulation site20, as well as regulation of neurotransmitter secretion21. However, the immediate effects of cerebellar transcranial magnetic stimulation (TMS) on CTC circuitry and cerebellar neurotransmitters in SCZ remain unclear, which is crucial for understanding the therapeutic mechanisms of TMS.
To achieve these objectives, we administered two sessions of iTBS to participants and conducted magnetic resonance imaging (MRI) scans at baseline and immediately after stimulation. We then measured cerebellar GABA and Glx levels, along with FC within the CTC circuitry. Our goal was to explore alterations in CTC connectivity, cerebellar GABA, and Glx levels before and after TMS, providing insights into the neurotransmitter mechanisms underlying CTC hyperconnectivity and the therapeutic effects of TMS. We hypothesize that schizophrenia patients exhibit CTC hyperconnectivity, potentially mediated by altered cerebellar GABA and/or Glx levels. The immediate effects of cerebellar iTBS in SCZ are expected to normalize GABA and/or Glx, though they may not significantly reduce CTC hyperconnectivity. Consistent with previous research, we anticipated an elevation in cerebellar GABA in schizophrenia patients14.
Methods
Participants
A total of 22 patients with stable SCZ and 26 demographically matched HCs were recruited. All the patients were on regular antipsychotic medication and stable. All patients with SCZ were recruited from the West China Hospital Mental Health Center of Sichuan University from August 2021 to May 2023. The diagnosis was made by experienced psychiatrists using structured clinical interviews based on the Diagnostic and Statistical Manual of Mental Disorders, Fifth Edition (DSM-V), including the Structured Clinical Interview for DSM (SCID)22. The HCs were recruited through posters and website advertisements and filtered using a non-patient version of the clinical definitive interview (Structured Clinical Interview for the DSM-Non patient edition, SCID-NP) to ensure no history of mental illness among HCs and their first- and second-degree relatives. The severity of psychotic symptoms in the participants was assessed using the Positive and Negative Syndrome Scale (PANSS)23 before the MRI scanning. The PANSS was administered to the HCs to ensure that we could differentiate between symptomatology in schizophrenia patients and the absence of symptoms in healthy individuals. To ensure accurate symptom capture, we followed the standardized PANSS administration procedures, and all assessments were conducted by trained clinicians with experience in administering the PANSS. All participants were right-handed. Stabilized individuals with schizophrenia must fulfill specific criteria, demonstrating sustained stability in mental mood and symptoms throughout the experimental phase (i.e., no psychiatric hospital admissions, acute exacerbations, or imprisonments). This entails maintaining a score below 4 for each positive symptom on the PANSS for a minimum duration of 6 months24. All SCZ patients were prescribed second-generation antipsychotic medications according to clinical guidelines. Daily dosages of antipsychotic drugs were converted into chlorpromazine (CPZ) equivalents. Participants were excluded if they1 were pregnant or lactating women2, had a history of any neurologic illnesses, such as brain tumors, epilepsy, and so forth3, exhibited contraindications to MRI, such as claustrophobia or metal-containing implants in the body4, had alcohol and drug dependence or abuse5, were intolerant to prolonged sitting or supine positions during TMS treatment, and6 had incomplete MRI data or poor image quality. Besides, only edited spectra with GABA and Glx fitting error of less than 15% were included in the final analyses to further ensure the robustness of our results25. Three patients with SCZ were excluded because of high fitting errors and slight involuntary head movements during MRI scanning, leaving a final cohort of 19 patients with SCZ and 26 HCs (Table 1). The two groups were sex-matched, but the patients with SCZ were considerably older than the HCs.
The study was approved by the Ethics Committee on Biomedical Research, West China Hospital of Sichuan University. All participants or their guardians were informed of the study details, a full understanding of the study protocol, and signed an informed consent form.
Data acquisition
All participants underwent two MRI scans immediately before and after TMS using a 3.0 T MRI scanner (Ingenia Elition, Philips Healthcare, the Netherlands) with a 32-channel head coil at the West China Hospital of Sichuan University (Fig. 1). The structural sequence and parameters were as follows: high-resolution 3-dimensional turbo field echo T1-weighted (3D-T1) images with repetition time/echo time (TR/TE) = 7.8/3.7 ms, slice thickness = 1 mm, sagittal slices = 181, flip angle = 8°, matrix = 256 × 256, field of view = 256 × 256 mm2, and voxel size = 1.0 × 1.0 × 1.0 mm3. High-resolution resting-state blood-oxygen-level-dependent (BOLD) images were acquired using an echo-planar imaging (EPI) sequence with the following parameters: TR/TE = 4000/35 ms, slice thickness = 2.2 mm (no slice gap), slice number = 65, flip angle = 90°, matrix = 144 × 144, field of view = 220 × 220 mm2, voxel size = 1.5 × 1.5 × 2.2 mm3, scan time = 20 min, and total time points = 300 (150 time points with posterior-anterior phase-encoding directions and 150-time points with anterior-posterior phase-encoding directions). The two EPI acquisitions with opposite phase-encoding directions were used to perform EPI distortion correction.

Both schizophrenic patients and healthy controls followed this flow to acquire data. At baseline, MRI scans and PANSS measures were completed. Afterwards, subjects were directed to the TMS treatment room for TMS. The stimulation area was the posterior part of the cerebellum near the midline, and the coil was placed as shown in the figure. Immediately after TMS, subjects underwent another MRI scans. Both MRI scans contained 3D-T1, BOLD and MRS. SCZ schizophrenia; HC healthy controls; 3D-T1 3-dimensional turbo field echo T1-weighted images; BOLD blood-oxygen-level-dependent images; MRS magnetic resonance spectroscopy; TMS transcranial magnetic stimulation; iTBS intermittent theta-burst stimulation.
We used the MEscher-GarwOod point resolved spectroscopy (MEGA-PRESS) sequence26,27 for detecting the cerebellar GABA content, which performed interleaved excitation during the scan28. The MEGA-PRESS sequence parameters were as follows: TR/TE = 2000/68 ms, acquisition bandwidth = 2000 Hz, phase cycles = 8, averages = 144 on and 144 off, and scan duration = 10 min 12 s. The variable power and optimized relaxation delays were used for water suppression. The second-order shimming (pencil beam volume) was used for improved field homogeneity. For each participant, a voxel of interest (VOI) of 30 × 20 × 20 mm3 was placed at the left crus I/II of cerebellum. Given that the MEGA-PRESS sequence imaging time was 10–15 min, and considering the brief immediate effects of TMS, and the “Universal Cerebellar Transform” theory suggests that the cellular structure of the cerebellar cortex is evenly distributed29, we chose to acquire only the left cerebellar MEGA-PRESS sequence to ensure that the BOLD sequence could be effectively collected within the available time frame following TMS. The measured GABA signal using the MEGA-PRESS protocol is commonly referred to as GABA+ with the contribution from macromolecules.
Transcranial magnetic stimulation
After the baseline MRI scan, the participants underwent TMS. Focal magnetic stimulation was applied using the M-100 Ultimate pulsed magnetic field stimulator (Shenzhen Yingchi Technology Co., Ltd, China) and oil-cooled figure-of-eight coils (70-mm outside diameter per wing). We introduced the QuickVision neuro-navigation system (Shenzhen Yingchi Technology Co., Ltd, China) to build the head model using 3D-T1 images for obtaining more accurate target localization and online control of coil positioning.
TMS was first applied to the bilateral M1 to determine the resting motor threshold (MT) as the base reference value for subsequent stimulation. In the single-pulse mode, the bilateral M1 was stimulated separately, and the MT was determined according to the involuntary contractions of the fingers. The final selected threshold was the average of the bilateral MT. Then, the TMS coil was pointed to the middle of the bilateral crus I/II of the posterior cerebellum (Fig. 1 and Figure S1)30. Each participant underwent two sessions of iTBS. The iTBS was specifically chosen due to its excitatory metaplastic effects. Both iTBS sessions were delivered at the same location. The iTBS sequence consisted of 600 pulses applied in a theta-burst pattern (bursts of 3 stimuli at 50 Hz repeated at a 5-Hz frequency) with 20 trains, each lasting 2 s and an intertrain interval of 8 s (total stimulation time of 3 min 12 s), with a stimulation intensity of 80% of MT. Each participant received a total of 1200 pulses across the two sessions, with a minimum interval of 15 min between sessions. Previous studies have demonstrated the safety of delivering 1200 pulses to the cerebellum at 80% of the individual’s MT31,32. The two consecutive iTBS sessions were conducted in order to maximize the immediate effects of cerebellar stimulation and minimize potential confounds related to time delays between sessions.
After completing TMS, participants were immediately guided to the MRI suite for the second scan without delay. To minimize the time interval between the final iTBS session and the MRS scan, only localizer and T1-weighted imaging sequences were performed prior to MRS acquisition, ensuring the interval typically remained under 10 min.
Resting-state functional MRI preprocessing
Before processing the resting-state functional MRI (rs-fMRI), a recon-all needed to be executed on 3D-T1 images using FreeSurfer software (version 6.0, https://surfer.nmr.mgh.harvard.edu/) to segment the cortical structures as a template for subsequent rs-fMRI registration.
The Computational Brain Imaging Group (https://github.com/ThomasYeoLab/CBIG) toolbox was used to preprocess the rs-fMRI data including the slice time correction, motion correction by calculating the framewise displacement (FDrms) and voxel-wise differentiated signal variance (DVARS)33,34 and removing frames by either FDrms > 0.2 or DVARS > 50, spatial distortion correction, nuisance regression, temporal interpolation of censored frames, bandpass filtering at 0.009–0.08 Hz, projections to standard surface (fsaverage 5), and smoothing with a kernel size of 6 mm. For further details, please refer to the supplementary materials.
CTC circuitry construction
After preprocessing, we extracted the mean time series from each of the 270 nodes in the extended Power Atlas as described in a previous study7,35. The mean time series for each of the 270 nodes in the extended Power atlas were extracted from the preprocessed images. Each node represented as a sphere with a 5 mm radius, centered on a specific coordinate point (https://github.com/brainspaces/power264). It is important to note that the original Power atlas included 264 nodes, but excluded regions such as the hippocampus, bilateral amygdala, and bilateral ventral striatum. To ensure complete brain coverage, Cao et al. added these additional nodes36.
For each participant, we constructed a 270 × 270 pairwise whole-brain connectivity matrix by calculating the Pearson correlation coefficient between the extracted time series. A Fisher’s z-transformation was then applied to the functional connectivity matrix to normalize the correlation values. The connectivity strength of the previously reported CTC circuitry was extracted from these connectivity matrices7. The reported CTC network, including 84 links, was mainly concentrated in the thalamus and posterior cerebellum35,37. A detailed list of these edges is provided in Table S1.
MEGA-PRESS preprocessing
The MEGA-PRESS sequences were quantified using the GANNET 3.0 toolkit (http://www.gabamrs.com), a MATLAB-based quantitative batch analysis tool specifically for GABA/Glx-edited MRS28, which required invoking Statistical Parametric Mapping Software 12 (SPM12, http://www.fil.ion.ucl.ac.uk/spm) for segmentation of cerebellar tissue. The metabolite levels were referenced to the unsuppressed water signal, and the GABA and Glx levels were corrected using the proportion of gray matter, white matter, and cerebrospinal fluid (CSF) within the VOI. Additionally, 16 unsuppressed-water signal averages were also acquired as an internal concentration reference. To ensure the accuracy of the cerebellar segmentations, we performed visual quality assurance on each participant’s VOI, specifically checking for correct segmentation.
Furthermore, TMS treatment necessitates the subject to vacate the scanner bed, necessitating the relocation and repositioning of the cerebellar VOI for the post-TMS scan. It is imperative that the two VOIs (pre- and post-TMS) are positioned in approximate alignment to facilitate the comparison of neurotransmitter changes within the VOIs. To achieve this, we computed the overlap rate between the two VOIs. Image registration of the left cerebellar VOIs before and after TMS was conducted using the Functional Magnetic Resonance Imaging of the Brain Software Library (FSL, version 6.0, https://fsl.fmrib.ox.ac.uk/fsl/fslwiki)38,39 to ascertain the extent of VOI overlap, thereby determining whether the VOI remained in the same position pre- and post-TMS.
Statistical analysis
Linear Mixed-Effects Model (LMEM) was employed to assess trends in mean CTC connectivity at baseline and post-TMS. Subsequently, two-sample t-tests were conducted to compare mean CTC connectivity between SCZ patients and HCs at both baseline and post-TMS. Sex, age, and CPZ equivalents were included as covariates. Likewise, LMEM and two-sample t-tests were employed to analyze GABA and Glx levels, and Glx/GABA ratio at baseline and post-TMS.
The FCs of the 84 links within the CTC circuitry were compared between SCZ patients and HCs using two-sample t-tests at baseline and post-TMS, adjusting for sex, age, and CPZ equivalents as covariates. Multiple comparisons were corrected using the false discovery rate (FDR) at a significance level of P < 0.05.
First, we calculated the correlations between the PANSS total score and symptom scores with mean CTC connectivity, Glx, GABA, and the Glx/GABA at baseline. Second, we assessed the correlations between mean CTC connectivity and GABA, Glx, and the Glx/GABA ratio at both baseline and after TMS within the SCZ and HC groups, respectively. Additionally, we analyzed the correlation between baseline symptom scores and changes in mean CTC connectivity, GABA, Glx, and the Glx/GABA ratio (from baseline to post-TMS).
Furthermore, to explore the relationship of GABA, Glx, and Glx/GABA with CTC hyperconnectivity in SCZ patients, the magnitude of the mediation effect was calculated at baseline. Mediation analyses were conducted to investigate the role of cerebellar GABA, Glx, and the Glx/GABA ratio as mediators in the relationship between group and mean CTC connectivity. For each mediation analysis, the group was set as the independent variable, with the corresponding neurochemical measure (GABA, Glx, or Glx/GABA) as the mediator, and mean CTC connectivity as the dependent variable. The significance of the indirect effect was tested using bootstrapping with 5000 resamples.
Two-sample t-tests were employed to assess differences in MT values, cerebellar VOI overlap rates, GABA and Glx peak fitting errors, and within-VOI segmentation ratios (including gray matter, white matter, and CSF) between SCZ and HC groups at baseline and post-TMS, with adjustments made for sex and age.
Demographic and clinical data were compared between the two groups using the Pearson chi-square test for sex distribution and the two-sample t-test for age distribution and scale scores. All statistical analyses were conducted using R (version 4.2.1), with significance set at P < 0.05.
Results
CTC connectivity
LMEM showed no statistically significant differences among groups, time points, or their interaction (all PFDR > 0.05, Table S2). Figure 2 illustrates the distribution of mean CTC connectivity at baseline and the changes before and after TMS. Consistent with prior research, the SCZ group exhibited significantly heightened mean connectivity of the CTC circuitry compared to the HC group (t = −2.28, PFDR = 0.03, Table S3). Following TMS, although the mean CTC connectivity remained elevated in SCZ compared to HC, the difference between the two groups was not statistically significant (t = −0.97, PFDR = 0.34).
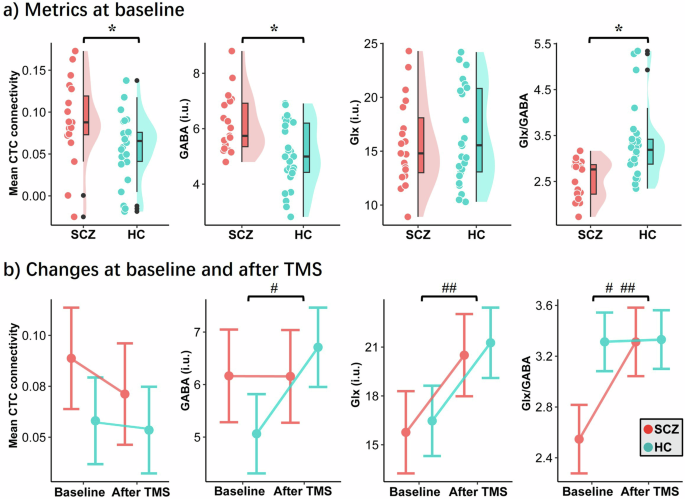
Mean CTC connectivity, GABA and Glx levels in cerebellum, and Glx/GABA ratio distribution between SCZ and HC groups at baseline (a), and changes after TMS (b). CTC, cerebello-thalamo-cortical; GABA gamma-aminobutyric acid, Glx Glutamate + Glutamine, TMS transcranial magnetic stimulation, SCZ schizophrenia, HC healthy controls. * indicates a statistically significant difference ; # indicates a statistically significant difference of interaction between group and time point in linear mixed-effects model; ## indicates a statistically significant difference of time point in linear mixed-effects model (P < 0.05).
Within the CTC circuitry, FCs that exhibited significant differences after FDR correction were primarily localized in the right cerebellum with the right posterior central gyrus, and the left thalamus with the left occipital lobe and the right middle temporal gyrus (Fig. 3, Table S4). The differences in CTC hyperconnectivity between SCZ patients and HCs were no longer statistically significant after TMS.
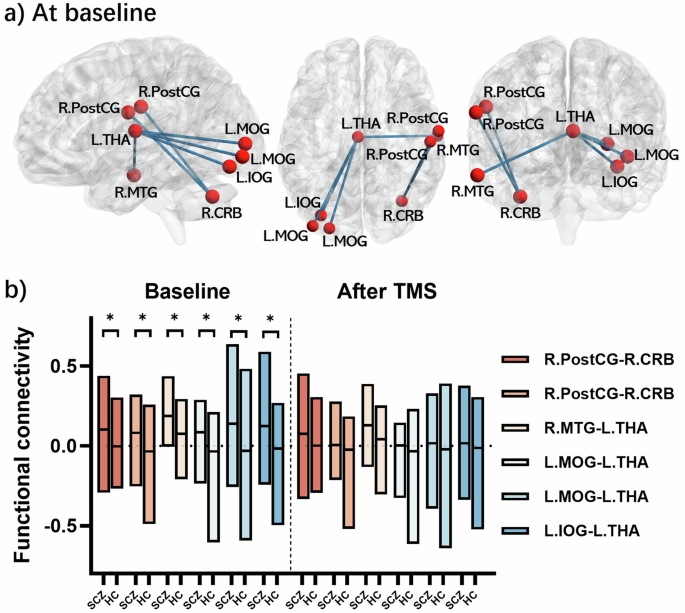
a connections distribution map; (b) box plot of links of patients and controls at baseline and after TMS, lines at medians. TMS transcranial magnetic stimulation; SCZ schizophrenic patients; HC healthy control; R.PostCG right postcentral gyrus, R.CRB right cerebellum, R.MTG right middle temporal gyrus, L.THA left thalamus, L.MOG left middle occipital gyrus, L.IOG left inferior occipital gyrus.
Cerebellar GABA and Glx content, and Glx/GABA ratio
The VOI overlap rates were high for both groups (0.80 ± 0.06 and 0.85 ± 0.08 for the SCZ and HC groups, respectively), and there was no significant difference between them (PFDR = 0.20, Fig. 4). This indicated that the VOI placements of MRS were almost at the same voxel locations between the two MRI scans. There was no significant difference (PFDR > 0.05) observed in the GABA and Glx peak fitting errors, segmentation ratio, and MT between the SCZ and HC groups (Table S5).
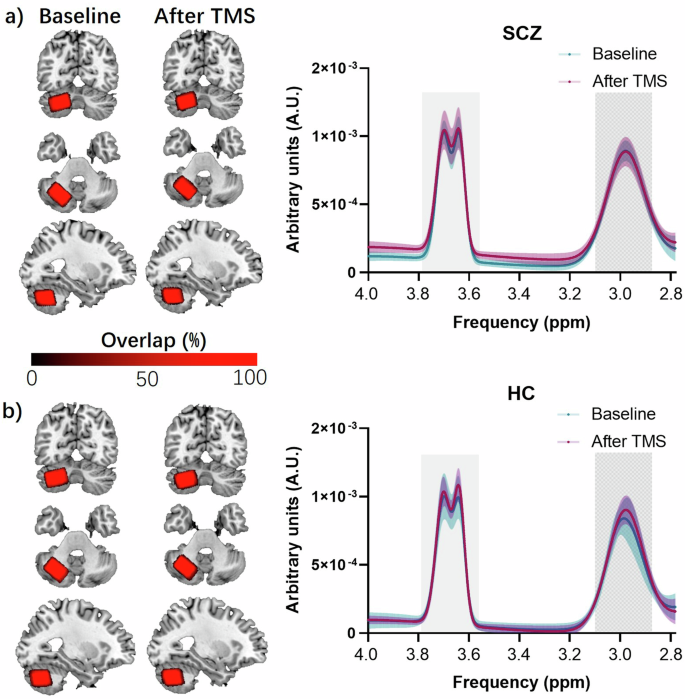
Overlap of cerebellar VOI and fitting curve of GABA and Glx in schizophrenic patients (a) and healthy controls (b). The brain images indicate the overlap of VOI, where the first column is baseline and the second column is after TMS, with red indicating high overlap and dark indicating low overlap. The right panel indicates the fitting curves of the MEGA-PRESS in groups, with the peaks of GABA at ~3.0 ppm and Glx at ~3.75 ppm on the X-axis (proton frequency), where the blue curve represents that at baseline and red represents that after TMS. TMS transcranial magnetic stimulation, SCZ schizophrenia patients, HC healthy controls.
Regarding GABA, LMEM showed statistically significant differences in the interaction between group and time point (t = 2.91, PFDR = 0.006, Table S2). At baseline, the GABA content in the left cerebellar VOI was significantly higher in the SCZ group compared to the HC group (t = −2.98, PFDR = 0.005). Following TMS, the GABA content increased in the HC group but remained unchanged in the SCZ group, resulting in no statistically significant difference in GABA levels between the two groups (t = 0.26, PFDR = 0.79, Fig. 2, Table S3).
LMEM revealed significant differences in time point (t = 3.93, PFDR < 0.001), indicating lower Glx levels at baseline (Table S2). The concentrations increased in both SCZ and HC groups following TMS, with no statistically significant difference between the two groups observed either at baseline or after TMS (all PFDR > 0.05, Fig. 2, Table S3).
Regarding Glx/GABA, LMEM showed the statistically significant difference in the time points (t = 4.30, PFDR < 0.001), as well as the interaction between group and time point (t = −3.19, PFDR = 0.003, Table S2). At baseline, the Glx/GABA ratio was significantly lower in SCZ patients compared to HCs (t = 3.79, PFDR < 0.001), while after TMS, there was no significant difference in the Glx/GABA ratio between SCZ patients and HCs (t = −1.27, PFDR = 0.21, Fig. 2, Table S3).
Correlation and mediation analysis
There was no observed correlation between mean CTC connectivity and the severity of clinical symptoms in SCZ patients at baseline (r = −0.22, PFDR = 0.37), consistent with findings from our previous study7. However, we identified a positive correlation between mean CTC connectivity and cerebellar GABA content (r = 0.67, PFDR = 0.002, Fig. 5a) in SCZ group at baseline, while no significant correlations were observed with Glx (r = 0.45, PFDR = 0.05) or the Glx/GABA ratio (r = 0.05, PFDR = 0.85). Following TMS, there were no significant correlations observed between mean CTC connectivity and either neurotransmitter or the ratio (all PFDR > 0.05).
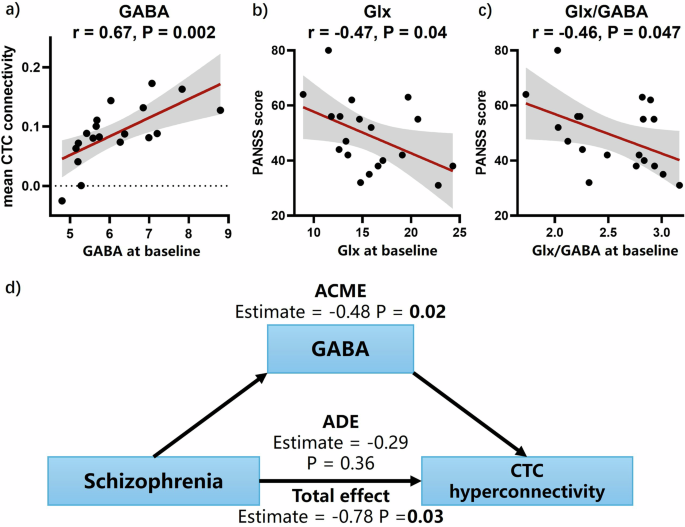
Correlation of mean CTC connectivity with GABA (a) and PANSS total score with Glx (b) and Glx/GABA (c), mediation analysis of cerebellar GABA on CTC hyperconnectivity in SCZ (d). Abbreviations: CTC, cerebello-thalamo-cortical; Glx, Glutamate + Glutamine; GABA, gamma-aminobutyric acid; PANSS, positive and negative syndrome scale; ACME, average causal mediation effect; ADE, average direct effect.
We also observed weak negative correlations between cerebellar Glx (r = −0.47, PFDR = 0.04, Fig. 5b) and the Glx/GABA ratio (r = −0.46, PFDR = 0.047, Fig. 5c) with PANSS total score in SCZ at baseline. In contrast, GABA showed no correlation with clinical symptom severity (r = −0.28, PFDR = 0.24). None of the above correlations were observed in the HC group.
Additionally, baseline mean CTC connectivity was significantly associated with the negative symptoms of difficulty in abstract thinking, and lack of spontaneity and flow of conversation in schizophrenia patients. It showed significant correlations with four general psychopathology symptoms: motor retardation, lack of judgment and insight, disturbance of volition, and active social avoidance in SCZ patients (Table S6). Meanwhile, Glx was correlated with conceptual disorganization, poor rapport, and depression (Table S8). We did not find significant correlations between baseline symptoms and the changes in mean CTC connectivity, GABA, Glx, and Glx/GABA before and after TMS (Table S6–S9).
We observed a significant mediation effect of GABA on CTC hyperconnectivity in SCZ patients at baseline (Fig. 5d), with an average causal mediation effect (ACME) of −0.48 (95% confidence interval [CI] −0.88 ~ −0.14, PFDR = 0.02), an average direct effect (ADE) of −0.29 (95% CI −0.60 ~ 0.27, PFDR = 0.36), and a total effect of −0.78 (95% CI −0.96 ~ −0.41, PFDR = 0.03). Conversely, cerebellar Glx content and the Glx/GABA ratio exhibited no significant mediation effect on CTC hyperconnectivity in SCZ (Table S10).
Discussion
Our study investigated the impact of cerebellar TMS on CTC circuitry and neurotransmitter levels in SCZ patients, offering novel insights into the molecular mechanisms underlying cerebellar dysfunction in SCZ. First, we observed that CTC hyperconnectivity remained relatively stable following cerebellar TMS. Second, dysfunction in cerebellar GABAergic neurons may be one of the key mechanisms driving CTC hyperconnectivity in SCZ. Third, the Glx/GABA ratio correlated with the severity of clinical symptoms in SCZ patients, and cerebellar iTBS partially restored this ratio. The integration of TMS and MRS holds promise for advancing our understanding of brain networks and neurotransmission, elucidating the mechanisms underpinning TMS treatment effects in SCZ patients.
Patients with SCZ in this study exhibited CTC hyperconnectivity compared to HCs at baseline, aligning with previous research2,6,7,35,37. The linear mixed-effects model did not reveal a significant interaction between time points and groups regarding the mean CTC connectivity between patients and HCs, which is consistent with our previous research and suggests that CTC hyperconnectivity is a stable indicator in patients with schizophrenia7. Notably, CTC hyperconnectivity has been associated with reduced physical activity in SCZ patients40. Our study also found that CTC connectivity in schizophrenia patients was significantly correlated with motor retardation. Psychomotor slowing is associated with reduced cortical inhibition, as demonstrated by decreased motor evoked potentials and altered intracortical inhibition. These inhibitory deficits contribute to increased neural noise, which in turn affects motor network connectivity and leads to slower motor responses41. However, we also observed a slight, non-significant decrease in mean CTC connectivity in both patients and HCs following TMS. This could potentially be explained by increased system noise from elevated excitatory neurotransmitters.
Some connectivity within the CTC circuitry was observed to be higher in SCZ patients, one of which was the connectivity between the cerebellum and the sensorimotor cortex. These alterations in connectivity have previously been associated with neurological soft signs in SCZ patients42. The increased connectivity between the cerebellum and the sensorimotor cortex may reflect an excessive error-input proposition and a compensatory output mechanism35. In this framework, hyperconnectivity may arise from erroneous environmental perceptual processing, or equilibrium could be re-established by enhancing cerebellar efferent communication with the motor cortex, compensating for deficiencies underlying the disorder35,43,44. Additionally, hyperconnectivity between the left thalamus and the left occipital lobe, as well as the right middle temporal gyrus, has consistently been identified as a robust proof for SCZ45,46,47,48. These aberrant connections are believed to be linked to sensory gating deficits and impairments in cognitive control, which affect error and conflict monitoring and may contribute to perceptual disturbances and “cognitive dysmetria” in patients49. Abram et al. demonstrated that deficient pons-to-cerebellum connectivity contributes to sensory prediction network breakdowns, which are associated with perceptual abnormalities such as hallucinations and delusions in schizophrenia50. While our study did not directly assess sensory prediction accuracy or hallucination severity, the significant correlation between CTC connectivity and certain negative symptoms–such as lack of spontaneity and difficulty in abstract thinking–suggests that altered cerebellar connectivity could play a broader role in the cognitive and perceptual disruptions characteristic of schizophrenia.
These differences in hyperconnectivity were not significantly reduced after cerebellar TMS, which also aligns with findings from another study that indicated dysfunctional connectivity between the cerebellum and the frontal cortex correlated with negative symptoms, and that correcting this dysfunction with cerebellar TMS could ameliorate negative symptoms in SCZ patients30.
GABA is the main inhibitory neurotransmitter in the brain, and disruptions in GABAergic neurotransmission are potential contributors to the pathophysiology of SCZ51,52. It was speculated that GABA content would be reduced, but we observed the opposite. One possible explanation is that not all GABAergic neurons are dysfunctional in SCZ53. Dysfunction of GABAergic neurons in SCZ may be cell-type specific, allowing the compensatory synthesis of GABA by unimpaired neurons leading to higher GABA levels54. Several studies have supported this hypothesis. The 67 and 65 isoforms of glutamic acid decarboxylase (i.e. GAD67 and GAD65) are the key enzymes for GABA biosynthesis55. Decreased levels of GAD67 messenger RNA (mRNA) have been observed in SCZ, leading to altered GABA levels55,56. However, only 30% of GABAergic interneurons in the postmortem cortex of SCZ have been detected in this phenomenon, whereas the other neurons in which GAD67 mRNA can be detectable have normal levels54. Few studies have also reported no evidence of GAD65 alterations in patients with SCZ56,57. Alternatively, as in the phenomenon observed in neocortical GABAergic interneurons, lower GABA synthesis in parvalbumin neurons also includes the possibility that other interneurons release greater-than-normal levels of GABA27,58,59. Also, this phenomenon may involve abnormal function of the GABA transporter or vesicular GABA transporter in patients with SCZ60,61. Thus, compensatory synthesis of GABA by unaffected GABAergic neurons, in response to damage to other GABAergic neurons, could explain the high baseline GABA levels observed in SCZ patients. This may also explain why patients do not show elevated GABA levels after TMS, as HCs do–because the unimpaired neurons were already in an overcompensated state and could not release additional GABA. It is important to emphasize that this remains speculative, based on experimental results, and requires confirmation through pathophysiological studies.
Cerebellar GABA content has a significant mediation effect on CTC hyperconnectivity, suggesting that the underlying mechanism of hyperconnectivity may be GABA-related. The cerebellum is primarily involved in inhibitory transmission through GABA. Elevated cerebellar GABA levels in patients with SCZ might increase functional activities of inhibitory neurons, potentially leading to hyperconnectivity62. Recent physiological measures have shown that in schizophrenia, resting-state FC between the primary motor cortex, the anterior cingulate cortex, and the cerebellum increases with stronger cortical inhibition, while the amplitudes of motor evoked potentials were lower in SCZ patients and the short-interval intracortical inhibition/motor evoked potentials amplitude ratio was higher than in HCs, suggesting lower cortical inhibition in these patients41. This finding suggests that enhanced cortical inhibition may play a key role in CTC hyperconnectivity. In addition, SCZ patients often exhibit dysregulation in neuronal activity, including abnormal firing patterns and synaptic dysfunction. This dysregulation may lead to an increase in cerebellar GABA levels as a compensatory mechanism to stabilize neuronal activity. However, this excessive GABAergic modulation may inadvertently enhance the strength of CTC FC. Nonetheless, the etiology of SCZ is multifaceted, necessitating further investigation into the precise role of cerebellar GABA in this process.
Following cerebellar TMS, the Glx/GABA ratio tended to normalize in patients with schizophrenia. At baseline, SCZ patients exhibited a significantly lower Glx/GABA ratio compared to HCs, suggesting an imbalance between excitatory (Glx) and inhibitory (GABA) neurotransmission in the cerebellum. The imbalance, resulting from elevated GABA levels, may contribute to the pathophysiological CTC hyperconnectivity, as excessive inhibition could distort the normal regulation of neuronal activity and connectivity. After TMS, while GABA levels remained unchanged—possibly reflecting a complex interplay between compensatory mechanisms and the ceiling effects of GABAergic activity in the cerebellum—here was a significant normalization of the Glx/GABA ratio, accompanied by an increase in Glx levels. This change suggests that TMS may have modulated the E/I balance in a way that increased the excitatory neurotransmitters. Many studies have shown that E/I imbalance in the brain is proposed as a potential mechanistic framework underlying SCZ pathophysiology, representing a widespread microcircuit-based alteration implicated across neurodevelopmental disorders16,63. More importantly, in HCs, both GABA and Glx levels increased following iTBS, suggesting that iTBS simultaneously enhances both excitatory and inhibitory neurotransmission. This coordinated increase in both neurotransmitters likely reflects the balanced E/I modulation that is characteristic of healthy brain function, where a dynamic equilibrium between excitatory and inhibitory signals is maintained. In contrast, SCZ patients exhibit a ceiling effect in GABA levels, which limits the potential for further increases in inhibitory neurotransmission following iTBS. However, in these patients, Glx levels could still be elevated, leading to a normalization of the Glx/GABA ratio. This suggests that although the inhibitory system in SCZ patients is less responsive to iTBS due to the already elevated GABA levels, the excitatory system can still be modulated. It should be noted that all participants in our study were prescribed antipsychotic medications, which are known to influence neurotransmitter systems, including GABA and glutamate. Although the effects of antipsychotic medications on neurotransmitter levels were therefore likely consistent before and after TMS, and CPZ equivalents were included as covariates in the statistical analysis to account for potential effects of antipsychotic dosage, it is important to consider that benzodiazepines, which act by enhancing GABAergic activity through GABA A receptor modulation, could influence baseline neurotransmitter levels and potentially interact with TMS-induced changes.
Our study had certain limitations. First, the small sample size and lack of age matching between the two groups are noteworthy. Obtaining a control group that perfectly matched the age distribution of SCZ was difficult due to limited sample resources, leading to differences in age distribution between the groups. We used sex and age as the covariate in the statistical process to somewhat reduce the effect of age mismatch. Nevertheless, it is imperative to achieve as close an age match as possible between groups in future studies to minimize potential unreliability stemming from age differences. Moreover, the small clinical sample size may limit the statistical power of some analyses, including the mediation analyses. Given this limitation, some observed effects may not withstand multiple comparison corrections, and caution should be exercised when interpreting these findings. Thus, this study could be considered exploratory, and further research with larger sample sizes is necessary to validate the observed effects. Second, while we used a general clinical instrument to assess symptom severity, the PANSS includes only single items for certain symptom domains. This limited assessment may not fully capture the complexity of the symptoms, particularly those most relevant to CTC circuitry alterations. Future studies could benefit from using more specific or comprehensive measures to better characterize symptomatology related to CTC connectivity. Third, the inclusion of patients using antipsychotic drugs poses a potential limitation. Despite employing a matched-pair study design, residual confounding effects attributable to medication usage cannot be entirely ruled out. Future studies could mitigate this concern by selecting drug-naïve patients. Fourth, another limitation of this study is the absence of a sham condition, which would have allowed for a more precise comparison of the effects of cerebellar iTBS on CTC connectivity. Future research should include a sham condition to better isolate the specific effects of cerebellar iTBS. Moreover, due to the prolonged scanning duration of MEGA-PRESS, susceptibility of the cerebellar scan to minor head movements or swallowing motions, and the transient nature of TMS effects, only the MEGA-PRESS data of the left cerebellar hemisphere were collected, potentially introducing selection bias. Addressing this issue requires advancements in scanning techniques and future collection of right cerebellar data to mitigate potential selection bias. Additionally, clinical symptom severity assessment was not repeated after TMS. We hypothesized that a single TMS treatment would have minimal impact on assessed performance, and short-term repeat assessments could be influenced by the initial evaluation. However, this limitation also restricts the analysis of the association between clinical symptoms and imaging findings to some extent. Hence, future studies should employ more comprehensive study designs. Finally, a limitation of this study is the lack of neurophysiological identification of the optimal stimulation site. Future studies could adopt the cerebellar-brain inhibition methodology using two TMS coils, which may allow for more precise targeting of the stimulation site and complement the findings.
Conclusions
First, mediation analysis reveals that cerebellar GABA mediates CTC hyperconnectivity in schizophrenia, highlighting its role in the underlying pathological mechanisms. Second, our study demonstrates that cerebellar iTBS can increase Glx levels in schizophrenia patients, leading to the normalization of the Glx/GABA ratio, which may be one of the mechanisms of TMS in the treatment of schizophrenia. In summary, the integration of MRS and TMS provides a robust methodology for investigating brain function, neurochemical alterations, and the therapeutic outcomes of TMS in schizophrenia, thereby serving as a valuable tool for deciphering underlying mechanisms and refining treatment approaches.


Responses