The impact of energy poverty on subjective well-being: evidence from China
Introduction
Happiness is increasingly recognized as a key pursuit “beyond GDP”. Most studies measure happiness through subjective well-being (SWB) (Deb and Okulicz-Kozaryn 2023; Toshkov 2022). SWB reflects individuals’ perceptions and evaluations of their own lives, offering insights into the non-material aspects of happiness (Zhan et al. 2022). The World Happiness Report, published by the United Nations, also highlights the importance of SWB (Helliwell et al. 2020). Existing research explores the factors influencing SWB primarily from two aspects: (1) Individual or household characteristics, like age (Toshkov 2022), gender (Navarro and Salverda 2019), marriage (Tao et al. 2021), health status (Clark and Etilé 2011), education (Jin et al. 2020), income (Toshkov 2022), occupation (Navarro and Salverda 2019), etc. (2) External environment, containing natural environment (e.g., natural disasters (Wang and Wang 2022), air pollution (Zhang et al. 2022)), and social environment (e.g., public service provision (Bokhari and Sharifi 2022), urbanization (Deb and Okulicz-Kozaryn 2023)). These studies provide valuable insights for improving SWB worldwide.
Poverty is a global challenge that hinders development across most countries. It represents a multidimensional deprivation of human capabilities beyond inadequate income (Sen 1995). The United Nations Development Programme categorizes deprivation into three dimensions: health, education, and living conditions (e.g., housing, energy, drinking water). Current scholars explore the influence of various dimensions of poverty on SWB, such as education-related deprivations (Jin et al. 2020), and health-related deprivations (Clark and Etilé 2011; Yiengprugsawan et al. 2012). Among these dimensions, energy-related deprivation, commonly referred to as “energy poverty” (EPOV), has become an increasing concern (Li et al. 2022; Llorca et al. 2020). Energy is a fundamental resource for human life and societal development, essential for heating, cooling, lighting, and cooking. EPOV not only reduces quality of life but also poses serious health risks (Awaworyi Churchill and Smyth 2021; Omar and Hasanujzaman 2021; Li et al. 2022), such as illnesses caused by extreme cold in winter or heat in summer. Some countries formally recognize EPOV as a distinct issue, separate from general poverty (Bednar and Reames 2020). According to the International Energy Agency, nearly 1 billion people experienced EPOV in 2019 (IEA 2019). Furthermore, more than 100 million people worldwide with access to electricity faced the risk of falling back into EPOV in 2020 due to energy affordability issues (Cozzi et al. 2020). Investigating the relationship between EPOV and SWB offers critical insights into social inequality, informing policymakers on targeted strategies to enhance societal well-being. However, most existing research on the impact of EPOV on SWB is concentrated in developed countries, such as Australia (Awaworyi Churchill et al. 2020), Germany (Biermann 2016), Spain (Rodriguez-Alvarez et al. 2019), with relatively less attention given to developing countries.
As the largest developing country by economic scale, China is experiencing rapid economic growth. According to data from the World Bank, China’s GDP per capita is US$7020.3 in 2013 (65.4% of the world average) and US$10,408.7 in 2020 (95.7% of the world average) (World Bank 2022). Despite this growth, the happiness level of Chinese population has not shown significant improvement. The World Happiness Report published by the United Nations ranks China 93rd in 2013 and 94th in 2020 (Helliwell et al. 2013, 2020). Concurrently, China is facing the severe challenge of EPOV. According to various measures by different scholars, the proportion of China’s population in EPOV ranges from 18.91% to 57.78% (Lin and Wang 2020; Nie et al. 2021; Zhang et al. 2019). The combination of rapid economic growth, stagnant happiness levels, and the challenge of EPOV positions China as a reasonable case for examining the impact of EPOV on SWB.
This paper investigates the impact of EPOV on SWB using data from a representative national household survey in China. To our knowledge, only two recent studies have examined the significant impacts of EPOV on SWB in China (Nie et al. 2021; Zhang et al. 2021a). In comparison, our research has the following contributions. First, our research divides SWB into two dimensions: present-based and future-based, extending previous studies and deepening understanding of the EPOV-SWB relationship. While existing studies confirm that EPOV has long-term impacts on residents, they typically measure SWB using only the present-based dimension. In contrast, our research extends this by incorporating both present-based and future-based dimensions of SWB, providing a more comprehensive understanding of the long-term effects of EPOV. Second, the current studies primarily focus on physical health (PH) as the mechanism through which EPOV affects SWB, our research expands this by incorporating mental health (MH) and cognitive health (CH), thus offering a more comprehensive assessment of overall health status. Third, we expand the age range of the study population. Zhang et al. (2021a) focus on children aged 10–15, and our study examines adults over 18 years old. Given that the impacts and mechanisms may differ across age groups, our research covers a broader age span, enriching the exploration of the EPOV-SWB relationship. Additionally, recognizing that perceptions of EPOV may vary across subgroups based on age and education level, we conduct heterogeneity analyses to explore these differences and provide empirical insights into the differentiated impacts of EPOV on SWB.
Literature review
Definition and measurement of EPOV
There are some differences in the specific definitions of EPOV in previous studies. Some studies use alternative terms such as fuel poverty, electricity expenditure burden, energy vulnerability, etc. (Awaworyi Churchill et al. 2020; Pereira and Marques 2023; Rodriguez-Alvarez et al. 2019; Zhu and Lin 2022). Most scholars agree that EPOV refers to a condition in which households are unable to meet their energy needs (Awaworyi Churchill and Smyth 2021; Phoumin and Kimura 2019), and are compelled to pay unaffordable costs for energy (Bednar and Reames 2020).
Current studies mainly measure EPOV from two aspects: energy availability and energy affordability. Regarding energy availability, scholars typically focus on the deprivation of energy services, such as access to modern energy and ownership of household appliances (Lin and Okyere 2023; Phoumin and Kimura 2019). From the perspective of energy affordability, EPOV may result from high energy prices, low household income, or irrational household energy management (Bednar and Reames 2020; Pereira and Marques 2023). Most scholars use the share of household income spent on energy as a key measure. We summarize the relevant literature on EPOV measures in Table 1.
Due to different development levels of countries, the performance of EPOV varies. Some countries have achieved universal access to modern energy, shifting the focus to energy affordability (Li et al. 2022), while others still face challenges related to energy availability due to constraints in housing, energy supply, and infrastructure (Lin and Okyere 2023). According to the World Bank, China achieves 100% electricity access in 2013 (IEA, IRENA, The World Bank & World Health Organization 2020), addressing the issue of energy accessibility. Therefore, compared with energy availability, energy affordability is more suitable to measure China’s EPOV status.
Impacts of EPOV on SWB
Current research on the impact of EPOV on SWB primarily focuses on developed countries. For example, using Australian data, Awaworyi Churchill et al. (2020) find that EPOV reduces SWB. Mayer and Smith (2019) conduct a study of 22 European countries, and find that concerns about energy security reduce SWB. According to German data from 1994 to 2013, Biermann (2016) confirms the negative effect of EPOV on SWB. Rodriguez-Alvarez et al. (2019) also reach this conclusion using data from a Spanish survey. A few studies explore the relationship between EPOV and SWB in developing countries. Phoumin and Kimura (2019)’s in-depth analysis of survey data from Cambodia reveals the enormous impact of EPOV on household well-being. Zhang et al. (2021a) focus on Chinese children aged 10–15 years and find that EPOV negatively affects children’s degree of happiness. These studies provide empirical support for the negative impact of EPOV on SWB.
The measurement of SWB in these studies mainly relies on self-assessments of present condition, which can be divided into two categories: (1) Subjective self-evaluation, e.g., self-reported life satisfaction (Awaworyi Churchill et al. 2020; Biermann 2016), self-reported level of pleasure (Zhan et al. 2022), house satisfaction (Rodriguez-Alvarez et al. 2019). (2) Objective indicators, e.g., depression level (Nie et al. 2021), health status (Mayer and Smith 2019), education, and income opportunities (Phoumin and Kimura 2019). However, few studies explore the impact of EPOV on SWB in different time dimensions. SWB encompasses a person’s current pleasure and attitude towards the pursuit of future life, reflecting his or her own sustainable pleasures (Huta and Ryan 2010). The current pleasure captures the happiness and satisfaction that individuals derive from their daily lives, typically measured through indicators such as life satisfaction and positive emotions (Tao et al. 2021; Zhang et al. 2022), providing insights into how individuals perceive their current situations. The future-oriented attitude includes individuals’ expectations, desires, and confidence regarding future life outcomes. This forward-looking perspective is crucial as it influences individuals’ motivations and behavioral choices (Khumalo et al. 2020), thereby affecting how they pursue goals and cope with challenges. Given that EPOV has long-term negative effects (Li et al. 2022), it is necessary to explore EPOV-SWB relation from different time dimensions, including the present and the future.
Furthermore, studying the impact of EPOV on SWB across different demographic groups is critical. For instance, age-related differences shape individuals’ perceptions and reactions to EPOV (Li et al. 2022), while disparities in educational attainment contribute to variations in SWB (Jin et al. 2020). Examining these distinctions provides a more comprehensive understanding of the EPOV-SWB relationship and offers valuable insights for designing more effective policies.
The mediating role of health
Numerous studies examine the effects of EPOV on health, including PH (Awaworyi Churchill and Smyth 2021; Omar and Hasanujzaman 2021; Oum 2019; Zhang et al. 2019), MH (Liu et al. 2022; Zhang et al. 2021b) and CH (Jana et al. 2022; Li et al. 2022). On the one hand, EPOV forces households to reduce expenditures on food, leading to lower nutrient intake and increased susceptibility to diseases (Nie et al. 2021). On the other hand, some households in EPOV rely on low-quality energy sources such as coal, wood, and other traditional solid fuels to meet their daily needs (Liu et al. 2022). The combustion of these fuels releases harmful substances, contributing to various health risks, such as respiratory diseases (Kurata et al. 2020). Furthermore, prolonged exposure to air pollution has been linked to mental health issues such as anxiety, depression (Liu et al. 2022), and cognitive decline (Jana et al. 2022).
Meanwhile, the relationship between health and SWB is widely discussed, with numerous articles confirming the positive association between them (Clark and Etilé 2011; Nie et al. 2021; Yiengprugsawan et al. 2012). For example, there is a negative association between body mass index (BMI) and SWB once BMI exceeds a certain threshold (i.e., overweight) (Clark and Etilé 2011). Using data from Thailand, Yiengprugsawan et al. (2012) identify a strong correlation between mental state and happiness. Additionally, existing studies have explored health as the mechanism through which EPOV affects SWB. For example, Nie et al. (2021) examine PH as a potential channel explaining the impact of EPOV on SWB. However, given that EPOV influences multiple dimensions of health, a more comprehensive approach is needed. This study integrates PH, MH, and CH within a unified framework to depict overall health status, and further investigate the mechanisms through which EPOV impacts SWB, as illustrated in Fig. 1.
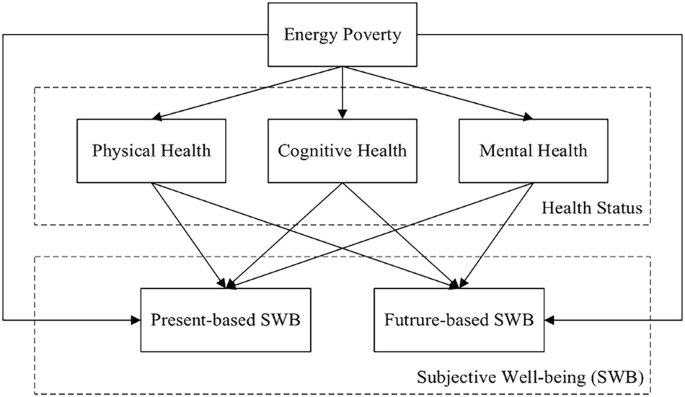
The mechanism of the impact of EPOV on SWB.
Methodology
Data
The data in this study come from four waves of China Family Panel Studies (CFPS) in 2014, 2016, 2018, and 2020 (Institute of Social Science Survey ISSS 2023). This nationally representative survey collects data at the individual, household, and community levels, covering 16,000 households across 25 provinces. CFPS data have been widely used in previous studies on various topics related to China, including EPOV (Li et al. 2022; Zhu and Lin 2022) and SWB (Nie et al. 2021; Tao et al. 2021), supporting the reliability and validity of the dataset.
In this study, EPOV indicators are derived from the household-level dataset, while other variables are obtained from the individual-level dataset. We merge the household-level and individual-level data based on household codes, and remove samples with missing values. Consequently, each individual’s EPOV value is assigned based on household-level data, meaning individuals within the same household share the same EPOV measure. The final sample consists of an unbalanced panel of 39,294 individuals from 13,491 households. We conduct the analysis at the individual level, with 10,486 individuals observed across all four waves, 11,226 appearing in three waves, 9,111 in two waves, and 8,471 in a single wave. This results in a total of 102,315 individual observations for the following empirical analysis.
Variables
Measurements of subjective well-being
Existing research on SWB largely focuses on a single construct, such as life satisfaction (LS) (Awaworyi Churchill et al. 2020; Clark and Etilé 2011; Zhan et al. 2022), ignoring other dimensions of SWB. Conceptually, SWB encompasses both individuals’ present pleasure and their expectations for the future (Huta and Ryan 2010). However, most studies using CFPS data measure SWB solely through respondents’ self-reported life satisfaction (Tao et al. 2021; Zhang et al. 2022), with limited attention given to future-based dimension. Future-based well-being plays a crucial role in explaining the underlying causes and motivations of human behavior (Khumalo et al. 2020), yet few studies incorporate this dimension.
Therefore, our study attempts to portray SWB from different time dimensions, including the present and future. Specifically, for the present-based dimension, we select LS in line with the current literature. And for the measurement of the future-based dimension, we choose confidence in future (CF). CF reflects an individual’s perception of their future potential and ability to succeed, grounded in their current situation but oriented toward future expectations and aspirations (Pan et al. 2022). The corresponding questions in the survey are “to what extent are you satisfied with your life” and “to what extent are you confident about your future”. Responses are based on a 5-point scale, ranging from 1 (low) to 5 (high).
Measurements of energy poverty
Consistent with previous studies on EPOV, we measure EPOV based on two indicators: household income and energy expenditure (Awaworyi Churchill and Smyth 2021; Fry et al. 2022; Lin and Wang 2020; Phoumin and Kimura 2019). However, the current research has not reached a consensus regarding the optimal method for measuring EPOV. From the perspective of energy affordability, we adopt six different methods to measure the status of EPOV. The specific measures are as follows:
The first approach to measuring EPOV (EPOV1) follows the widely used measure proposed by Boardman (1991), defining EPOV as the situation where the percentage of energy consumption to income is greater than 10%.
However, Boardman (1991)’s 10% measure has been criticized for potentially leading to biased judgments of EPOV, especially given the variations in energy consumption across different income groups (Phoumin and Kimura 2019). Consequently, several scholars have modified the 10% measure to account for specific income groups. For instance, Kahouli (2020) limits the 10% measure to those in the bottom 30% of the income distribution, and Li et al. (2022) apply it to the bottom 50%. Considering that EPOV in middle-income groups should not be underestimated (Phoumin and Kimura 2019), our second measure of EPOV (EPOV2) applies the 10% measure against the lowest 50% of the income distribution.
In addition, some studies use double the median ratio of energy consumption to income to identify EPOV (Moore 2012; Nie et al. 2021). Drawing on this approach and taking possible regional differences into account, our third (EPOV3) and fourth (EPOV4) measures are based on the full sample’s double median and the province’s double median, respectively.
Our fifth measure (EPOV5) refers to the “low-income high-cost” of Hills (2011). This idea avoids misclassifying high-income and high-energy-consuming groups as EPOV (Li et al. 2014). Thus, the identification of EPOV5 needs to meet two conditions: (1) group with income in the bottom 25%, and (2) group with energy consumption above the median.
The above five measures synthesize to generate the sixth measurement of EPOV (EPOV6), as follows:
where ({alpha }_{1}) to ({alpha }_{5}) denote the weights corresponding to EPOV1 to EPOV5, respectively.
Referring to the approach of Awaworyi Churchill et al. (2020) and Nie et al. (2021), we adopt an equal weighting approach, i.e., ({alpha }_{1}={alpha }_{2}={alpha }_{3}={alpha }_{4}={alpha }_{5}=0.2). The value range of EPOV6 is between 0 and 1. We use EPOV6 for the primary analysis and EPOV1-EPOV5 for robustness tests.
Control variables
Consistent with previous research, we include a set of factors that possibly influence EPOV-SWB association as control variables (see, e.g., Awaworyi Churchill et al. 2020; Nie et al. 2021; Phoumin and Kimura 2019). To control the influence of other factors, combined with the questionnaire design, we select age, gender, education level, employment status, weekly exercise frequency, social status, marital status, and registered residence. The descriptive statistics and variable descriptions of each variable are detailed in Table 2.
Health
Based on the discussion in literature review, we investigate whether health serves as a potential channel in the relationship between EPOV and SWB. Referring to related studies (Li et al. 2022; Zhang et al. 2021b), we discuss three aspects of health: PH, MH, and CH, and assign corresponding values from low to high according to their responses, as follows:
The measure of PH is derived from self-reported health. Numerous studies use self-reported health as a proxy for PH (Kahouli 2020; Nie et al. 2021; Zhang et al. 2021b). Respondents answer the question “How do you consider your health status” on a 5-point scale ranging from 1 (very unhealthy) to 5 (very healthy).
In terms of MH, consistent with the relevant literature, this indicator is generated by a series of questions (Liu et al. 2022; Zhang et al. 2021b). According to the Center for Epidemiologic Studies Depression Scale test, the index of MH in this study is based on the “frequency of feelings in a week”, including six aspects: depression, difficulty doing things, insomnia, loneliness, sadness, and inability to continue living. Corresponding answers are evaluated using a 4-point scale ranging from 1 (5–7 days) to 4 (less than 1 day).
As an important component of cognitive ability, many current studies adopt memory as a proxy for CH (Li et al. 2022; Liu et al. 2022). The measurement of CH relies on the extent to which respondents recall significant events that occurred to them during a week. Responses are evaluated using a scale of 1 (remember only a little) to 5 (remember everything).
Empirical strategy
Fixed effects (FE) model
Similar to related studies, we adopt a fixed effects model (Li et al. 2022). This model can take into account the unobservable factors of individuals, such as awareness of energy saving, and the ability to pay energy bills on time (Fry et al. 2022). We use a two-way FE model to estimate the impact of EPOV on SWB, as follows:
where ({{SWB}}_{{it}}) represents the SWB scores of individual (i) at time (t); ({{EPOV}}_{{it}}) indicates the EPOV status; ({X}_{{it}}) denotes a set of control variables at the individual level; ({P}_{i}), ({H}_{i}) and ({W}_{t}) indicate household, provincial and wave dummies, respectively; ({delta }_{{it}}) is the error term; ({mu }_{i}) captures the unobservable time-invariant individual effects; (beta) denotes the association between SWB and correlated variables.
Instrumental variable estimation
Factors such as reverse causality, omitted variables, and measurement errors lead to endogeneity issues that bias baseline results. For example, the expectation of income is an unobservable factor that may affect both EPOV and SWB (Nie et al. 2021). In addition, energy expenditures are self-reported by households, who may not accurately recall the exact amounts (Awaworyi Churchill et al. 2020), leading to measurement errors and biased results.
To tackle endogeneity in the model, we adopt the instrumental variable (IV) method. Using the provincial EPOV status as an IV, this study adopts two-stage least square (2SLS) method for endogenous testing. The provincial EPOV status is measured by using the average of observations from the same province and the same wave. Previous studies confirm the validity of this IV (Li et al. 2022; Zhang et al. 2021b). Residents within the same province have similar infrastructure and related policies, as well as similar living environments and habits. The residents’ EPOV is highly correlated with provincial EPOV. Furthermore, individual SWB is generally associated with income, education, health, etc., and is less correlated with provincial EPOV at the macro level.
Results
Descriptive statistics
Table 2 presents descriptive statistics of the variables. The average scores of LS and CF in our sample are 3.836 and 4.029, respectively. Depending on EPOV measurements, the percentage of sample classified as EPOV varies from 20.2% to 23.6%. In terms of health at the individual level, the average scores for PH, MH and CH are 2.939, 3.438 and 3.200 respectively. In addition, the mean age is 47.337, and the ratio of males and females is almost equal (males account for 49.8%). With respect to the highest education level, high school account for the largest proportion, 24.3%, followed by primary school (23.8%), middle school (22.7%), vocational school (12.9%), and university or higher (8.7%). In addition, the proportion of illiteracy is the least, which is 7.6%. Among the sample, 67.7% of respondents have a job, the average frequency of exercise is 3.014 times a week, 80.7% are married, and the proportion of respondents with urban registered residence is 48.3%.
The temporal and spatial distribution of EPOV at the provincial level is shown in Fig. 2. Provincial EPOV values are derived from the average of the sample within each province. From the perspective of time trend, EPOV improves year by year nationwide. Specifically, among the 25 provinces with available data, the number of provinces with EPOV below 20% goes from 2 (accounting for 8%) in 2014, to 9 (accounting for 36%) in 2016, to 12 (accounting for 48%) in 2018, to 14 (accounting for 56%) in 2020. In terms of spatial distribution, the levels of EPOV in the eastern coastal region are generally lower than in other regions, possibly due to the higher economic development in the east (Li et al. 2021). In 2020, only two regions have EPOV below 10%: Zhejiang and Shanghai, both located in the economically developed Yangtze River Delta region.
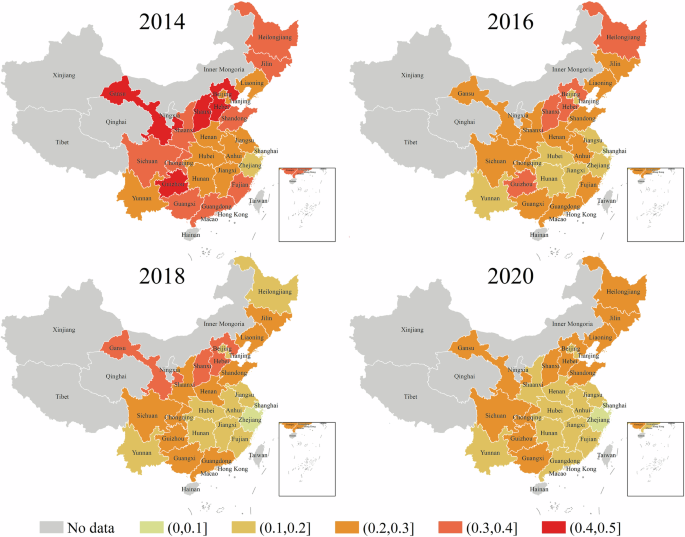
The spatial distribution of EPOV in 2014, 2016, 2018, and 2020.
Table 3 explores the mean scores of LS and CF under different EPOV measures. It is evident that groups without EPOV score higher in both LS and CF than those with EPOV, regardless of the measurement.
Baseline results
We present baseline results in Table 4, estimating the impact of EPOV on LS and CF. As described in columns (1) and (4), we first examine the relationship between EPOV6 and SWB using OLS estimation. The coefficients of EPOV6 are −0.113 and −0.094, respectively, indicating that EPOV has detrimental impacts on both LS and CF. We then add fixed effects for household and year in columns (2) and (5) to control for unobservable factors that change over time at the household level. In columns (3) and (6), we further add the interaction terms of province and year, controlling the impact of unobservable factors that change over time at the provincial level on SWB. A comparison of these results reveals that the FE estimate of the impact of EPOV on SWB is less than the OLS estimate. This could be attributed to the FE approach reducing the endogeneity of EPOV by disregarding unobserved factors. Our findings highlight a significant association between EPOV and lower SWB levels, both in terms of present-based and future-based SWB. Earlier studies primarily examine the influence of EPOV on present-based dimension of SWB (Awaworyi Churchill et al. 2020; Nie et al. 2021; Zhang et al. 2021a), which may underestimate the negative impact of EPOV on the future.
Endogeneity corrected results
In this part of the study, we use the provincial mean of EPOV6 as an IV to avoid the endogeneity of EPOV6, employing the 2SLS method for robustness testing. As shown in Table 5, the Anderson LM statistic is 586.023 and is significantly positively correlated at the 1% level, suggesting that there is no under-identification. The Cragg-Donald Wald F statistic exceeds the 10% critical value, indicating that there is no weak association between IV and EPOV6.
After applying the 2SLS method, the coefficient of EPOV6 on SWB is significantly larger than the baseline results, suggesting that the endogeneity induces a downward bias and underestimates the effect of EPOV on SWB. In previous studies exploring the negative effects of EPOV, there are also situations where the revised estimates exceeded the baseline estimates (Awaworyi Churchill and Smyth 2021; Li et al. 2022). The 2SLS results further confirm the conclusion that SWB is significantly affected by EPOV.
Robustness checks
To ensure the robustness of our findings, we conduct multiple tests. As shown in Table 6, we replace EPOV6 with EPOV1-EPOV5 to verify the stability of our conclusions across different measurements. Panel A and Panel B present the impact of various EPOV measures on LS and CF, respectively. All measures indicate a negative association between EPOV and SWB in both present-based dimension and future-based dimensions, consistent with baseline results.
Mechanisms and further investigations
We further examine whether PH, MH and CH are channels through which EPOV affects SWB across different time dimensions. Referring to previous studies, we use the two-step procedure for channel analysis (Prakash and Munyanyi 2021; Zhang et al. 2021a), see Tables 7 and 8. Health is considered a potential channel if it is simultaneously associated with both EPOV and SWB. Furthermore, when health is included as a new covariate, the significance or coefficient magnitude of EPOV should decrease in regression estimation models of EPOV on SWB.
As a first step, PH, MH, and CH need to be associated with EPOV as potential channels. As seen in Table 7, EPOV has significant negative effects on PH (see column (1)), MH (see column (2)), and CH (see column (3)), indicating that increased EPOV is associated with lower levels of health status. Our findings align with those from Australia (Awaworyi Churchill and Smyth 2021; Prakash and Munyanyi 2021), Bangladesh (Omar and Hasanujzaman 2021), Cambodia (Phoumin and Kimura 2019), China (Zhang et al. 2021b), Lao PDR (Oum 2019) and Spain (Llorca et al. 2020).
According to the results in Table 7, we add PH, MH and CH as additional covariates in the regressions of EPOV6 on LS and EPOV6 on CF, respectively. In Table 8, columns (1)-(4) show the results for LS, and we find that PH, MH and CH are all associated with the improvement of LS. As newly added covariates, PH, MH and CH all reduce the statistical magnitude or significance of the EPOV6 coefficients (see columns (2)-(4)). This suggests that PH, MH and CH are potential channels through which EPOV affects LS. Similarly, the results in columns (5)-(8) report the effect on CF, demonstrating that PH, MH and CH are also potential channels for the EPOV-CF association. In general, the findings indicate that health status serves a channel through which EPOV impacts SWB across different time dimensions.
We further examine the impacts of EPOV on different subgroups. Numerous studies confirm that the impacts of EPOV differ by age (Prakash and Munyanyi 2021; Zhu and Lin 2022). Following Li et al. (2022), we classify individuals below 45 as the “young-aged,” and those above 45 years old as the “middle-aged and older adults.” The results from Table 9 indicate that EPOV has significant negative impacts on both LS and CF for the young-aged (see columns (1) and (4)) as well as for middle-aged and older adults (see columns (2) and (5)). In columns (3) and (6), we include the interaction term between the young-aged (young-aged=1) and EPOV. This interaction term is significantly positive in both columns, suggesting that the negative impacts of EPOV are more pronounced among middle-aged and older adults.
The possible explanation is that middle-aged and older adults are more likely to face health-related challenges, and depend more on essential energy services such as heating and cooling. EPOV restricts their ability to afford these services, resulting in more pronounced negative impacts on their SWB. According to the data used in this study, the average scores for PH, MH and CH among the young-aged are 3.341, 3.481, and 3.541, respectively, while the corresponding scores for middle-aged and older adults, are 2.639, 3.406, and 2.947. This indicates a significant disadvantage in health among middle-aged and older adults, making them more vulnerable to the effects of EPOV. Furthermore, as most middle-aged and older adults are in the later stages of their careers or retired, they have fewer opportunities to increase their income or alter their lifestyle, leading to a stronger sense of powerlessness in coping with EPOV. This psychological pressure exacerbates their negative response to EPOV, resulting in a greater decrease in LS and CF compared to the young-aged.
In addition, some scholars suggest that noticeable disparities in SWB result from variations in educational attainment (Jin et al. 2020). In Table 10, we divide the samples into two groups: low-capital group and high-capital group. Those whose highest degree is at or below middle school as low-capital group, and vice versa as high-capital. The findings suggest that in terms of LS, EPOV has a significant negative impact on both the low-capital group (see column (1)) and the high-capital group (see column (2)). In the regression shown in column (3), we include the interaction term between low-capital (low-capital=1) and EPOV. The coefficient for this interaction term is not significant, indicating that the negative effects of EPOV on LS do not differ significantly between groups with different educational attainments. However, in terms of CF, EPOV has a significantly negative impact on the low-capital group (see column (4)), while its effect on the high-capital group is not significant (see column (5)). The regression result in column (6) shows that the coefficient for the interaction term is significantly negative, indicating that EPOV has a more pronounced negative impact on the low-capital group.
One possible explanation is that present-based SWB is closely related to current living conditions. As a fundamental resource in modern life, energy is crucial to individuals’ basic living needs. Therefore, regardless of educational attainment, EPOV negatively impacts individuals’ LS. However, in terms of CF, EPOV has a greater negative effect on the low-capital group. This may be because individuals in the low-capital group often lack essential resources and coping abilities, resulting in heightened feelings of helplessness and anxiety when confronted with challenges related to energy affordability. In contrast, individuals in the high-capital typically have higher income levels (Zhu and Lin 2022), thereby enhancing their ability to cope with the potential challenges posed by EPOV. They can manage energy use more effectively, for example, by purchasing energy-efficient products that reduce their subsequent energy use needs.
Conclusions and policy implications
Happiness has become a key pursuit of governments around the world, and SWB is a representative indicator of happiness. As an important dimension of poverty, EPOV is regarded as having a significant effect on SWB. Although many current studies explore the relationship between EPOV and SWB, there are few empirical studies on deconstructing SWB from a time perspective. Using data from 2014–2020 CFPS, we measure SWB in both present-based and future-based dimensions to explore the EPOV-SWB relationship in China.
This study presents the following main findings: Firstly, the status of China’s EPOV ranges from 20.2% to 23.6% according to different measures, indicating that a significant portion of the Chinese population is currently struggling with insufficient energy affordability. Secondly, the negative impact of EPOV on SWB is significant in both the present-based and future-based dimensions, and this result remains robust across various tests. Third, PH, MH, and CH are important channels through which EPOV affects SWB. Finally, the impact of EPOV on SWB varies across different demographic groups. In terms of the present-based dimension of SWB, EPOV has a greater negative impact on middle-aged and older adults. And in the future-based dimension, low-capital residents, middle-aged and older adults are more adversely affected by EPOV.
The conclusion has important implications for policy and echoes previous research. Despite substantial progress in alleviating extreme income poverty in China, the EPOV problem driven by insufficient energy affordability remains a pressing issue. As the status of EPOV varies by region, policies should be tailored to local realities. For instance, in western China, where EPOV is more prevalent, policymakers can leverage the region’s unique geographical features to develop renewable energy resources like wind and solar power. These initiatives could effectively reduce energy costs and mitigate the energy affordability challenges faced by residents in these areas. Addressing the long-term challenges of EPOV requires targeted efforts to improve energy efficiency. Policymakers can provide subsidies for energy-efficient appliances, and introduce educational programs that help low-educated individuals enhance energy management skills. Community-based initiatives, such as public lectures, can further promote energy-saving practices, equipping households with the knowledge to optimize consumption and manage energy costs more effectively.
In addition, supporting individuals whose health is deteriorating due to EPOV is essential. Health status encompasses PH, MH and CH. Policymakers can implement measures, such as providing free or subsidized healthcare services to households affected by EPOV, establishing MH support programs, and conducting community outreach initiatives to monitor and improve CH outcomes. At the same time, local administrators can provide more targeted support, such as regular visits to assess health status, LS, CF, and related needs of households affected by EPOV. Addressing health disparities associated with EPOV not only enhances individual SWB, but also contributes to broader societal well-being. Long-term strategies should prioritize the exploration of CF as a critical component of SWB, emphasizing both current life satisfaction and the sustainable development of the region. Targeted efforts are particularly crucial for assisting low-educated individuals, as well as middle-aged and older adults, in improving EPOV. These initiatives may include enhancing access to affordable energy services, promoting energy efficiency programs, and raising awareness of energy-saving practices. Such measures empower vulnerable groups to mitigate the adverse effects of EPOV, ultimately enhancing societal welfare.
This study has several limitations. First, due to data constraints, we adopt a single indicator to measure both the present and future dimensions of SWB, which may not fully capture individuals’ well-being experiences. Future research can expand the selection of indicators and construct a comprehensive indicator system to measure SWB across different time dimensions. Furthermore, our analysis of the mechanisms through which EPOV affects SWB is limited to the health perspective. Future studies can explore additional mechanisms by considering the multidimensional influences of individual behavior choices, social support, and other factors to achieve a more comprehensive understanding.
The findings of this study highlight the necessity to prioritize addressing the negative impact of EPOV on SWB in different time dimensions. We hope this study can shed some light on future researchers investigating EPOV and SWB. Future research can further deconstruct the time dimension of SWB and explore more mechanisms of EPOV’s influence on SWB.
Responses