The impact of various calcium ion sources on the curing efficacy of MICP

Introduction
In recent years, an increasing emphasis has been placed on environmentally friendly materials for sustainable development in response to the process of modern industrialization and the continuous advancement of urbanization. This is driven by the necessity to alleviate the impact of ecological environment destruction. Microbially induced calcium carbonate precipitation (MICP) technology has emerged as a promising solution due to its green and environmental protection advantages1. The research focuses mainly on improving the engineering properties of soil through MICP2, such as soil reinforcement3. MICP not only reduces energy consumption and production costs but also mitigates the greenhouse effect. First proposed by Whiffin4, MICP is a novel land consolidation technology that involves the microbiologically induced deposition of carbonate between sand particles and on the surface, as depicted in Fig. 1. The reaction formula for this process is as follows:

Schematic diagram of MICP reaction process.
The induced cement possesses a dense structure and connects sand particles through chemical bonding, resulting in outstanding weather resistance and environmental safety5,6,7,8. MICP is also an environmentally friendly way to curb wind erosion9, another notable advantage of MICP technology is its low environmental impact. Currently, Bacillus pasteuri or Sarcina pasteuri are commonly selected by scholars for strain selection in the study of MICP technology, and a mixture of CaCl2 and urea is the preferred nutrient solution. In a comparative test, Zhang et al. found that the compressive strength of sand solidified with calcium acetate as the calcium source component in the mixed solution was 40% higher than that of sand solidified with calcium chloride10. This evidently indicates that calcium chloride may not be the most optimal choice as a calcium source in MICP technology. The factors influencing microbial solidification are complex, encompassing temperature, pH, concentration of cementing fluid, bacterial concentration, and calcium source; all these factors have a significant influence on the solidification process and are crucial determinants for successful soil solidification. Therefore, scholars have carried out extensive research on these influencing factors. Peng et al.11 undertook a study on the impact of low-temperature environments on the characteristics of calcium carbonate formation during microbial solidification. Sun et al.12 probed into low-temperature bacterial domestication technology and witnessed substantial augmentations in bacterial growth rate and precipitation efficiency subsequent to low-temperature domestication. Li et al.13,14, Li et al.15, Ou et al.16,17, and others executed MICP tests on coral sand from multiple perspectives: diverse urease activity in bacterial solution, particle size, calcium chloride concentration and urea, particle size, and solution salinity. The influences of these five aspects on the microbial curing effect of coral sand were inspected.
Liu et al.18 carried out relevant research on substituting calcium chloride with soluble calcium as the requisite calcium source in the MICP process. Wang et al.19 discovered that a concentration of 0.5 mol/L for calcium salt resulted in the optimum effect for biosolidified sand columns; this sample also manifested the greatest enhancement in strength with a content of 6.03% for calcium carbonate, cohesion at 46.9 kPa, and an internal friction angle at 41.31°. Gorospe et al.20 compared the effects of different calcium sources (calcium chloride, calcium acetate, calcium lactate, and calcium gluconate) on the MICP reaction and discerned complex interactions between urease enzyme activity and the chosen calcium source; they ascertained that for the purpose of sand consolidation, calcium chloride had the most favorable effect, succeeded by calcium acetate and then by calcium lactate. However, Achal et al.21 also compared and analyzed the influence of different calcium sources (calcium chloride, calcium oxide, calcium acetate, and calcium nitrate) on the MICP reaction, and determined that calcium chloride was the superior calcium source to induce calcium carbonate precipitation, followed by calcium nitrate, calcium acetate, and calcium oxide. Zhang et al.22 conducted a comparison among calcium chloride, calcium nitrate, and calcium acetate and discovered that when calcium acetate was employed as the calcium source, the compressive strength and tensile strength of the solidified sand column were higher than those of calcium nitrate and calcium chloride. Li and Qu23 treated the surface of concrete with calcium chloride and calcium acetate and found that the type of calcium source exerted a certain influence on the presence of calcium carbonate crystals; however, there was no significant disparity in the durability protection of concrete. Liu et al.24 utilized calcium-rich calcareous sand to obtain soluble calcium and employed it as the calcium source for the MICP reaction to enhance soil properties. Choi et al.25,26 endeavored to extract soluble calcium from eggshells and limestone for bio-consolidation and achieved favorable consolidation effects.
Wang27 investigated the effect of calcium chloride, calcium acetate, and magnesium acetate on the adhesion of sand particles and found that the adhesion effect of calcium acetate was the most superior; Cheng et al.28 employed calcium acetate, calcium chloride, and limestone as three calcium sources to solidify sand particles respectively. The results indicated that the adhesion effect of calcium acetate as the calcium source was marginally higher than that of limestone, and both were superior to the adhesion effect of calcium chloride. Nevertheless, Abo-El-Enein et al.29 ascertained that when it came to filling cracks for repair, the repair effect of calcium chloride were both superior to that of calcium acetate and calcium nitrate. Zhu30 employed diverse calcium sources for the consolidation of sand, loess, and clayey soil. The results indicated that the binding effects of calcium chloride and calcium acetate were conspicuously superior to those of calcium nitrate and lactic acid calcium. The content of calcium carbonate generated through mineralization with calcium chloride and the uniaxial compressive strength of the MICP-bonded soil material prepared were both superior to those achieved with calcium acetate. Fu et al.31 mixed and solidified the sand material using calcium chloride and calcium acetate as calcium sources and discovered that the binding effect of calcium chloride was more favorable. The conclusions arrived at by researchers regarding the binding effects of calcium chloride and calcium acetate vary, which might be ascribed to the experimental conditions and the quality of reagents. However, the overall conclusion is that the binding effects of calcium chloride and calcium acetate are relatively satisfactory.
Calcium ions can enhance microbial activity in the soil and accelerate the production of extracellular polymers by bacteria for solidifying soil particles. Calcium sulfate and calcium chloride might inhibit the activity of microorganisms to a certain degree, thereby influencing the curing effect. Hence, when conducting microbial solidification of sand, it is indispensable to take into account the influence of different calcium ion sources on microbial activity and curing effect, so as to select appropriate additives to achieve the optimal outcome. Regarding the research on calcium sources in microbial solidified stimulation solution, diverse conclusions have been derived from different stimulation solutions in various soils. Therefore, further exploration of calcium sources in the stimulation solution is requisite to obtain rational research results. This is just the innovation of this study, in which four calcium sources, namely calcium chloride, calcium gluconate, calcium acetate, and calcium ligninsulfonate, were selected and combined with the stimulation solution32 to form a complex stimulation solution to investigate the influence of calcium sources on microbial solidified sandy soil.
Experimental materials
Sand
The soil utilized for the study was sand collected from a depth of 10 cm at the natural test site, (77° 22′ 49′′ E, 39° 1′ 11′′ N) near the Taklimakan Desert (Fig. 2). The grading curve of the test sand is depicted in Fig. 3, while its physical and mechanical properties are detailed in Table 1.
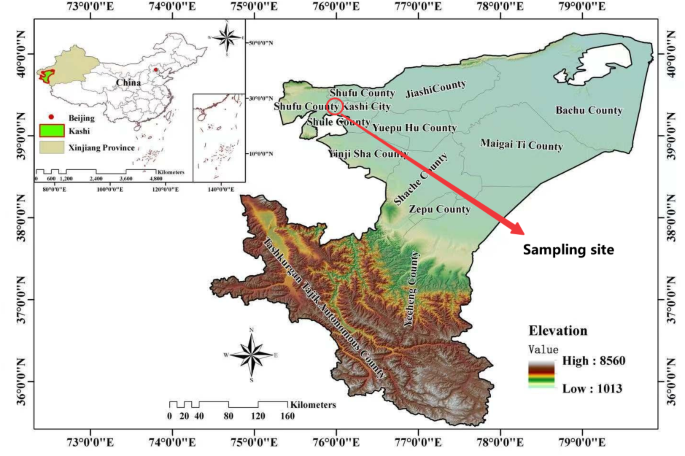
The test sand extraction site. The map was generated by ArcGIS10.7. https://pan.xunlei.com/s/VNyxo_kKlrC3AHr-s3wg2XVgA1?pwd=zu37 or https://pan.baidu.com/s/1lFJ4dmp5AbeRJiztYBoIbw?pwd=6789.
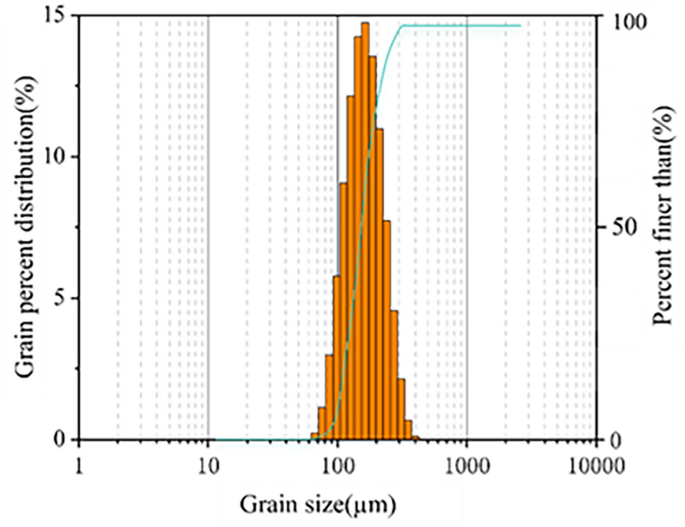
Grain-size distribution of the desert soil.
Complex stimulation solution
The ratio of stimulation solution used in the test is as follows: yeast extract 0.1 g/L, ammonia chloride 12.5 mM, sodium acetate 42.5 mM, urea 350 mM, pH 8.432; the added calcium sources were calcium chloride, calcium acetate, calcium gluconate and calcium lignosulfonic, and the calcium concentration of the four calcium sources was 0.50 mol·L−119,33, the amount of spray volume is 30 ml for each sample that has the fixed surface area34.
The stimulation solution and calcium source are prepared separately in two containers and applied to the surface using a dedicated sprayer. For the MICP test, the two liquids are thoroughly mixed and shaken well for 1 min in a dedicated sprayer before being promptly sprayed onto the surface within 5 min. The mixing ratio between stimulation solution and calcium solution is 1:1 (mol). The nozzle of the sprayer is 30 cm high from the specimen surface.
Physical and chemical properties of four calcium sources
The names, appearance, and physicochemical properties of the four calcium sources are presented in Table 2.
Experimental methods
Surface strength test
The micro-penetration instrument employed in the bearing capacity test is procured from Changzhou 80 Future Intelligent Technology Co., LTD. This series of micro-penetration instruments constitute a convenient and practical tool for geotechnical engineers and engineering investigation technicians during on-site foundation soil description and construction tank inspection. The miniature penetration instrument complies with the “Test Procedure for Pocket Penetration Instrument” formulated by the China Engineering Construction Standardization Association, featuring models such as WXGR-2.0, WXGR-4.0, and WXGR-5.0 (as depicted in Fig. 4), among which 4.0 has the broadest range and 5.0 has the narrowest range.
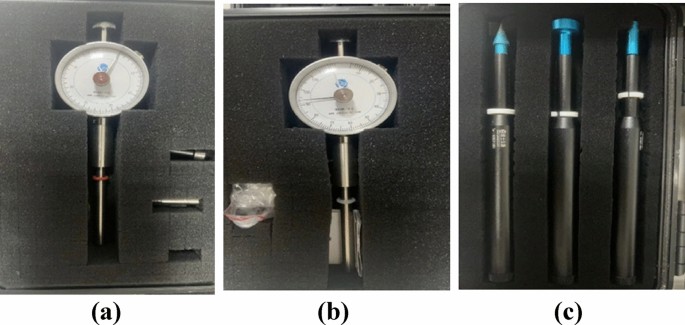
Micropenetration instruments used (a) WXGR-5.0; (b) WXGR-4.0; (c) WXGR-2.0.
When conducting measurements: (1) Utilize a paring knife to smooth the surface of the soil sample without repetitive application. (2) Choose an appropriate probe based on the softness or hardness of the soil, affix it onto the measuring rod, lock the knurled nut, and set the slider to the zero position. (3) Insert the probe into the soil at a uniform speed until the line on the probe makes contact with the soil surface; each penetration test should be conducted in parallel no fewer than three times, and any readings with significant deviation should be discarded before calculating the average value as the test result. (4) Avoid areas within the samples containing hardness or wormhole cracks during penetration; maintain a distance between the penetration points and the sample edges that is not less than three times the diameter of the probe while ensuring that the sample thickness remains not less than three times the diameter of the probe. (5) Record the penetration resistance Pt value (unit: 100 kPa): a. When using Probe A (standard), refer to the position indicated on the side boundary of the slider near point 0 for the penetration resistance Pta value; b. When using Probe B, divide the reading value at the slider position by 5 to obtain the penetration resistance Ptb = Pta/5; c. When using the C-side head (tapered), multiply the reading value at the slider position by 1.33 to derive the penetration resistance Ptc = 1.33 * Pta. Based on the final Pt values obtained from the above steps, consult the respective comparison table (refer to the attached table), enabling the determination of the allowable bearing capacity Rpt for the tested soil.
Crust thickness and calcium carbonate content
Measurement method of crust thickness
After conducting the test, measurements of the crust thickness were taken at the four corners and middle parts of the sample, and the average value was determined as the final result. A caliper was employed for measuring the crust thickness.
Procedures for the determination of calcium carbonate content
Use a balance to weigh a 0.15 g sample with an accuracy of 0.0001 g, place it in a 250 mL conical flask, moisten it with 2 mL of water, drip 20% hydrochloric acid solution until the sample is completely dissolved, add 50 mL of water and 5 ml of 30% triethanolamine solution. When the standard titration solution of EDTA [c (EDTA) is approximately 0.05 mol/L] is employed for titration (the concentration is calibrated by the examination station), when the standard titration solution is consumed to 25 mL, add 5 mL of 100 g/L sodium hydroxide solution and 10 mg of calcium indicator, and continue the titration with the EDTA standard titration solution until the solution changes from red to pure blue. Parallel determination and blank test should be conducted. The burette volume correction and solution temperature volume correction should also be carried out.
Software used
Python 3.9.1 and Matlab R2019a tools were utilized for analyzing the sand cracking mode. The ensuing workflow was implemented: (1) image cropping, (2) gray pixel transformation, black-gray pixel modification, (3) discrimination of crack edge against the black-gray background, (4) crack filling (black) and pixel counting. The proportion of the crack area is defined as the ratio of black pixels to gray pixels. Crack length was gauged via AutoCAD (Autodesk Inc.©).
Result computation
The calcium carbonate content is computed as the mass fraction W, whose value is expressed as a percentage and calculated in accordance with the following formula:
where the precise value of the concentration of the C-EDTA standard titration solution, expressed in moles per liter (mol/L); V—Determine the precise value of the volume of EDTA standard titration solution consumed by the sample, in milliliters (mL); Vo—The precise value of the volume of EDTA standard titration solution consumed in the blank test, in milliliters (mL); m—The precise value of the sample mass in grams (g); 0.1001—The mass of calcium carbonate in grams equivalent to 1.00 mL EDTA standard titration solution with a concentration of 1.000 mol/L; The arithmetic mean of the results of parallel determination is adopted as the content of the sample.
Wind tunnel experiments
The wind tunnel comprises three primary components: the tunnel body, the power unit, and the measurement and control system. The working principle entails using a power unit to drive a controlled airflow through a specially designed pipe to simulate the movement of a physical object in still air. This is accomplished by positioning a static model in the experimental section and measuring the aerodynamic forces exerted on it, as well as observing the flow phenomena on and around its surface. The experimental results are subsequently classified in accordance with the similarity theory, which enables their application to real objects. The experimental section is of paramount importance for the operation of the wind tunnel, as it must precisely simulate real flow fields. Additionally, certain indicators such as air quality (including uniformity and stability) and turbulence levels should be satisfied within this section, as depicted in Fig. 5. The technical indicators of the wind tunnel tester are as follows: Device size: 1650 × 450 × 410 mm; Experimental section size: 200 × 200 mm; Experimental section acrylic thickness: 5–8 mm; Wind speed 12 m/s in the experimental section. The crack condition of the sand treated for two month was investigated using the wind tunnel method. The specimen was positioned in the middle of the test section, and subsequently, the fan was switched on to commence the test. The speed of the fan was increased by adjusting the frequency of the fan every 1 h. This procedure was repeated until the maximum wind speed reached 12 m/s. The treated sand exhibits no dust emission.
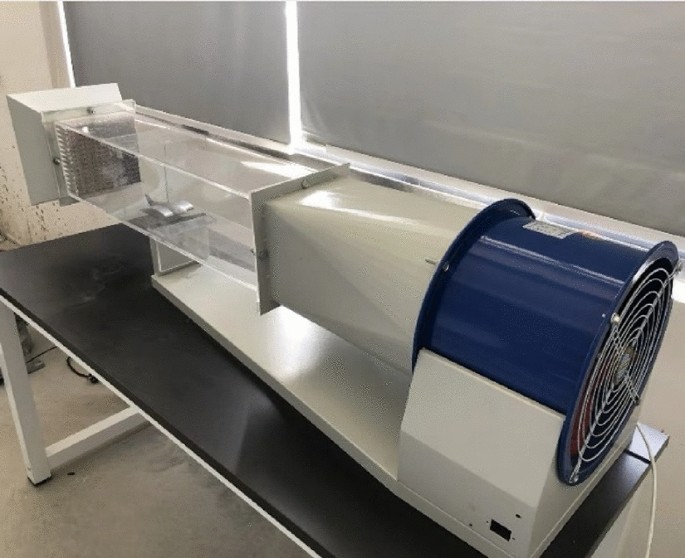
The small wind tunnel.
Dry and wet cycle test
The sand samples were utilized in the performance assessment under wet and dry cycle conditions to investigate their durability and stability. Primarily, the soil sample was subjected to treatment encompassing dry and wet cycles. The treatment involved uniformly spraying water onto the soil surface until it was thoroughly saturated, followed by natural air drying at a controlled room temperature of (30 ± 1) °C and relative humidity of (50 ± 5) %. After complete air-drying, the subsequent round of spray air-drying cycle was performed. To ensure sample stability, this study carried out 5 rounds of dry and wet cycle treatments. The weight loss and the loss of bearing capacity were determined subsequent to the wetting and drying cycle.
Freeze–thaw cycle test
In the freeze–thaw cycle test, the samples were sorted and frozen in a thermostat at – 20 °C, and then thawed at room temperature 30 °C. The number of freeze–thaw cycles ranged between 1 and 5 times. Based on the previous study35 and pilot tests, we chose five cycles for this experiment to control variables. The mass loss rate of the samples was calculated, and the bearing capacity loss rate after the freeze–thaw cycle was gauged. The weight loss and the loss of bearing capacity were appraised following the freeze–thaw cycle.
Analytical methods
The name of the SEM instrument is Cold Field-Emission Scanning Electron Microscope, and its manufacturer model number is Japan Hitachi, Regulus 8100. The name of the EDS instrument is Energy Dispersive Spectrometer, and its manufacturer model number is Bruker, QUANTAX EDS. The name of the XRD instrument is X-ray Diffractometer, and its manufacturer model number is Japan, Rigaku D/max2500. All of them are from Jiantu Technology (Suzhou) Co., LTD. Infrared: Bruker ALPHAII Fourier infrared spectrometer. In this paper, the development of the surface soil microstructure following MICP treatment was appraised through the utilization of the aforementioned instruments, and quantitative analysis, elemental analysis, as well as the determination of functional groups and chemical bonds in organic molecules were implemented.
Schematic flowchart
The research process is shown in Fig. 6.
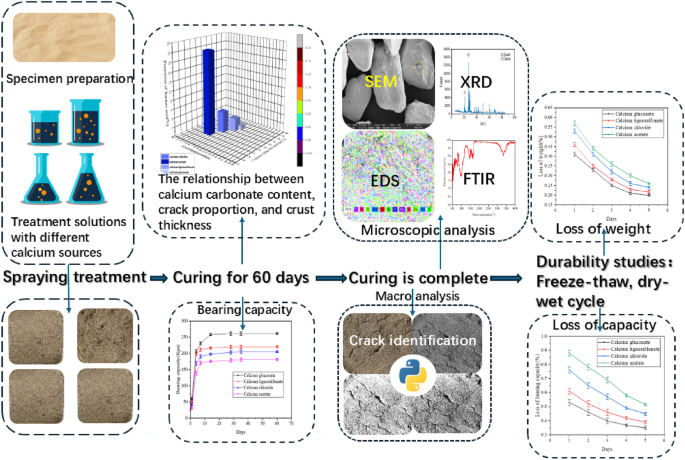
Schematic flowchart of the study.
Results and discussion
Bearing capacity
As illustrated in Fig. 7, the bearing capacity of the four distinct calcium sources complex stimulation solutions is markedly disparate. The bearing capacity of sand treated with calcium gluconate complex stimulation solution, calcium lignosulfonate complex stimulation solution, calcium chloride complex stimulation solution, and calcium acetate complex stimulation solution after 1 month is respectively 261 Kpa, 220 Kpa, 205 Kpa, and 181 Kpa. The strength of sand treated with calcium gluconate complex stimulation solution is approximately 1.4 times that of sand treated with calcium acetate complex stimulation solution. Through statistical analysis, it can be obtained that the mean bearing capacity of the samples supplemented with calcium gluconate was 194.87 Kpa, sum was 1558.94 Kpa, minimum value was 22.44 Kpa, median value was 244.17 Kpa, and maximum value was 261 Kpa. The mean bearing capacity of the samples supplemented with calcium lignosulfonate was 170.12 Kpa, the sum was 1360.94 Kpa, the minimum value was 22.44 Kpa, the median was 214.17 Kpa, and the maximum was 220 Kpa. The mean bearing capacity, sum, minimum, median and maximum values of calcium chloride addition samples were 154.24 Kpa, 1233.94 Kpa, 22.44 Kpa, 194.17 Kpa and 205 Kpa respectively. The mean bearing capacity of the samples supplemented with calcium acetate was 134.65 Kpa, the sum was 1077.24 Kpa, the minimum value was 22.44 Kpa, the median was 172.67 Kpa, and the maximum was 181 Kpa.
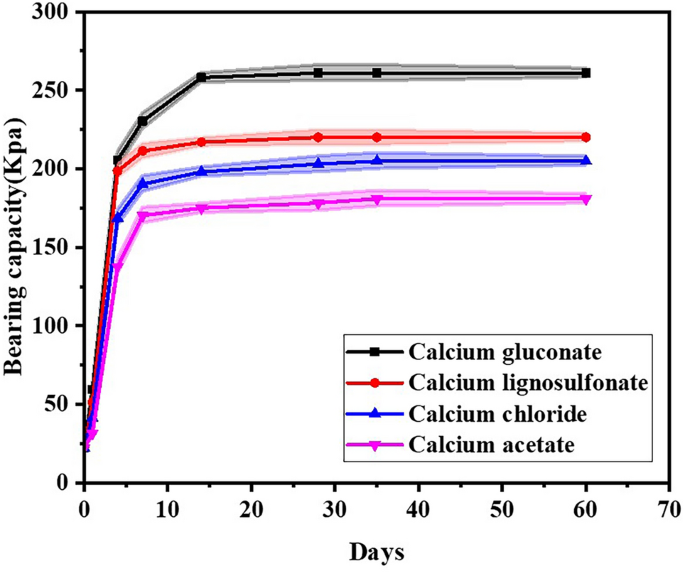
The temporal variation of the bearing capacity of four calcium sources.
From the aforementioned statistical analysis, it is evident that under the conditions of this study, the bearing capacity of samples containing calcium gluconate is superior. This is followed by samples containing calcium lignosulfonate, then those with calcium chloride, while samples containing calcium acetate exhibit relatively lower bearing capacity. This is attributed to the fact that the CaCO3 crystals induced by calcium gluconate are mosaic and combine into a more regular spherical shape, and the surface area of the sphere can be in more thorough contact with the sand particles, reinforcing the adhesion of the sand particles and augmenting the strength of the sand36. Therefore, the strength of sand treated with calcium gluconate is higher. When calcium acetate is adopted as the calcium source, the MICP mineralization reaction progresses slowly37. The decomposition rate of urea is low, and the utilization rate of calcium ions is also low. The crystal size is generally small and the shape is more irregular, resulting in inferior macroscopic mechanical properties, giving rise to a low strength of sandy soil and a weak enhancement in bearing capacity. A considerable amount of calcite calcium carbonate crystals were generated in the sample where calcium chloride acted as the calcium source. The crystals were continuously accumulated and interconnected with one another, manifesting a considerable enhancement in the mechanical properties of curing38.
Lignin and calcium carbonate are bound together to constitute a cement that fills the pores among soil particles. Lignin can provide a nucleation site for calcium carbonate, which can be manifested in enhancing shear strength and cohesion at a macro level. Additionally, it should be noted that the bearing capacity increases over time, and the bearing capacity of sandy soil treated with four types of calcium source stimulation solutions tended to stabilize after one month. Owing to the formation of calcium carbonate under the action of the complex stimulation solution of calcium sources, the bonding effect between sand grains becomes more robust. Calcium carbonate fills the interstices between sand grains, enhancing the bearing capacity of desert soil. This leads to an increase in the generation of CaCO3 through MICP and ultimately improves the strength of sandy soil39. Under the influence of the complex stimulation solution of calcium sources, calcium carbonate crystals fill the voids between coarse particles, thereby enhancing the compactness and strength of sand. Fine particles have a large specific surface area and high water and substance adsorption capabilities. This characteristic causes fine particles to absorb water, resulting in a cementation effect that increases the bonding force between soil particles40. Additionally, the fine particles of calcium carbonate crystals have fine and regular shapes that can form a relatively stable packed skeleton within sandy soil. This skeleton enhances the strength of sand.
Crust thickness and calcium carbonate content
The crust thickness and calcium carbonate content of the samples treated with four kinds of calcium source compound stimulation solutions are shown in Table 3.
Wind tunnel test
The fracture status encompasses total fracture length and proportion of fracture area, which are elaborated in detail in Table 4.
The three-dimensional cubic diagram delineating the relationship among calcium carbonate content, crust thickness, and proportion of fracture area is presented in Fig. 8; the histogram portraying the relationship between calcium carbonate content, crust thickness, and proportion of fracture area is shown in Fig. 9; the crack image recognition of the sample is exhibited in Fig. 10.
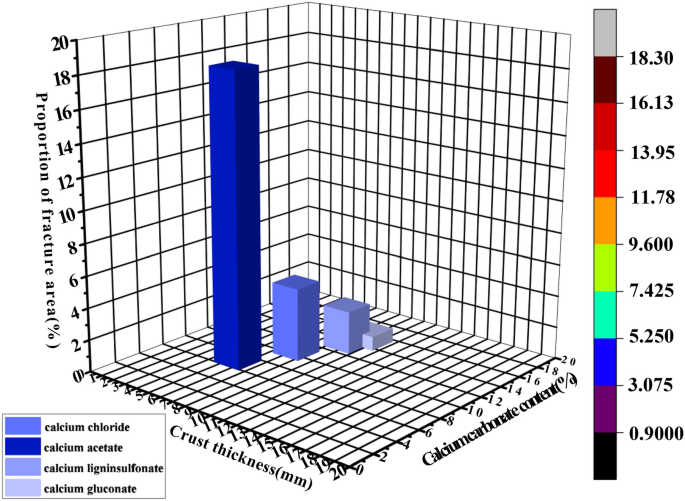
Three-dimensional cubic diagram depicting the proportional correlation between calcium carbonate content, crustal thickness, and proportion of fracture area.
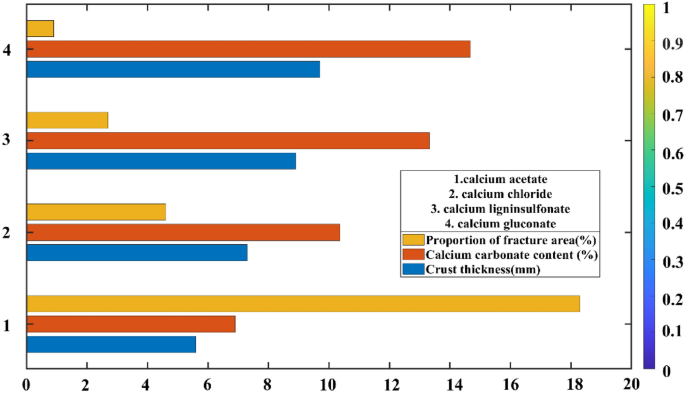
The histogram illustrating the proportional relationship among calcium carbonate content, crust thickness, and proportion of fracture area.
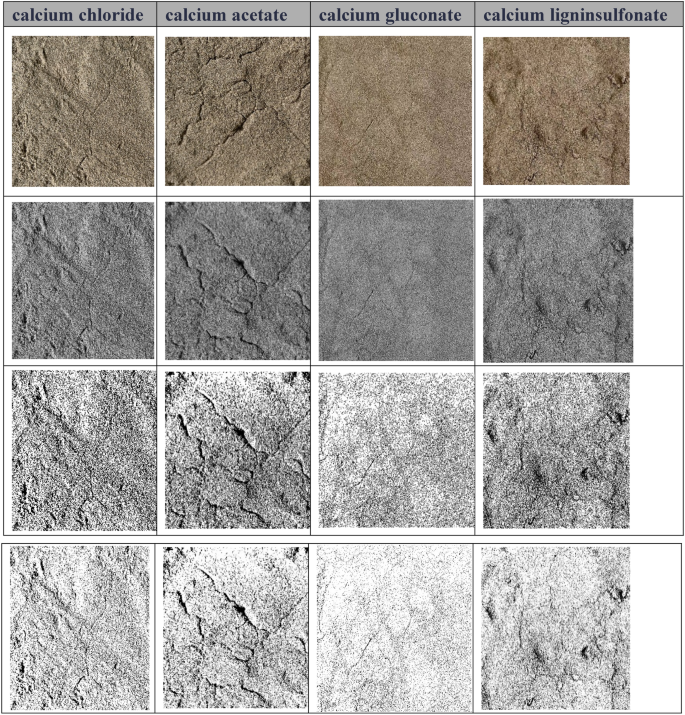
Refined image recognition of fracture.
Dry and wet cycle analysis
As depicted in Fig. 11, the weight loss of sand treated with calcium gluconate compound stimulation solution was 0.41% following one dry–wet cycle, and 0.199% after five such cycles. The weight loss of sand treated with lignosulfonate calcium calcium complex stimulation solution was 0.46% subsequent to one dry–wet cycle, and 0.215% after five of them. The weight loss of sand treated with calcium chloride compound stimulation solution was 0.53% after one dry–wet cycle, and 0.239% after five. The weight loss of sand treated with calcium acetate compound stimulation solution was 0.57% following one dry–wet cycle and 0.259% after five. The bearing capacity reduction of sand treated with calcium gluconate complex stimulation solution amounted to 0.53% after one dry–wet cycle and 0.35% after five dry–wet cycles. The bearing capacity reduction of sand treated with lignosulfonate calcium complex stimulation solution stood at 0.61% after one dry–wet cycle and 0.39% after five dry–wet cycles. After one dry–wet cycle, the bearing capacity loss of sand treated with calcium chloride complex stimulation solution was 0.76%, and after five dry–wet cycles, it was 0.45%. The bearing capacity reduction of the sand treated with calcium acetate compound stimulation solution was 0.88% after one dry–wet cycle and 0.515% after five dry–wet cycles.
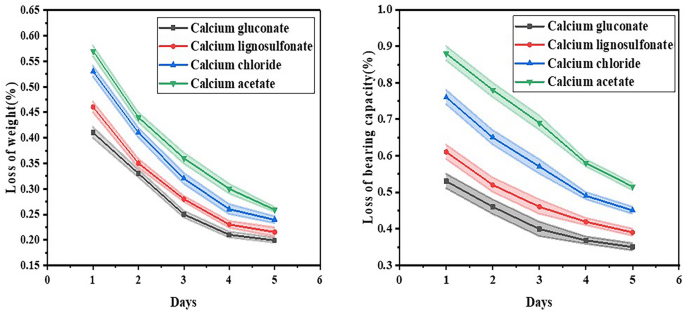
(a) Loss of weight after dry–wet cycle (%); (b) loss of bearing capacity after dry–wet cycle (%).
In terms of mass loss, the average mass loss of calcium gluconate samples was 0.28%, the sum was 1.399%, the minimum value was 0.199%, the median value was 0.25%, and the maximum value was 0.41%. The average mass loss of the samples supplemented with calcium lignosulfonate was 0.31%, the sum was 1.54%, the minimum was 0.215%, the median was 0.28%, and the maximum was 0.46%. The mass loss of the samples added with calcium chloride was 0.35% on average, 1.76% on total, 0.239% on minimum, 0.32% on median and 0.53% on maximum. The average mass loss of the samples supplemented with calcium acetate was 0.39%, the sum was 1.93%, the minimum was 0.259%, the median was 0.36% and the maximum was 0.57%. In terms of bearing capacity loss, the average bearing capacity loss of calcium gluconate samples was 0.42%, the sum was 2.11%, the minimum value was 0.35%, the median value was 0.399%, and the maximum value was 0.53%. The mean bearing capacity loss of the samples supplemented with calcium lignosulfonate was 0.48%, the sum was 2.399%, the minimum value was 0.39%, the median value was 0.46%, and the maximum value was 0.61%. The mean bearing capacity loss of the samples supplemented with calcium chloride was 0.58%, the sum was 2.92%, the minimum value was 0.45%, the median value was 0.57%, and the maximum value was 0.76%. The mean bearing capacity loss of samples supplemented with calcium acetate was 0.69%, the sum was 3.45%, the minimum value was 0.515%, the median value was 0.69%, and the maximum value was 0.88%. Through the analysis of the data, it is evident that after undergoing the dry–wet cycle test, the sample containing calcium gluconate exhibited comparatively small mass loss and bearing capacity loss, demonstrating superior durability. Conversely, the samples with calcium acetate experienced greater mass loss and bearing capacity loss, indicating inferior durability.
This substantiates the efficacy of the calcium compound stimulation solution in augmenting the durability performance of the sand under dry–wet circumstances. It is manifest that following 5 dry and wet cycle tests, the weight and bearing capacity losses of the sand treated with calcium gluconate complex nutrient solution were negligible, succeeded by the sand treated with calcium lignosulfonate complex nutrient solution, followed by the sand treated with calcium chloride complex nutrient solution, and the sand treated with calcium acetate complex nutrient solution manifested the most substantial mass and bearing capacity losses. When calcium acetate functions as the calcium source, the mineralization of MICP is tardy. The decomposition rate of urea is low, and the utilization rate of calcium ions is also scanty. Owing to the low decomposition rate of urea, the release of ammonia necessary for the reaction is inadequate, thereby influencing the formation of carbonate ions in subsequent reactions37. On the one hand, the soil undergoes successive cycles of drying and humidification. The sodium sulfate crystals precipitated from the soil and the solids formed therein dissolve in the pores, thereby giving rise to the destruction of the complex pore structure41,42,43,44. Under extrusion, small particles within the soil coalesce into larger aggregates, modifying the interconnections among soil particles and augmenting the pore spaces. Consequently, there is a diminution in medium-sized, small, and micro-pores while large pores undergo volumetric expansion. During the wet phases of these cycles, powdery bonds, unbounded minerals, and loosely bonded CaCO3 crystals functioning as cementing agents are promptly suspended. This gives rise to water-induced weakening of calcite and a decline in soil weight.
Freeze–thaw cycle analysis
As illustrated in Fig. 12, after undergoing one freeze–thaw cycle of calcium gluconate complex nutrient solution treatment, the bearing capacity of sand underwent a reduction of 0.65% and the weight loss was 0.51%; after five such cycles, the bearing capacity diminished to 0.38% and the weight loss was 0.21%. After one freeze–thaw cycle of calcium lignosulfonate complex stimulation solution treatment, the bearing capacity of sand declined by 0.73% and the weight loss was 0.59%; after five freeze–thaw cycles, the bearing capacity dropped to 0.43% and the weight loss was 0.22%. After one freeze–thaw cycle of calcium chloride complex stimulation solution treatment, the bearing capacity of sand decreased by 0.89% and the weight loss was 0.63%; after five freeze–thaw cycles, the bearing capacity lowered to 0.51% and the weight loss was 0.24%. After one freeze–thaw cycle of calcium acetate complex stimulation solution treatment, the bearing capacity of sand decreased by 1.23% and the weight loss was 0.68%; after five freeze–thaw cycles, the bearing capacity fell to 0.6% and the weight loss was 0.26%. With the escalation in the number of freeze–thaw experiment cycles, there is a decrement in both weight loss and bearing capacity. This demonstrates that the samples fortified with calcium compound stimulation solution showcase superior durability.
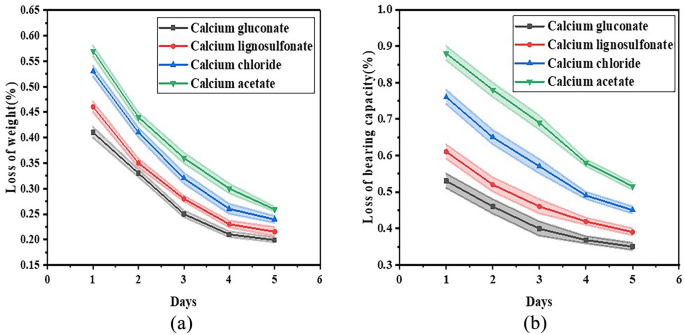
(a) Loss of weight after freeze–thaw cycle (%); (b) loss of bearing capacity after freeze–thaw cycle (%).
In terms of mass loss, the average mass loss of calcium gluconate samples was 0.31%, the sum was 1.57%, the minimum value was 0.21%, the median value was 0.27%, and the maximum value was 0.51%. The mass loss of the samples supplemented with calcium lignosulfonate was 0.35% on average, 1.77% on total, 0.22% on minimum, 0.31% on median, and 0.59% on maximum. The average mass loss of the samples added with calcium chloride was 0.38%, the sum was 1.89%, the minimum was 0.24%, the median was 0.32%, and the maximum was 0.63%. The average mass loss of the samples supplemented with calcium acetate was 0.4%, the sum was 2.03%, the minimum was 0.26%, the median was 0.34%, and the maximum was 0.68%. In terms of bearing capacity loss, the average bearing capacity loss of calcium gluconate samples was 0.48%, the sum was 2.41%, the minimum value was 0.38%, the median value was 0.45%, and the maximum value was 0.66%. The mean bearing capacity loss of the samples supplemented with calcium lignosulfonate was 0.55%, the sum was 2.76%, the minimum was 0.43%, the median was 0.53%, and the maximum was 0.73%. The mean bearing capacity loss of the samples supplemented with calcium chloride was 0.68%, the sum was 3.38%, the minimum value was 0.51%, the median value was 0.65%, and the maximum value was 0.89%. The mean bearing capacity loss of the samples supplemented with calcium acetate was 0.86%, the sum was 4.31%, the minimum value was 0.6%, the median value was 0.83%, and the maximum value was 1.23%. Based on the statistical analysis of mean, sum, maximum, minimum, and median values, after freeze–thaw cycle, the loss of bearing capacity and mass of calcium gluconate samples were lower. In contrast, samples supplemented with calcium acetate showed significantly higher bearing capacity losses as well as mass losses. These observations align with the results from the previously discussed dry–wet cycle tests.
After five freeze–thaw cycle tests, the weight loss and bearing capacity loss of the sand treated with calcium gluconate complex stimulation solution were negligible. This suggests that the treatment significantly enhanced the durability of the sand under circumstances prone to degradation. The findings imply a potential application of calcium gluconate in sandy soils where resistance to environmental factors is of supreme importance. Subsequently, the sand treated with calcium lignosulfonate complex stimulation solution manifested slightly higher magnitudes of mass and bearing capacity loss in comparison with those treated with calcium gluconate. Following this, the sand treated with calcium chloride complex stimulation solution displayed an intermediate level of performance regarding weight retention and structural integrity after being exposed to freeze–thaw cycles. While it offered certain benefits over untreated sand, it did not perform as proficiently as either of the aforementioned treatments. The mass loss and bearing capacity loss witnessed in the sand treated with calcium acetate complex stimulation solution were markedly greater than those noted in all other evaluated treatments. This indicates that although calcium acetate can be advantageous in certain situations, its effectiveness as a stabilizing agent under freeze–thaw conditions might be constrained when compared to other alternatives such as calcium gluconate or lignosulfonate.
The principal causes of mass decrement during freeze–thaw cycles encompass water infiltration, ice expansion, biogel cracks, and an increment in sand porosity. As the temperature drops during the freezing process of sand, the ice crystals within the sand gradually augment. The adsorption force between unfrozen water and ice crystals becomes stronger than the cementation effect between water and sand particles, weakening the cohesive forces between sand particles and resulting in an overall reduction in strength-consistent with previous research findings45. Water freezes and expands in volume, generating expansion stress. When the expansion stress is considerable, cracks will emerge in the sand sample. The number of freeze–thaw cycles gives rise to the increased and continuous accumulation of crack damage within the sample, following a pattern from less to more and from narrow to wide. During the melting process, water in the freeze-heave soil crystallizes into ice, causing the soil to become loose and resulting in mass loss due to surface shedding, peeling, and angulation. This leads to a deterioration in performance46. The lower mass loss rate of samples with calcium compound stimulation solution can be ascribed to factors such as void ratio, interparticle bonding strength, and ion concentration in the liquid phase. Intergranular bond strength plays a vital role in frost resistance. With the addition of calcium compound stimulation solution, there is an enhancement in intergranular bond strength which counteracts the stress caused by frost heaving, reduces strength loss, and minimizes quality loss.
Microanalysis
Figure 13 discloses the MICP reactive sand. There exist two principal modes of distribution for calcium carbonate crystal compounds. Some of them will adhere to the surface of sand particles and this site, while the other portion of the sand particles will accumulate in the throat between the pores. Based on the relationship between calcium carbonate crystals and soil particles, the effects of calcium carbonate crystals can be categorized into three types: film coating, adhesion, and sealing47.
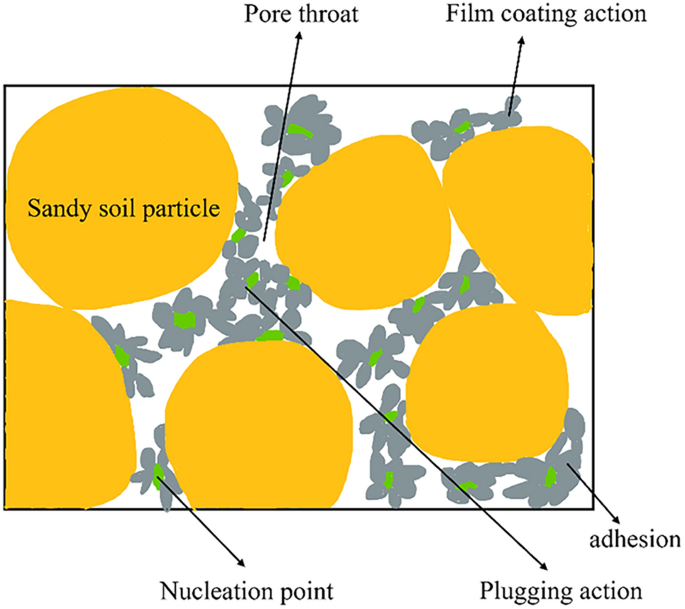
Reaction of MICP.
The microscopic mechanism of MICP stimulation for the complex nutrient solution with diverse calcium sources was further investigated, and the samples were inspected by SEM. The results are depicted in Fig. 14. As can be observed from Fig. 14: It is conspicuously perceivable that the morphology of calcium carbonate crystals constitutes diamond-shaped aggregates of diverse sizes. In light of the fact that the typical crystal structure of calcite is diamond-shaped, it can be provisionally inferred that the crystal is calcite33. Simultaneously, the adhesion and blocking effect among soil particles can also be identified. The impact of MICP treated by four disparate calcium sources on sandy soil was attained through the microscopic mechanism. In the calcium gluconate complex nutrient solution, the reactant urea undergoes a thorough reaction with the product carbonate ion, resulting in an escalation of calcium ions and the formation of additional calcium carbonate precipitation on the surfaces of soil particles, pore throats, and pores.
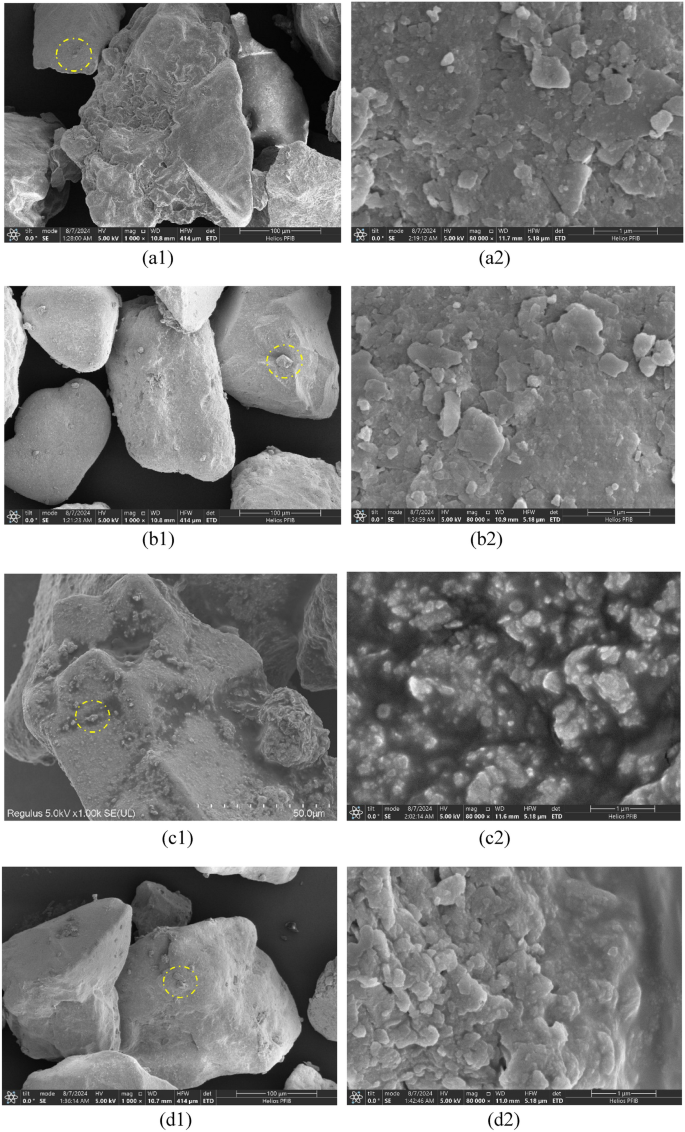
Images from SEM tests, (a1), (a2) calcium acetate; (b1), (b2) calcium chloride; (c1), (c2) calcium lignosulfonate; (d1), (d2) calcium gluconate.
In the sample where calcium lignonate acts as the calcium source, the petal-like cement formed through the integration of lignin and calcium carbonate filled the pores among the soil particles and provided the nucleation site for calcium carbonate. The calcium carbonate crystals elicited by calcium chloride are mainly hexagonal calcite. When calcium acetate is employed as the calcium source, the calcium carbonate crystals are mainly laminated calcite, and there are fewer depositions on the surface and pores of sandy soil particles, and there are more contact regions of soil particles and the surfaces of soil particles are not coated by calcium carbonate. All the samples manifested a smaller pore size formed among the particles during the curing process, facilitating the filling of the pores by calcium carbonate crystals. This is in accordance with the results presented in the literature48,49. The calcium carbonate crystals ameliorated the uniformity of the spatial distribution of the samples and significantly augmented the filling efficacy of the pores within the samples, which was also the cause for the increase in the bearing strength of the samples50,51.
Calcium carbonate predominantly deposits among the contact points of sand particles, binding adjacent soil particles and facilitating the cohesion of soil particles, thereby enhancing soil integrity and strength52,53,54,55,56. Calcium sources, serving as a crucial reactant, exert definite influences on the morphology and crystal content of the generated calcium carbonate crystals18,23. Manifestly, different calcium sources mainly alter the solidification effect by influencing the crystal type, morphology, content, distribution, and adhesion characteristics of the mineralization process of microorganisms. Calcium carbonate precipitates generated by inorganic calcium sources possess larger crystal particles and coalesce; those produced by organic calcium sources have smaller crystal particles and adhere to the substrate33,57. For instance, calcium carbonate precipitated with calcium chloride as the calcium source is composed of calcite and hexagonal calcite crystals, whereas calcium carbonate precipitated with calcium acetate as the calcium source, in addition to calcite and hexagonal calcite crystals, also contains needle-shaped aragonite crystals, However, due to the limited content of acicular aragonite in this study, it was almost impossible to observe58,59,60. The binding effect of MICP technology resides in the bridging function exerted by the calcium carbonate precipitation induced by microbial exudates, integrating loose particles into a consolidated mass61. Calcite crystals can bind with sand particles or inter-bond to bind sand particles together. In contrast to chemical bonding, microbial bonding is a bonding approach that consolidates the loose sandy soil into a unified mass centering around the sand particles62,63.
EDS
EDS elemental analysis was executed on the sample, and the test findings are illustrated in Fig. 15: The primary elements of the sand cured with various calcium sources compound stimulation solution are C, O, Si, and Ca. The silicon and oxygen elements emanate from the sand, as the main ingredient of the sand is silica; the carbon, oxygen, and calcium are sourced from calcium carbonate precipitation.
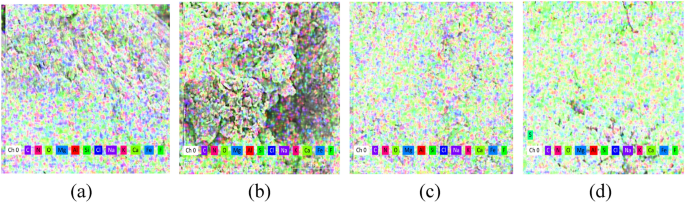
Images from EDS tests, (a) calcium acetate; (b) calcium chloride; (c) calcium lignosulfonate; (d) calcium gluconate.
XRD
As illustrated in Fig. 16, the X-ray diffraction test discloses that the principal mineral component of the sample is quartz, and quartz presents a strikingly distinct peak in all samples. Owing to the formation of calcium carbonate, the presence of calcite was determined. The XRD analysis of solidified sand in combination with the SEM images of solidified sand with diverse calcium sources in Fig. 14 suggests that the calcium carbonate precipitation crystals in solidified sand with different calcium sources are predominantly calcite. Among them, the content of calcite, in a descending sequence, is calcium gluconate as the calcium source sample, calcium lignosulfonate as the calcium source sample, calcium chloride as the calcium source sample, and the least is calcium acetate as the calcium source sample.
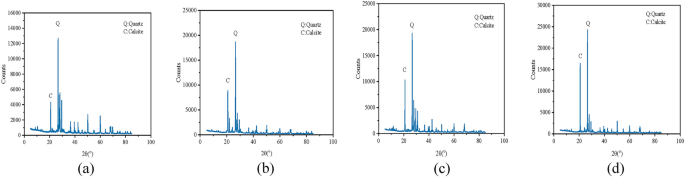
Images from XRD tests, (a) calcium acetate; (b) calcium chloride; (c) calcium lignosulfonate; (d) calcium gluconate.
FTIR
Infrared analysis of the sample was likewise conducted (Fig. 17). A wide IR peak was ascertained at 3588 cm−1, implying the formation of calcium carbonate in the treated sample64,65. The presence of quartz was determined at the infrared peak within 2000 cm−1.
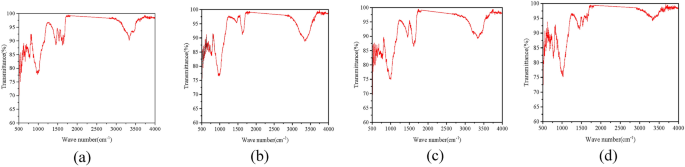
Images from FTIR tests, (a) calcium acetate; (b) calcium chloride; (c) calcium lignosulfonate; (d) calcium gluconate.
Discussions
Literature studies32,36 have demonstrated that calcium chloride and calcium formate yield significantly higher levels of calcium carbonate compared to calcium acetate. Additionally, samples treated with calcium acetate exhibit reduced surface strength and lower resistance to wind erosion. Prior research20 has shown that the unconfined compressive strength of sand column samples treated with calcium chloride as a calcium source nutrient solution is markedly greater than those treated with calcium acetate, which in turn exceeds the strength of samples treated with calcium lactate. According to References21,66, when utilizing three types of calcium sources-calcium chloride, calcium acetate, and calcium nitrate-for Microbially Induced Calcite Precipitation (MICP) tests, calcium chloride-treated samples exhibit superior performance and achieve the highest strength. Reference67 indicates that calcium lignosulfonate can substantially increase cement yield during the microbial reinforcement process of granite residual soil, thereby enhancing the overall reinforcement effect. The strengthening effects observed in this study align with previous findings, where calcium acetate demonstrates limited effectiveness, calcium chloride shows moderate performance, and calcium gluconate exhibits relatively better results, followed by calcium lignosulfonate.
This study investigates the mechanical properties of samples treated with various calcium sources, with particular emphasis on the efficacy of calcium gluconate as a curing agent. The results indicate that calcium gluconate exhibits a significant curing effect; however, several limitations of the study should be acknowledged. First, under the specific experimental conditions employed, the microstructural characteristics of calcium carbonate do not exhibit substantial differences and predominantly exist in the form of calcite. Consequently, an analysis of the statistical correlation between the micro-morphology and composition of calcium carbonate and the macroscopic mechanical properties of the samples has not been conducted. Additionally, the formation of calcium carbonate’s micro-morphology is influenced by multiple factors, including temperature, pH levels, cementing fluid concentration, spraying methodology, and spraying frequency. These variables represent critical areas for future research. Furthermore, this investigation has focused exclusively on the effects of different calcium sources and has not explored the implications of using two or more mixed calcium sources, which presents another area for further inquiry. Finally, while the current research is confined to laboratory experimental results, subsequent studies should aim to translate these findings into practical applications. This transition will require consideration of various factors, including economic costs, environmental impacts, and the interests of local communities.
Conclusions
The influence of four distinct calcium sources on the microbial solidification of sandy soil was explored. The findings reveal that, under the specific conditions of this study, calcium gluconate proved to be the most effective in terms of curing efficiency and durability. Calcium lignosulfonate followed closely, exhibiting durability that ranks second only to that of the calcium gluconate solution. Calcium chloride demonstrated moderate effects on curing sandy soil, accompanied by satisfactory durability, while calcium acetate exhibited the weakest curing effect and the least durability. After one month of treatment, the bearing capacities of the sand treated with calcium gluconate, calcium lignosulfonate, calcium chloride, and calcium acetate were ranked, in descending order, as follows: calcium gluconate solution, calcium lignosulfonate solution, calcium chloride solution, and finally, calcium acetate solution. Utilizing Microbially Induced Calcite Precipitation (MICP) in the desert soils of Xinjiang proves to be exceptionally beneficial, transforming the landscape and enhancing soil quality68. The research in this field will establish a scientific basis for environmental remediation and resource utilization, translating research findings from the laboratory into practical applications, promoting the broader application of related technologies in engineering practice. In particular, calcium gluconate source, due to its cost advantages and environmental friendliness, will play a key role in the future solidification of the desert in Kashi area, eliminating sand storms and related projects.


Responses