The landscape, trends, challenges, and opportunities of sustainable mobility and transport

Introduction
Amid accelerating global urbanization, the rapid growth of urban population and city expansion have become irreversible trends. United Nations (UN) projects that the global urban population share will increase from 56% in 2021 to 68% by 20501. Urban transport systems, as the core of modern socio-economic development, bear heavy responsibilities of daily commuting, goods transportation, and urban operations management. As a result, population growth presents challenges for urban transport, e.g., high energy consumption2, severe traffic congestion3, and significant greenhouse gas (GHG) emissions4. UN statistics indicate that transport accounts for approximately 23% of global emissions5, with expectations to double by 20506. Inland transport (i.e., road, waterway, and railway) constitutes 72% of these emissions within the sector7. Beyond GHG emissions, transport activities produce negative externalities that threaten environmental and public health8,9. Cumulative emissions of traffic pollutants significantly elevate the incidence of respiratory and cardiovascular diseases. Additionally, traffic congestion exacerbates the effects of increased fuel consumption and inefficient logistics10,11, bringing far-reaching chain reactions to the urban economy. Studies9,12 have shown that long-term traffic congestion not only raises the time cost of residents’ travel, but also leads to resource waste and diminishes the overall economic vitality of the city. Recognizing these multi-faceted impacts, establishing sustainable transport systems is imperative as a key strategic measure to safeguard human health, mitigate environmental impacts, and promote sustainable economic development.
The concept of sustainable mobility and transport (SMT) was initially introduced by the European Commission (EC) in 1992 in its Green Paper on the impact of transport on the environment13. Subsequently, sustainable transport was incorporated into Sustainable Development Goal (SDG) 11 ‘Sustainable Cities and Communities’14, underscoring its role in improving public health, promoting social equity, strengthening urban-rural linkages, enhancing societal productivity, and fostering closer economic integration. It was reaffirmed as a core issue of sustainable development at the 2012 United Nations Conference on Sustainable Development15.
In decades, balancing the growing demand for urban transport resources with the urgent need for developing sustainable transport systems has become a focal point for global leaders, researchers, and practitioners. Extensive research and practices have explored various pathways for developing sustainable transport models and tools16,17, including developing new fuels18,19, optimizing public transport systems20, deploying intelligent transport systems21, and promoting new energy vehicles22. These policies, systems, and tools provide theoretical support and technical means for achieving SMT. While previous studies16,17,23,24,25,26,27 review the research status and main developments in SMT, there remain research gaps that require exploration from new perspectives. On the one hand, most reviews focus on a single aspect of SMT, such as green transportation16, new energy vehicles22, green road freight23, or green logistics25, rather than conducting a comprehensive analysis from a holistic perspective. At the same time, these studies often rely on manual literature selection and limited content analysis, which may bring subjective bias and make quantitative assessments challenging. On the other hand, although a few studies26,27 have provided an overall review of the SMT field, they generally conduct static statistical analyses of the literature without mapping the knowledge structure or tracing the field’s dynamic development trajectory. Such insights are crucial for helping researchers identify core areas and make informed decisions about future research directions. Moreover, with the rapid growth of the SMT field and an exponential increase in publications in recent years (see Fig. 1a), the number of papers reviewed in the above studies is far smaller than the total number of publications currently available. Especially in the post-pandemic era, a wave of emerging technologies such as autonomous driving28 and smart shipping29, along with innovative travel modes like multimodal transport30, and carpooling31, are being explored to alleviate traffic congestion and improve travel efficiency, thereby advancing SMT development. These innovations are reshaping research trends and directions within the SMT field. Therefore, it underscores the urgent need for a thorough reassessment of the academic landscape in SMT to stay abreast of these evolving dynamics.

a Trends of publications and citations. The green curve shows the estimated growth trend of the number of publications, and ({R}^{2}) denotes the coefficient of determination. The dotted line indicates that the data represents the number of papers published before April 15, 2024. The inset illustration represents some key milestones related to SMT. Wherein ‘EC’ denotes European Commission, and ‘ECMT’ denotes the European Conference of Ministers of Transport. b Cumulative publications in the top 15 most popular journals during 1994-2024. c Co-occurrence relationships between the disciplines to which all publications belong. The thickness of the edges indicates the strength of the co-occurrence relationship.
Here, we utilize bibliometric methods32 to conduct a systematic and objective review of 7710 SMT publications from 1994 to 2024. First, we portray the academic landscape of these publications, detailing yearly output, citations, journal influence, and the interdisciplinary research nature of the research. Second, we map the geographic distribution and construct country/territory cooperation networks and institution cooperation networks to reveal the productivity of various academic entities and the academic communities they form. Third, we establish keyword co-occurrence networks and reference co-citation networks to pinpoint prevailing research topics in SMT, enabling researchers to quickly grasp the current development dynamics of common and cutting-edge technical theories. Meanwhile, we also propose a method for tracking the evolution of research topics based on co-occurrence features, illustrating the progression of various topics. Fourth, we construct a citation network of all publications to examine the structure of knowledge flow within SMT. Employing main path analysis methods33, we delineate the critical paths of knowledge diffusion in SMT, outlining the evolution and refinement of established and emerging theories and technologies. Finally, we gain insights into the ongoing challenges and emerging opportunities in SMT, serving as a forward-looking guide for both practitioners and researchers.
Results
Publication landscape
To map the academic landscape in SMT, we initially downloaded relevant publications from the Web of Science (WoS) Core Collection using a predefined retrieval strategy (see Methods for details). After data cleaning (see “Methods” for details), a total of 7710 publications were obtained.
Figure 1a displays the annual total number of publications (TP) and their corresponding total citations (TC). The earliest paper was published in 1994 by Blonk34, which underscored the significance of short sea shipping and inland waterways. Between 1994 and 2004, the annual number of SMT-related publications remained below 50, except in 2003 (TP = 52). Since 2005, the number of publications has steadily increased, exhibiting exponential growth ((y=5.377exp (0.179x),{R}^{2}=0.925)) over the past decade. This surge is partly attributable to the inclusion of sustainable transport in the 17 SDGs since 2000, garnering increased global attention to SMT. Consequently, researchers and practitioners are dedicated to developing new technologies and innovative policies to promote transport sustainability. Figure 1a highlights some prominent conferences and events related to SMT, all emphasizing the importance of advancing SMT. Moreover, the TC value of a paper measures its impact within the field. As interest in SMT continues to grow, the number of citations for related publications has gradually increased. Meanwhile, since citations take time to accumulate, papers published in recent years exhibit a declining citation trend.
Figure 1b displays the top 20 most popular journals in SMT (see Supplementary Table 1 for details), listing the cumulative number of papers published by each journal. Most of these publications appear in journals focusing on transport or sustainability. Noteworthy journals include Sustainability (TP = 906; TC = 9392), Transportation Research Record (TP = 201; TC = 2887), Transportation Research Part D-Transport and Environment (TP = 173; TC = 4712), and Journal of Cleaner Production (TP = 170; TC = 4626), each published more than 170 publications on SMT. The substantial number of publications and citations in these journals reflect their significant academic influence and prestige in the field of SMT.
To elucidate the disciplinary distribution within the field of SMT, we constructed a co-occurrence network of disciplines based on the subject categories defined by WoS. Our results reveal that the publications cover more than 100 subject categories. The five disciplines with the highest proportion are Green & Sustainable Science & Technology (22.96%), Transportation (22.92%), Environmental Studies (21.09%), Transportation Science & Technology (20.27%), and Environmental Science (19.82%) (see Supplementary Table 2 for details). These disciplines exhibit a strong co-occurrence frequency with one another. Additionally, significant interactions are observed with leading disciplines such as Economics, Engineering, and Urban Studies, highlighting the inherently multidisciplinary nature of research in SMT. Progress in SMT solutions necessitates collaborative and interdisciplinary efforts among scholars from diverse fields, including but not limited to Transportation, Engineering, Environmental Science, Social Sciences, and Urban Studies.
As illustrated in Fig. 2a, we visualize the global geographical distribution of all publications, with darker shades indicating a higher total number of papers published by the respective countries/territories. In total, 118 countries/territories have published papers related to SMT, but the distribution of publications is markedly uneven. The top five most productive countries are China (TP = 1052), USA (TP = 964), Italy (TP = 704), UK (TP = 630), and Germany (TP = 469), collectively contributing to approximately 50% of the total publications (see Supplementary Table 3 for details). This observation likely reflects the robust governmental support, economic prioritization, and policy frameworks in these countries, which emphasize sustainable urban transport as a means of achieving climate and economic goals. For example, China has heavily invested in electric vehicle (EV) infrastructure and public transport development as part of its commitment to reducing greenhouse gas emissions36,37. Similarly, Germany’s strong automotive industry and its focus on innovative mobility solutions contribute to its high publication output in this field38,39.
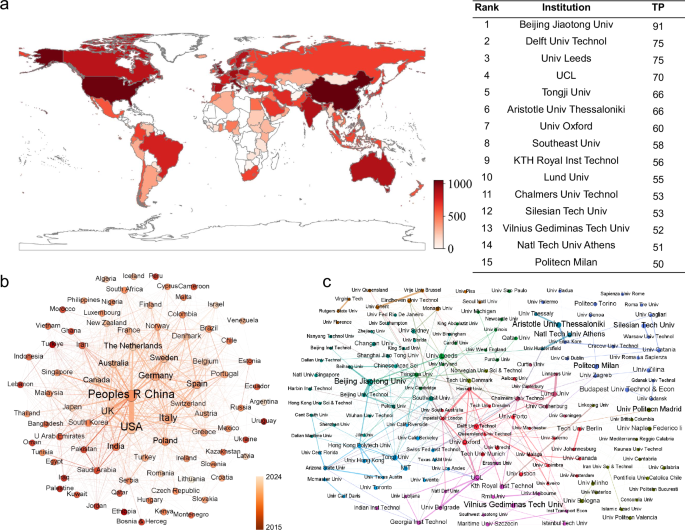
a Global geographical distribution of publications. The color of each country/territory indicates the total number of publications, where ‘TP’ denotes the total number of publications. The inset table shows the top 15 most productive institutions. b Cooperation network between countries/territories. Each node indicates a country/territory, and the node’s size and color indicate its degree and average publication year of papers, respectively. The edges indicate the cooperation relationship between countries/territories. The thickness of the edges indicates the strength of the cooperation relationship. c Cooperation network between institutions. Each node indicates an institution, and the node’s size and color indicate its degree and the academic community it belongs to, respectively. The edges indicate the cooperation relationship between institutions.
Intensifying international academic collaboration facilitates knowledge sharing, dissemination, and innovation within the field. We constructed a cooperation network between countries/territories to explore their cooperation relationships. Figure 2b shows the largest connected component of the cooperation network among countries/territories, with a TP value of no less than five, comprising 85 nodes and 1036 links. Node size and color correspond to the number of publications and average publication year for each country/territory, respectively. Link thickness indicates cooperation strength. There is robust international academic cooperation, with each country/territory, on average, collaborating with 24 others. This extensive cooperation significantly drives the development of SMT. Particularly noteworthy are the close collaborative ties between China, USA, and UK, probably due to frequent academic visits and research exchanges. Additionally, countries/territories on the network’s central area tend to have more recent average publication years, indicating ongoing production of new research outcomes. In contrast, countries/territories on the network’s periphery have witnessed fewer publications in recent years, suggesting a diminishing focus on SMT research in these areas. The differences in focus on sustainable transport development across these countries/territories may stem from varying levels of transport system advancement and infrastructure maturity. Research in relatively developed regions tends to concentrate on enhancing the efficiency and sustainability of transport systems, while some developing countries/territories may still be addressing foundational infrastructure development.
To conduct a granular analysis of the cooperation relationships between institutions and identify well-established academic communities, we constructed a cooperation network of institutions. Figure 2c shows the largest connected component, involving institutions with a TP value of no less than 15, comprising 52 nodes and 642 links. Node size reflects the number of papers published by each institution. The top 15 most productive institutions are listed on the right side of Fig. 2a (see Supplementary Table 4 for details). Meanwhile, we applied a modularity-based clustering algorithm35 to uncover research communities within the field of SMT. Figure 2c illustrates ten tightly-knit research communities, with notable clusters centered around Delft University Technology (red cluster), University College London (UCL; pink cluster), and Beijing Jiaotong University (green cluster). These communities boast numerous participating institutions and active international collaborations, demonstrating their substantial academic influence and close cooperative relationship networks within the SMT domain.
Research topic identification and evolution trend analysis
To pinpoint SMT’s research hotspots and evolutionary trends, we extracted keyword information from all publications and constructed a keyword co-occurrence network. The network maps the fundamental structure of domain knowledge by analyzing the distribution and relationships of keyword occurrences. The publications feature over 17,000 keywords, including author-defined keywords and keywords indexed by WoS. Figure 3a shows the largest connected component composed of keywords with a frequency of no less than five, featuring 1724 nodes and 82,749 links. Nodes signify keywords, scaled by occurrence frequency, and links denote the co-occurrence relationships between them. We can see that the research predominantly centers around core keywords like ‘sustainable transportation’, ‘sustainable mobility’, ‘sustainability’, ‘model’, ‘system’, ‘transportation’, and ‘city’.
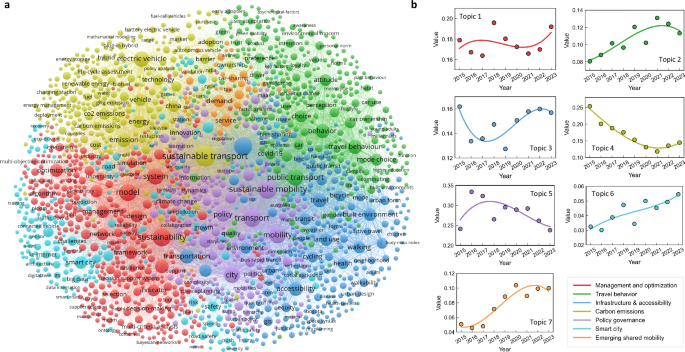
a Keyword co-occurrence network. Each node indicates a keyword, and the node’s size and color indicate its average co-occurrence frequency and the research topic it belongs to, respectively. b Evolution trend of research topics in the past decade. The y-axis indicates the importance of each topic in the corresponding publication year. The curve fits the evolution trend of topic importance.
Further, by applying a modularity-based clustering algorithm35 to the occurrence frequency of all keywords, we identified seven clusters, each represented by a different color. Subsequent semantic analysis of the keywords within each cluster allowed us to assign descriptive labels that clearly define specific research topics. Note that these seven research topics are interrelated and closely related to SMT.
Specifically, Topic 1 (red cluster) focuses on Management and Optimization, covering studies that manage, evaluate, and optimize transport networks using advanced algorithms (e.g., game theory, multi-objective optimization, and multi-criteria analysis). Key studies include dynamic vehicle scheduling40,41, path planning for logistics and supply chains42,43, and multimodal transport integration30,44, all aimed at enhancing efficiency and reducing carbon emissions. Topic 2 (green cluster) focuses on Travel Behavior, analyzing daily travel preferences45,47 (e.g., travel modes, and travel purposes), and the factors influencing these choices46 (e.g., economic cost, time cost, and convenience). It also involves exploring the social and psychological factors affecting travel behavior47, such as environmental awareness, health considerations, and community culture. Topic 3 (blue cluster) focuses on Infrastructure and Accessibility, examining how the planning and design of infrastructure and the built environment impact transport sustainability48. It involves exploring strategies such as mixed land use49, and high-density development50 to promote low-carbon transportation modes. Meanwhile, it involves enhancing accessibility to transport services and urban resources for different groups51,52, aiming for an equitable and sustainable transport system. Topic 4 (yellow-green cluster) focuses on Carbon Emissions, researching new renewable energy fuels19, promoting electric and hybrid vehicles53, and optimizing the layout of charging infrastructure54 to reduce reliance on fossil fuels. It also involves evaluating the impact of low-carbon policy incentives, and travel inducement strategies on carbon emission reduction55. Topic 5 (purple cluster) focuses on Policy Governance, analyzing SMT-related policy efficacy in reducing carbon emissions, and exploring new policy tools55 (e.g., congestion charges, parking management, and green travel incentives). Topic 6 (light blue cluster) focuses on Smart City. This topic emphasizes integrating technologies, such as the Internet of Things (IoT), digital twins, and big data, to manage urban traffic intelligently21. It also involves assessing the safety and reliability of smart city transport systems to ensure that technology applications enhance efficiency while ensuring resident safety56. Topic 7 (orange cluster) focuses on Emerging Shared Mobility, studying the potential of shared mobility modes16,46, such as car-sharing and Mobility as a Service (MaaS), to replace traditional transport modes and reduce traffic congestion. Additionally, it involves examining how shared mobility services meet the travel needs of different populations and their impact on overall traffic demand patterns, and further explores optimization methods to balance travel supply and demand57.
Based on the identified research topics, we proposed an approach to analyze topic evolution trends using co-occurrence frequency (see Methods for details). This approach assesses how research topics have evolved by tracking the annual number of publications corresponding to each topic. Figure 3b illustrates the evolution of these seven research topics from 2014 to 2024. The y-axis indicates the proportion of publications related to each topic, reflecting the popularity of each research topic. Topics 1, 3, 4, and 5 dominate the field, collectively averaging above 0.8 in importance, highlighting their longstanding significance in the SMT domain. However, since 2019, Topics 1, 4, and 5 have declined in popularity, possibly influenced by the COVID-19 pandemic, which shifted research focus toward public health and crisis management. This diversion has temporarily reduced emphasis on traditional transport management and emissions control areas, as immediate societal needs took precedence. Conversely, Topics 2, 6, and 7 have drawn increasing attention. This surge is driven by several interrelated factors. For example, the proliferation of travel data, facilitated by advancements in data collection technologies and heightened digital engagement, has significantly enriched research possibilities. Concurrently, innovative shared mobility solutions, such as ride-sharing and bike-sharing, have catalyzed a paradigm shift in urban transport dynamics. Additionally, the advent of smart city technologies has enhanced integration and automation within urban transport systems, paving the way for more efficient and user-centric mobility frameworks.
Additionally, we constructed a co-citation network of references to identify the key literature supporting the development of these popular topics. Figure 4 shows the largest connected component comprising the top 1000 references with at least ten citations and the highest co-citations counts. Each node represents a reference, labeled with the first author’s name and the publication year, and scaled by its number of citations. Using a modularity-based clustering algorithm35, we classified all nodes into nine clusters based on their co-citation strength. Subsequent content analysis of references within each cluster enabled us to assign specific labels and identify the trend of the top three most cited references in each cluster (see Supplementary Table 5 for details). These references cover various subfields and align closely with the seven research topics. For example, references in the blue51,52 and green58 clusters align with the topics of Infrastructure and Accessibility, and Travel Behavior, respectively. Co-citation analysis revealed insights that were not apparent from the keyword co-occurrence networks. Notably, many SMT-related studies reference works on bike-sharing and electric bicycles59,60 (i.e., red and light red clusters), highlighting a growing interest in these bike-based shared mobility modes as a new research focus. Based on the content analysis of relevant literature, this trend is particularly pronounced in Europe, where governments and cities prioritize sustainable transport solutions to combat urban congestion, reduce greenhouse gas emissions, and promote healthier lifestyles. The rising popularity of bike-sharing schemes can be attributed to their ability to offer flexible, affordable, and environmentally friendly alternatives to traditional transport modes, particularly in densely populated urban areas. Moreover, integrating digital technologies and mobile applications has further enhanced the accessibility and convenience of these services, fostering greater user adoption. Additionally, numerous citations related to transport system transformation61,62 underscore the role of sustainable transport development in driving urban transport innovation, characterized by the adoption of intelligent and sustainable practices, including new mobility modes, electric vehicles, and shared transport options. Specifically, innovative practices not only enhance the transport system’s operational efficiency but also contribute to reducing the carbon footprint of urban mobility. By prioritizing sustainable transport solutions, cities can achieve broader environmental goals while addressing issues such as air quality, traffic congestion, and public health.
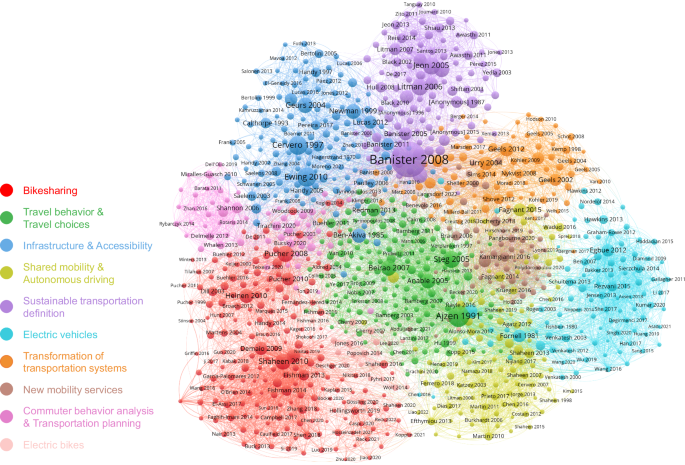
Each node indicates a reference cited by a publication, and the node’s size and color indicate the number of citations and the research direction it belongs to, respectively.
Knowledge diffusion path analysis
The citation network of papers not only portrays the academic influence of publications through citation counts, but also reveals the knowledge flow within the field. As shown in Fig. 5a, we constructed a paper citation network based on the citation relationships of 7710 publications to analyze the knowledge structure in SMT. This network comprises 7710 nodes and 10,655 links. Nodes signify publications, scaled by their total citation numbers and colored by their publication year. Links represent the citation relationships between the publications. We analyzed the network and found that central publications have dense citation connections, indicating their role as bridges and hubs in knowledge diffusion. At the network periphery, numerous isolated nodes represent publications that have not established citation relationships with other publications, reflecting their marginal status in the field. Based on the total citations of the publications, we identified the top 20 most influential publications (see Supplementary Table 6 for details). Among them, the three publications with the highest citations are Banister (2008)63, Tapio (2005)64, and Shaheen et al.65.
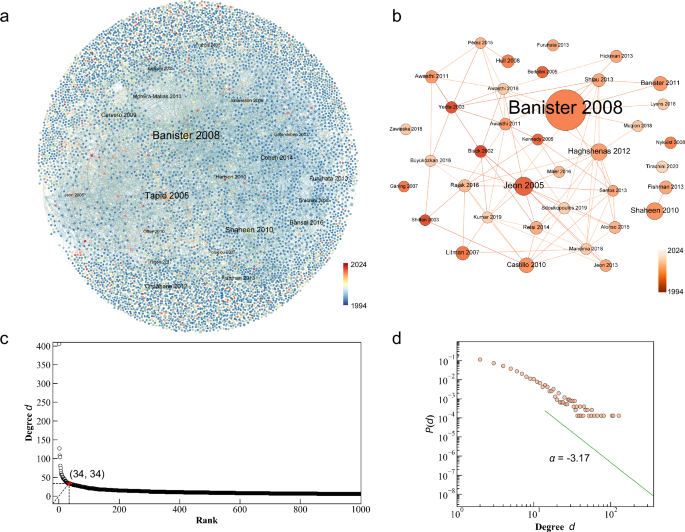
a Citation network of publications. Each node indicates a paper, and the node’s size and color indicate the total number of citations and the publication year, respectively. The top 20 most cited papers are labeled with the paper’s first author and publication year. b (h)-core subnet of the paper citation network. Each node indicates a paper with an (h)-index greater than 34. The node’s size and color indicate the publication year and degree, respectively. c Distribution of degree rankings of all publications. A star indicates a degree value equal to 34. d Degree distribution of all publications. The green line shows the corresponding power-law distribution curve with (Pleft(dright)={d}^{alpha }), where (alpha) is equal to -3.17.
The degree of a node measures the number of times a publication cites others or is cited within the citation network. Figure 5d shows the degree distribution of all publications, which follows a power law distribution with (P(d)propto {d}^{-3.17}), as indicated by the green line. The node degree is highly uneven, with only about 0.18% of publications having a degree greater than 50. This indicates that the knowledge base in SMT is quite broad, with diverse research topics and directions. To better illustrate the citation relationships of key publications with higher degrees, we extracted the (h)-core66 of the citation network. As shown in Fig. 5c, we ranked all publications by degree and found that 34 papers had a degree of at least 34, indicating the network’s (h)-index is 34. We retained these nodes and restored their citation relationships, resulting in the core subnet shown in Fig. 5b. In this subnet, nodes represent publications labeled by the first author’s surname and publication year. Node size is scaled based on degree, and color indicates the publication year. Directed links represent citation relationships. This network includes the three most cited papers, highlighting their critical bridging role in knowledge diffusion within the field. Specifically, Banister63 envisioned the sustainable mobility paradigm, outlined seven key elements for sustainable mobility, and emphasized the importance of enhancing the flexibility of traditional transport planning and introducing necessary policy measures. Tapio64 discussed the decoupling relationship between traffic volumes, GDP, and CO2 emissions from transport, focusing on the EU15 countries between 1970 and 2001. Shaheen et al.65 analyzed the development history of global bike-sharing, proposed the fourth-generation demand-responsive, multimodal systems, and discussed bike-sharing’s challenges and social and environmental benefits.
To further identify the key paths of knowledge diffusion in SMT, we conducted a main path analysis based on the citation network. The Search Path Count67 method was used to measure the traversal weight of the links in the citation network. We then employed the global standard main path (GSMP), forward local main path (FLMP), and backward local main path (BLMP) algorithms to identify the core knowledge diffusion paths33. These three path search algorithms are complementary. GSMP aims to identify the path with the maximum sum of link weights in the citation network; FLMP focuses on identifying new and highly cited publications to highlight important recent research; BLMP emphasizes incorporating older and highly cited literature to underscore core works with a far-reaching impact on the field’s development. Figure 6 shows the three main paths, with each circle representing a publication labeled by the first author’s surname and publication year. GSMP includes 15 key SMT-related publications. Building on the GSMP literature, FLMP and BLMP add eight (marked in orange) and five (marked in blue) publications, respectively, further enriching our understanding of the knowledge diffusion paths in SMT.
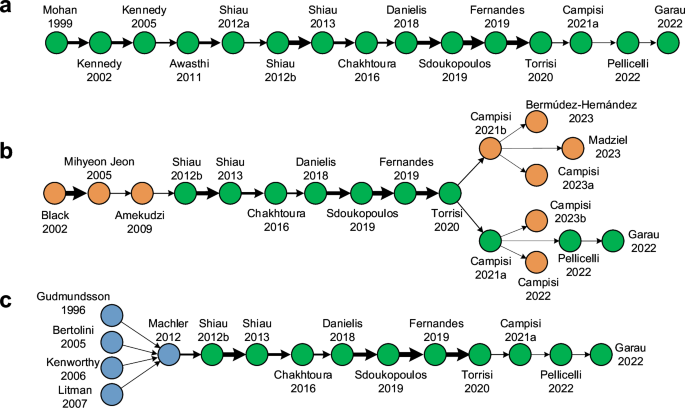
a Global standard main path. b Forward local main path. c Backward local main path. Nodes represent key publications on the diffusion path. Each node is labeled with the paper’s first author and publication year. Arrows represent the information flow of publications, and the size of arrows represents the importance of information flow. Orange and blue nodes indicate that the target node does not appear in the global standard main path.
Over the past three decades, SMT research has evolved from focusing on sustainable infrastructure design to encompass various aspects such as sustainability indicator selection, comprehensive indicator system construction, externality and cost assessment, and policy and planning. These researches have incrementally formulated a multi-faceted strategic and methodological framework. Specifically, GSMP traces back to the work of Mohan and Tiwari68, which underscored the importance of catering to the infrastructure needs of non-motorized transport modes in designing and implementing sustainable transport systems. This study laid the groundwork for subsequent sustainability evaluations of transport systems69,70. Building on Kennedy’s evaluation framework70, Awasthi and Chauhan71 evaluated the impact of various transport measures on urban sustainability, offering a more detailed and systematized evaluation tool. Subsequent to this, Shiau72,73,74 developed a compound index and hierarchical indicator system to measure transport sustainability. Applying these techniques for transport sustainability evaluation, Chakhtoura and Pojani75 evaluated the efficacy of sustainable urban transport plans in Paris, and explored suitable indicator systems for complex metropolitan contexts. Danielis et al.76 applied various techniques to estimate the composite sustainability indicators of provincial cities in Italy.
Notably, the thickest arrow from Sdoukopoulos (2019) points to Fernandes (2019), the critical role this knowledge transfer plays in knowledge diffusion. Sdoukopoulos et al.77 provided a comprehensive overview of existing methodologies for measuring transport sustainability, underscoring the need to adequately account for externalities in sustainable transport research. This study inspired Fernandes et al.78 to devise a sustainability indicator system that fully encompasses road traffic externalities, including traffic congestion, noise, emissions, health impacts, and road crashes.
As the sophistication of transport sustainability indicator systems improved, research gradually pivoted toward specific policy and planning practices. For example, Torrisi et al.79 discussed the impact of negative transport externalities on transport sustainability, proposing a new paradigm for sustainable transport planning. Given the impact of the COVID-19 pandemic, certain studies80 tackled the adjustment and optimization of sustainable transport policies during and post-pandemic.
Toward the end of GSMP, the emergence of new technologies has diversified research on enhancing transport system sustainability. These studies have broadened the application of transport sustainability across diverse geographical and social contexts. For instance, Pellicelli et al.81 explored the “15-minute city” concept, emphasizing the importance of pedestrian and bicycle access to essential services within a neighborhood. Garau et al.82 proposed a multimodal integration model to consider island-specific socio-economic problems and infrastructure challenges.
At the source of the FLMP and BLMP, studies explore the definition and evaluation methods of sustainable transport systems from diverse perspectives. Concerning elements of transport sustainability, Gudmundsson and Höjer83 emphasized that constructing a sustainable transport system should align with developmental and sustainability principles. Bertolini et al.84 and Machler and Golub85 suggested combining community services and transport accessibility characteristics. Additionally, Kenworthy86 provided ten guidelines to foster transport and urban sustainability. Regarding the selection of evaluation indicators, geographical-based87 and causality-based88 indicator systems were developed. Additionally, Litman89 explored potential issues with conventional indicators and suggested methods for indicator selection catered to various scenarios. In analyzing transport sustainability impacts, Amekudzi et al.90 introduced a sustainability footprint framework to assess the influence of transport on regional sustainable development.
Recent research at the end of the FLMP enriched our understanding of sustainable urban transport systems, covering flexible and responsive transport systems91,92, non-motorized vehicles and infrastructure93,94, transport system simulation and optimization95, and last-mile logistics and green transport96. For example, Campisi et al.92 analyzed the application of DRT amidst the COVID-19 pandemic. Bermúdez-Hernández et al.93 proposed public policy suggestions and strategic recommendations to boost the usage and satisfaction levels of the EnCicla system. Campisi et al.96 deliberated on the challenges surrounding last-mile logistics management and its environmental footprint, proposing a solution for urban goods transportation utilizing electric bicycle-based vehicles.
Based on the content analysis of publications along the main path, we can summarize the following research findings:
-
a.
Early studies laid a solid theoretical foundation for defining and evaluating the sustainability of transport systems. Over time, this field has evolved to integrate practical policies and public participation in assessing the impact of sustainable transport systems, particularly in responding to emergencies and environmental changes.
-
b.
The rapid advancement of emerging transport tools and technologies has diversified research in the field. Innovations such as DRT, and the “15-minute city” model have significantly enhanced the sustainability, flexibility, and accessibility of transport systems.
-
c.
While knowledge flow in SMT predominantly focuses on defining and evaluating sustainability, recent technological advancements, such as autonomous driving, low-altitude travel, and digital twins, have not yet appeared prominently on the main path. This suggests these technologies are still in their infancy, requiring further exploration and exploitation of their inherent potential by researchers.
Challenges and opportunities
Sustainable transport is essential for balanced global social, economic, and environmental development. This paper presents an objective and comprehensive review of 7710 SMT publications from 1994 to 2024, employing bibliometric methods. The results indicate that over the past 30 years, the academic ecosystem in SMT has been highly active, with publications increasing exponentially. The research is multidimensional and interdisciplinary, involving over 100 countries in academic cooperation that has fostered tight-knit academic communities and advanced sustainable transport technologies. However, a decline in SMT research investment has been noted in some countries/territories. This paper urges countries such as China, USA, and UK to strengthen international cooperation and technology sharing to propel global sustainable transport development. Through keyword co-occurrence network analysis, we identified seven research topics closely related to SMT, and tailored a method for exploring their evolution. These topics have exhibited different trends influenced by sustainable policies and external events (e.g., the COVID-19 pandemic). It provides scholars with insights into evolving research hotspots while underscoring the importance of addressing declining areas of focus. To further identify the knowledge diffusion trajectory in the field and enrich our understanding, we constructed a citation network and extracted its (h)-core to pinpoint core literature, and used three main path analysis methods to trace the knowledge diffusion trajectory in SMT. Initial research primarily addressed the definition and performance evaluation of sustainable transport. As the theoretical foundation solidified, the focus shifted to policy and social impacts. The research landscape has diversified with new transport technologies emerging, reflecting a vibrant academic ecosystem. Based on quantitative and qualitative review analysis, we highlight five research gaps that should be addressed through interdisciplinary knowledge fusion and international cooperation. The topics, methods, limitations, and opportunities of each research gap are summarized in Table 1.
-
a.
Post-pandemic travel behavior: Lockdowns and social distancing measures during the COVID-19 pandemic drastically changed traditional travel patterns97,98, with shifts such as remote work and online shopping significantly affecting transport demand. Public transport, for instance, faced a trust crisis, prompting a shift towards private vehicles or alternative methods. At the end of the main path (see Fig. 6), we observed that research on post-pandemic travel behavior modeling has gradually gained attention80,92, yet gaps in understanding the underlying travel mechanisms persist. Meanwhile, although most studies in the reviewed papers focus on urban passenger transport, the impact of post-pandemic changes in travel behavior on freight logistics cannot be underestimated. Within the identified research topic of Management and Optimization (red cluster, Topic 1 in Fig. 3), a core research objective is to employ advanced optimization algorithms to enhance intracity and intercity freight transportation networks. With the rise of e-commerce, increasing reliance on online shopping for door-to-door delivery of daily goods has placed greater demands on logistics efficiency. Therefore, future research should comprehensively examine changes in travel behavior and attitudes from pre- and post-pandemic98, assess the impacts of socio-economic, psychological, and environmental factors on these behaviors, and uncover the governing mechanisms and scaling laws in travel choice. Such studies will enhance the accuracy of individual and population travel prediction models, potentially mitigating the need for broad non-pharmaceutical interventions (e.g., indiscriminately closing public spaces, and banning all commercial activities) that stifle economic development. Additionally, adapting these models to other scenarios99, such as natural disasters and policy interventions (e.g., adoption of new technology), could provide insights into handling uncertainties within the transport system and foster a more flexible and efficient sustainable transport framework. Building on an understanding of travel patterns and demand, further research could focus on utilizing sensor-collected freight location data to optimize transport routes and predict warehouse storage needs, thereby reducing transportation and storage costs. Additionally, integrating electric delivery methods—such as drones and autonomous robots—into freight transport network modeling could improve last-mile delivery, reduce energy consumption, and enhance overall delivery efficiency.
-
b.
X-minute accessibility: The X-minute accessibility concept strives to create community units where residents can access essential services (e.g., workplaces, shops, and medical facilities) within a designated number of minutes by walking or cycling100. This approach not only aims to reduce carbon emissions from longer commutes but also improves life quality and community cohesion, emerging as a significant research area recently81,82 (see the blue cluster in Fig. 3, and see Fig. 6a). However, many studies49,50 tend to optimize urban layouts and infrastructure solely based on travel time, often neglecting alignment with actual travel preferences, which can lead to planning schemes that do not meet real-world needs. Additionally, focusing solely on accessibility can inadvertently lead to increased urban residential segregation101. Thus, it is vital to balance enhanced accessibility with fostering social interactions across diverse socio-economic groups, promoting an inclusive and sustainable transport system. In addressing these challenges, solutions that improve active-mobility, such as safe walking and cycling infrastructure, should be prioritized within the accessibility framework. This involves integrating designated pedestrian and cycling routes within urban spaces to promote physical activity, reduce dependence on motor vehicles, and foster greater community interactions. Complementing these efforts, public transport accessibility should be streamlined to serve as an efficient and sustainable alternative, linking community units to broader urban areas and ensuring an inclusive network that benefits all demographics. Moreover, achieving a sustainable and accessible transport system requires an interdisciplinary approach, synthesizing insights from urban planning, traffic engineering, economics, and social sciences. On the one hand, applying transport data analytics in collaboration with urban planning principles can help create layouts that balance accessibility with actual behavioral patterns and preferences, leading to more responsive and flexible urban designs. On the other hand, understanding the socio-economic impact of accessibility through economic and social science research enables planners to anticipate unintended segregation effects, fostering an equitable urban environment. Future research should focus on integrating these interdisciplinary perspectives into accessible design frameworks, combining innovative technologies16,46, such as shared mobility and multimodal networks, to provide residents with diverse and adaptable travel options that meet the demands of evolving urban landscapes.
-
c.
Resilient transport network: While highly interconnected urban transport systems offer significant convenience, they are also vulnerable to external shocks like diseases and extreme weather, which can lead to regional paralysis and systematic failure. Therefore, enhancing the resilience of these networks is vital for the advancement of SMT, a subfield that is garnering growing attention from researchers80 (see red and blue clusters in Fig. 3). Current research primarily employs “4Rs” — robustness, redundancy, resourcefulness, and rapidity — to assess the network resilience102. Nonetheless, there is a pressing need to improve resilience indicators, especially by incorporating social factors (e.g., public travel behavior, and emergency response capability) and considering the compounded effects of multiple disasters. Moreover, resilience modeling should expand beyond single-city network optimization to include collaborative improvements across regional transport systems103, especially focusing on connections and emergency linkages between large city aggregations. Meanwhile, addressing the heterogeneity of regional transportation networks and varying travel behaviors presents a significant challenge. For instance, transport systems’ operation modes and residents’ travel patterns can differ markedly between cities27, necessitating nuanced approaches in modeling and policy development. Additionally, leveraging emerging technologies like autonomous driving28 and vehicle communication technology104 to enhance the adaptability of transportation networks and optimize resource distribution represents a promising future research direction.
-
d.
Personalized demand-responsive transport: DRT is a flexible public transport service without fixed routes, operating based on passenger demand and serving areas with dispersed demand where conventional public transit is economically unfeasible80. In practice, DRT struggles with low operational efficiency and poor service quality due to dispersed demand distribution105. Towards the end of GSMP, Campisi et al.80. highlighted that DRT continued to be a favored option in the post-pandemic era. Previous research primarily focuses on areas such as matching and scheduling in DRT systems, demand prediction and modeling, and route planning106. However, studies on accessibility, service quality, and personalization remain insufficient. Future research should optimize fleet management, employ diverse fleets to adapt to demand fluctuations across different time and areas, and cater to various passenger demographics. Additionally, introducing dynamic pricing for different travel origins and destinations, along with automated DRT (ADRT)107 holds promise for reducing operational costs. Enhancing service quality is essential, especially ensuring the well-being of vulnerable groups like the elderly. A practical approach would involve quantifying the reliability of access points during route planning and prioritizing areas predominantly inhabited by special user groups.
-
e.
Emerging mobility technologies: Recent advances in mobility technologies and low-altitude economy have greatly broadened the prospects for sustainable transport28,29,30,31. Although research topics such as “smart city” and “emerging shared mobility” are attracting increased attention, their impact in the SMT field is limited (see Topics 6 and 7 in Fig. 3b), and they have not yet appeared on the main paths of knowledge diffusion (see Fig. 5). This suggests that these areas are nascent and face numerous challenges. For instance, while autonomous vehicles (AVs) seek to replace traditional human-driven vehicles (HVs) and enhance transport systems through platform-managed carpooling fleets16, increasing user acceptance of AVs and adapting AVs to HVs driving habits to prevent collisions in mixed AV-HV scenarios remains a substantial hurdle. Studying human driver behaviors from a neurological perspective and deciphering the mechanisms of human-machine interaction and decision-making could offer viable solutions108,109. Additionally, the growing popularity of electric vertical takeoff and landing aircraft introduces new prospects for urban air transport110. Yet, issues such as low-altitude airspace management, real-time communication, and user acceptance still need substantial resolution111. Future research should consider focusing on grid-based airspace management, establishing grid coordinate systems, and developing precise methods for airspace representation and calculation.
Overall, this paper offers policymakers, researchers, and practitioners an academic landscape in the SMT field. It aids policymakers in formulating aligned strategies, enables scholars to grasp research frontiers quickly, and supports practitioners in driving technological innovation. However, this review has limitations. For instance, our analysis primarily relies on the WoS Core Collection database. While this database objectively and accurately represents the field’s knowledge structure, it inevitably overlooks crucial publications that significantly influence the field’s development, such as white papers. Therefore, future research should incorporate additional data sources and publication types to gain a more comprehensive understanding, ensuring a thorough coverage of all impactful knowledge and information in the SMT field. In addition, while the bibliometric approach gains valuable insights into publication trends, co-authorship patterns, and topic clusters within SMT, it also has limitations that merit consideration. Bibliometric analysis often emphasizes the quantitative characteristics of literature, making it challenging to describe underlying reasons for observed phenomena. Therefore, content analysis of the relevant literature and expert insights should be incorporated to overcome this limitation. Additionally, newly published studies require time to accumulate sufficient citations and impacts, which may lead to underestimating emerging fields or new technologies. Conducting bibliometric analysis over a short period may not accurately reflect the latest research trends. In future research, more effective network measurement and bibliometric analysis methods will be explored.
Methods
Dataset
The publication data used were collected from the WoS Core Collection database. WoS is one of the most widely used and comprehensive literature databases112, encompassing over 24,000 influential journals across various fields113, ensuring the reliability of the data source for this study. We conducted a literature search by establishing a theme-based retrieval strategy with specific criteria as follows:
Topic: (TS = (“Transport* System*” OR “Mobility System*”) AND TS = (“Sustainab*”)) OR (TS = (“Transport* Sustainab*” OR “Mobility Sustainab*” OR “Sustainab* Transport*” OR “Sustainab* Mobility”))
Citation index: Science Citation Index Expanded (SCI-EXPANDED), Social Sciences Citation Index (SSCI), Arts & Humanities Citation Index (AHCI), Conference Proceedings Citation Index–Science (CPCI-S), Conference Proceedings Citation Index – Social Science and Humanities (CPCI-SSH), and Emerging Sources Citation Index (ESCI)
Document type: Article OR Proceedings paper
Language: English
where ‘TS’ denotes topic-based search. ‘*’ signifies a wildcard for fuzzy searching. Following the literature search, we retrieved 9026 publications, each containing fields such as title, abstract, keywords, author information, and references. However, due to database retrieval tool limitations, publications inevitably included irrelevant literature related to SMT. For example, publications on developing biological and chemical materials, which might indirectly relate to new energy vehicles, were outside our study’s scope. Therefore, we manually screened titles and abstracts to filter out irrelevant publications. Ultimately, we identified 7710 publications, comprising 5418 articles, 2044 proceedings papers, and 248 publications categorized as both articles and proceedings papers.
Topic evolution modeling
Assume a keyword co-occurrence network with (N) keywords extracted from (M) publications spanning (Y) years, covering (K) distinct research topics. In this study, we proposed a new method to quantify each topic’s relative importance and track its evolution trend over the years, consisting of the following three steps.
Normalizing keyword co-occurrence: For topic (k) and its constituent keywords, as shown in Eq. (1), the co-occurrence value ({O}_{i}) of each keyword is divided by the sum of co-occurrence of all keywords within the topic. This yields the relative importance of each keyword within the topic:
where ({bar{O}}_{i}) is the normalized co-occurrence value, and ({N}_{k}) represents the number of keywords within topic (kin {mathrm{1,2},ldots ,K}).
Matching publication and topic: We construct publication-topic matrix ({bf{P}}in {R}^{Ytimes Mtimes K}) to represent the probability of each publication belonging to the different topics. Let ({{mathbb{M}}}_{y}) denote the collection of all publications published in the (y)-th year. For the (m)-th publication ({p}_{m}) in ({{mathbb{M}}}_{y}), we first identified the keywords belonging to topic (k), and then computed a weighted sum of the occurrences of these keywords within the publication ({p}_{m}). The weight assigned to each keyword is its relative importance ({bar{O}}_{i}). As shown in Eq. (2), the weighted sum serves as the score representing the affiliation of publication ({p}_{m}) to topic (k):
where ({s}_{y,m,k}) represents the score of the publication ({p}_{m}) published in year (y) belonging to topic (k). ({N}_{k}) denotes the number of keywords contained in topic (k). ({Count}({{key}}_{i},{p}_{m}^{y})) represents whether the keyword ({{key}}_{i}) appears in publication ({p}_{m}^{y}) (including author keywords, and keywords Plus). Compared to a keyword that appears only in either the author keywords list or the keywords plus list, a keyword ({ke}{y}_{i}) that appears in both lists indicates a stronger content association between the ({p}_{m}) and ({ke}{y}_{i}). Further, as shown in Eq. (3), the scores are normalized to obtain the probability of a publication belonging to a certain topic:
Topic evolution trend: Based on the constructed publication-topic matrix ({bf{P}}), we calculate the sum of the probabilities for all publications in a year, and then standardize the value to characterize the popularity of the research topic in that year. Finally, as shown in Eqs. (4–5), we obtain the evolution trends of different research topics over (Y) year (see Fig. 3b for details).


Responses