The putative error prone polymerase REV1 mediates DNA damage and drug resistance in Candida albicans

Introduction
Fungal infections pose a major threat to human health and are responsible for 150 million life-threatening infections and 1.5 million annual deaths1. Fungi are ubiquitous pathogens, responsible for a broad range of diseases, from common skin and mucosal infections to life-threatening invasive mycoses, which pose a distinct threat among people with underlying conditions or immunodeficiencies, including transplant and cancer patients. Global rates of fungal infections have been increasing as people belonging to vulnerable risk groups increase, and as climate change continues to influence the spread and emergence of fungal pathogens1,2,3,4,5. Amongst these fungal pathogens, Candida species are the leading cause of invasive infections6 and the fourth most common cause of hospital-acquired bloodstream infections7. The opportunistic pathogen Candida albicans is the predominant cause of candidiasis diseases, although non-albicans Candida pathogens represent a growing proportion of clinically isolated species8,9,10, which are characterized by high rates of antifungal drug resistance9,11.
Treatment for fungal infections, including C. albicans infections, is difficult due to an overall paucity of effective antifungal therapies, despite the growing importance of fungal infections. A major challenge in identifying novel antifungal therapies is the occurrence of off-target effects and host toxicity due to the conserved eukaryotic biology of human hosts and fungi12. In addition to this, antifungal drug resistance has been identified as a major threat to human health, as C. albicans and other Candida pathogens are increasingly identified with reduced susceptibility to antifungal agents11. Currently, three major classes of antifungal therapies are clinically available for the treatment of C. albicans infections: polyenes, azoles, and echinocandins12. The most recently discovered class of antifungal drugs is the echinocandins, considered the first-line therapy for invasive candidiasis13. Echinocandins exhibit fungicidal activity against Candida pathogens and target the fungal cell wall by inhibiting ß-(1,3)-D-glucan synthase (encoded by FKS1/2), an enzyme critical to cell wall synthesis14. In this class, the most commonly used drug against Candida infections is caspofungin14. Resistance to echinocandin antifungals has been increasingly found amongst fungal clinical isolates, particularly Nakaseomyces (Candida) glabrata and Candida auris strains15. The limited number of antifungal therapies, and the rising global threat that fungal pathogens pose to human health, highlight a need for robust characterization of antifungal drug resistance evolution in fungal pathogens.
For bacterial species, treatment with antimicrobial agents has been shown to play a role in DNA damage, mutagenesis, and the subsequent development of drug resistance16,17,18,19,20. Antibiotics can induce DNA damage in bacteria either directly, as is the case with fluoroquinolones21,22, or more indirectly by promoting the production of cellular reactive oxygen species (ROS)23,24,25. Cellular stress responses become upregulated upon treatment with such antibiotics, including the DNA damage-induced SOS response, which induces the expression of error-prone DNA translesion polymerases to manage the DNA damage16,18,19,26,27,28,29,30. These polymerases have reduced fidelity compared to replicative polymerases, therefore accelerating the introduction of mutations into the genome, which in turn provides more mutational variation that may confer resistance to antibiotics16,18,19,29,30. In fungal pathogens, there is evidence that similar to antibiotics, antifungal agents are capable of inducing ROS production and DNA damage31,32,33. Further, in C. albicans, antifungal agents can increase the frequency of genetic alterations in fungi, including point mutations34 and loss of heterozygosity (LOH)35.
Despite evidence for antifungal-induced DNA damage and mutagenesis in fungi, the role of error-prone polymerases in this process has not been investigated in fungal pathogens. However, in the model yeast Saccharomyces cerevisiae, the role of error-prone polymerases has been well described36. In S. cerevisiae, translesion synthesis (TLS) is mediated by three main error-prone TLS polymerases: Rev1, Polζ (consisting of Rev3 and Rev7 subunits), and Polη (Rad30)37. These TLS polymerases are broadly characterized by their ability to replicate damaged DNA via TLS, whereby a DNA lesion is bypassed by the incorporation of a nucleotide opposite the lesion37. While many DNA lesions cannot be used as a template by stringent replicative polymerases, TLS polymerases are able to use damaged DNA as a template37. Compared with replicative polymerases, which exploit rigorous proofreading activity and have extremely low error rates (~1 incorrect nucleotide per 106-108 bases), the error-prone TLS polymerases lack 3’-to-5’ proofreading activity and have very high error rates (~1 incorrect nucleotide per 101-104 bases)37,38. Rev1 and Polζ often act in concert39,40 and in S. cerevisiae, the Rev1/Polζ complex is a central regulator of translesion synthesis, introducing errors in both damaged and undamaged DNA, and is considered to be responsible for a majority of all mutations in this yeast39,41,42. Deletion of REV1 in S. cerevisiae renders cells highly susceptible to DNA damage and decreases the frequency at which mutations are acquired43,44,45. In C. albicans, however, the role of Rev1 and other error-prone TLS polymerases has not been closely investigated.
Here, we characterize the role of the putative TLS polymerase Rev1 in the fungal pathogen C. albicans, and investigate the role of Rev1 in mutagenesis. We confirm and quantify C. albicans DNA damage in the presence of antifungal drugs, and further find that numerous predicted error-prone polymerases (and related factors) are upregulated in the presence of DNA-damaging agents, including antifungal drugs. We further focus on REV1, which when deleted, leads to an increased mutation frequency (in opposition to what is observed in S. cerevisiae43,44,45), and a corresponding increase in evolved resistance to the antifungal drug caspofungin. Deletion of REV1 also causes a higher abundance of the protein Shm1, which is also involved in the C. albicans mutation frequency. Together this work characterizes new factors involved in DNA damage and mutagenesis in C. albicans.
Results
Antifungal drugs induce DNA double-strand breaks in C. albicans
To assess the role of TLS polymerases on antifungal-induced mutagenesis in C. albicans, we first sought to assess and quantify DNA damage induced in fungal cells upon treatment with antifungal agents. For this, we exploited a C. albicans strain that we previously generated containing a GAM-GFP construct to visualize and quantify DNA damage46. Gam is a viral protein that binds irreversibly to DNA double-strand breaks (DSBs), and fluorescent labeling of Gam can effectively visualize and quantify DNA damage in the form of DSBs in live microbial cells, including C. albicans46,47. The Gam-GFP system we used here is under the control of the tetON tetracycline-inducible promoter, such that the presence of tetracycline or its derivative doxycycline, leads to the production of the Gam-GFP protein.
We treated GAM-GFP expressing C. albicans cells with antifungals fluconazole or caspofungin and included treatment with hydrogen peroxide (H2O2) as a control for induction of DNA DSBs. We co-stained cells with the nuclear stain DAPI and used co-localization of GFP and DAPI to quantify DSBs. We found that both H2O2 and the antifungals produced a strong GFP signal, compared to the untreated control. The antifungal-treated cells appeared to have a stronger GFP signal (Fig. 1A), which may be due to the relative concentrations of drugs and H2O2 to which the cells were exposed. While doxycycline has been demonstrated to interfere with fluconazole activity48, we did not find that this disrupted our ability to assess Gam-GFP upon antifungal treatment. To quantify GFP as a marker of DSBs, we monitored co-localization between GFP and DAPI-stained nuclei. We found a significant increase in GFP co-localization with the DAPI-stained nuclei in the cells treated with each antifungal, as well as H2O2, compared to the untreated cells (P < 0.0001 for each condition, Fig. 1A, B), indicating that both azole and echinocandin antifungals are capable of inducing DNA damage in the form of DSBs in C. albicans.

A Fluorescent microscopy depicts DAPI-stained nuclei, GAM-GFP signal, co-localization of DAPI and GFP, and bright field (BF) images. B Quantification of fluorescence microscopy displayed as a colocalization coefficient. A two-way ANOVA test was conducted and error bars represent SEM. P < 0.0001 (****).
Genes encoding C. albicans TLS polymerases are upregulated in response to antifungal drugs and DNA-damaging agents
Following confirmation that treatment with antifungal drugs results in DNA DSBs, we next sought to determine whether C. albicans genes encoding putative TLS polymerases (and related factors) were upregulated under these stress treatment conditions. As our goal was to focus on a small subset of TLS polymerases and related factors, we used reverse transcriptase quantitative PCR (RT-qPCR) to measure gene expression in C. albicans that had been exposed to the antifungal caspofungin or methyl methanesulfonate (MMS) as a DNA-damaging alkylating agent. We monitored the expression of six target genes, chosen based on known orthologs of TLS polymerases and associated factors in S. cerevisiae: REV1, REV3, RAD32, RAD5, RAD6, and REV7. Upon treatment with MMS, most of the tested genes (REV1, REV3, RAD5, RAD6, and REV7) showed an increase in expression (~1.5 – 4 fold) with increasing concentrations of MMS compared with the untreated control (P = 0.00128, 0.00083, 0.00095, 0.00013, 0.0124 at higher MMS concentration, respectively; Fig. 2A). Upon treatment with the caspofungin, REV1 and REV3 were significantly increased in expression (~1.5–2 fold) relative to the untreated control (P = 0.048, 0.032, respectively, Welch’s t-test), with REV1 having the highest fold change in this condition (Fig. 2B). Interestingly, RAD32 had significantly decreased expression in the presence of caspofungin (P = 0.021), which was also previously observed upon fluconazole treatment (although translational efficiency of this transcript is increased upon fluconazole treatment)48. Together, this suggests that several putative C. albicans TLS polymerases and associated factors are upregulated in the presence of DNA-damaging agents, including MMS and the antifungal caspofungin, and further reinforces our finding of caspofungin as a DNA-damaging agent.
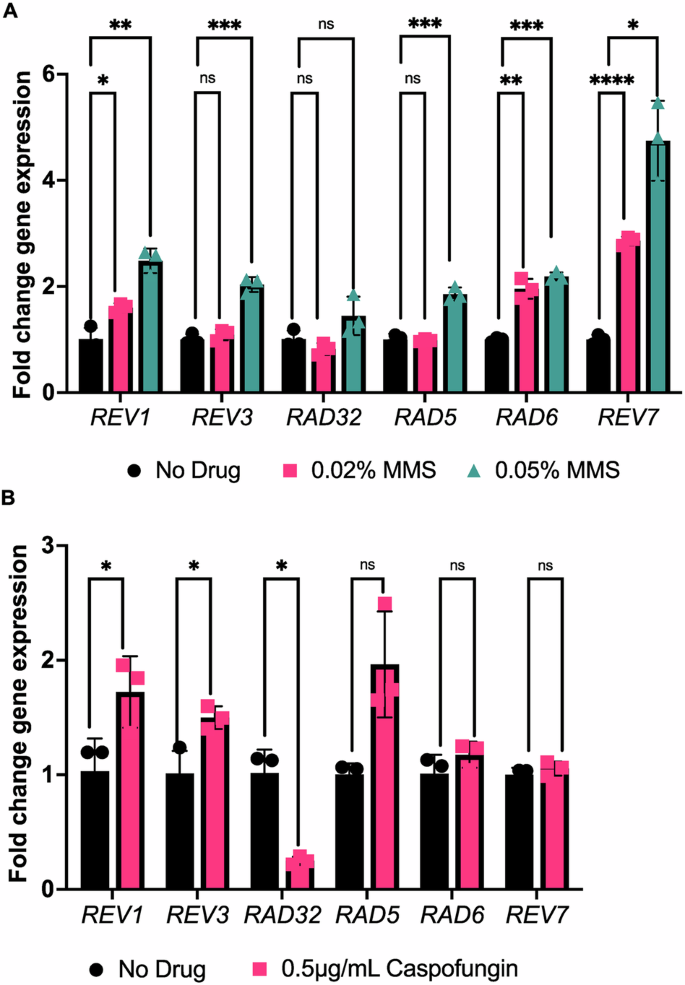
A RT-qCR results for putative TLS polymerases in response to MMS treatment. Error bars represent SEM. B RT-qCR results for putative TLS polymerases in response to caspofungin treatment. A Welch’s t-test was conducted. P values for the significant pairwise comparisons are as follows: P < 0.05 (*), P < 0.01 (**), P < 0.001 (***), P < 0.0001 (****), ns not significant, P > 0.05.
REV1 is required for tolerance to DNA-damaging agents
Based on this observed upregulation of REV1 in DNA-damaging conditions in C. albicans, and the known importance of REV1 in S. cerevisiae DNA damage response and TLS43,44,45, we decided to perform follow-up analyses on REV1 specifically. First, we sought to determine whether REV1 played a role in C. albicans’ DNA damage response using the well-established DNA-damaging agent, MMS. We generated a mutant strain deleted for the REV1 gene using a CRISPR deletion strategy49 and monitored its sensitivity to the DNA-damaging agent MMS compared to a wild-type control strain. The rev1∆/∆ homozygous deletion strain grew similar to the wild-type strain on rich media (Fig. 3), but was severely impaired in growth in the presence of MMS (~5 fold more sensitive than the wild-type strain, P < 0.0001; Fig. 3), suggesting that similar to S. cerevisiae, REV1 is essential for tolerance to DNA damage. To further confirm this observed phenotype, we independently knocked out REV1 in a different C. albicans strain background and reconstituted the wild-type REV1 gene back into this mutant strain. We monitored growth on rich media and MMS for both the wild-type, rev1∆/∆ deletion, and rev1∆/∆::REV1 reconstituted strains, and confirmed MMS sensitivity upon deletion of REV1, which was restored upon reintroduction of the REV1 gene (Supplementary Fig. 1).
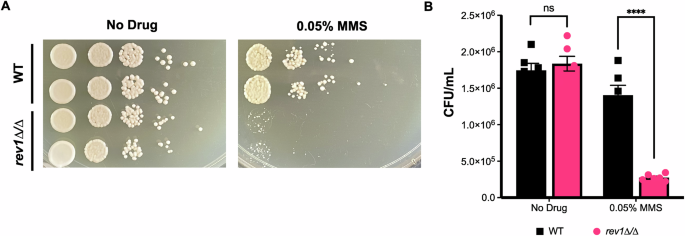
A REV1 deletion mutant and wild-type strains were grown in the presence of MMS and spotted on YPD. B Quantification of MMS spot plates. An unpaired t-test was conducted. P < 0.0001 (****), ns not significant, P > 0.05.
Deletion of REV1 increases the mutation frequency in C. albicans
Following confirmation of REV1’s role in the response to DNA damage, we next sought to determine its role in C. albicans mutation frequency, since work in S. cerevisiae indicates that deletion of REV1 leads to a decreased mutation frequency43,44,45. To assess the frequency at which genetic alterations are occurring in C. albicans, we used a 5-fluoroorotic acid (5-FOA) fluctuation test. The 5-FOA assay is a well-established protocol50 used to estimate mutation frequency based on the frequency at which the URA3 gene becomes mutated and inactivated as a share of the total cell population. URA3 mutation and inactivation allows cells to grow in the presence of 5-FOA, as URA3 encodes the enzyme for decarboxylation of 5-FOA to 5-fluorouracil, which is a toxic metabolite50. For this assay, we tested the rev1∆/∆ mutant strain and a wild-type control strain, both constructed in a heterozygous URA3/ura3∆ background, to facilitate the ability to detect inactivating mutations in a single URA3 allele. When these strains were grown and plated on 5-FOA media, the rev1∆/∆ mutant strain produced significantly more 5-FOA resistant colonies as a share of the total cell population, indicating a relatively higher frequency of URA3 mutation (~5-fold higher mutation frequency, P < 0.0001; Fig. 4). We further confirmed this finding in the rev1∆/∆ mutant and corresponding REV1 constituted strain (Supplementary Figure 2). This suggests that mutation of URA3 is occurring at a higher frequency in the absence of REV1, which is contrary to the trend that is observed in S. cerevisiae, where deletion of REV1 leads to a decrease in URA3 mutation frequency43,44,45,51. It is possible that differences in genetic redundancy between these species may allow for differences in replication errors, leading to altered mutation frequency.
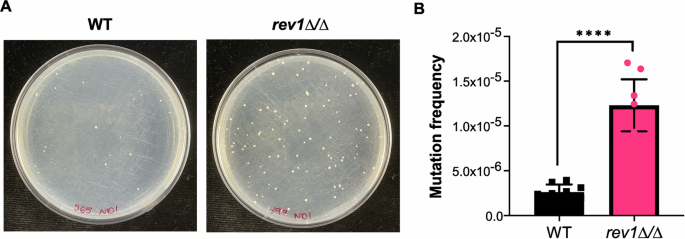
A Plate images depict wild-type and rev1Δ mutant strains on 5-FOA agar. B Quantified mutation frequency based on the number of 5-FOA colonies as a fraction of total number of cells plated. Data represents three independently-performed replicate assays, with three independent platings per experiment. An unpaired t-test was conducted, P < 0.0001 (****).
Deletion of REV1 enables a more rapid evolution of resistance to caspofungin
The increased frequency of URA3 mutation seen in response to the deletion of REV1 motivated us to explore whether this increase might affect the rate at which antifungal resistance mutations are acquired, and thus the frequency with which antifungal resistance ultimately evolves. We used a laboratory experimental evolution protocol to monitor how quickly the rev1∆/∆ mutant evolved resistance to a sublethal concentration of the antifungal caspofungin compared to the wild-type strain (Supplementary Fig. 3A). Eight isolated colonies for each strain were serially passaged in both the presence or absence of caspofungin, plated on agar plates of rich media containing or lacking caspofungin, and the growth was assessed. We found that the rev1∆/∆ mutant and wild-type strains grew similarly after passaging in the absence of the drug: passaged rev1∆/∆ mutant and wild-type strains grew similarly well when plated on rich media, and were similarly unable to grow when plated on media containing caspofungin (Fig. 5A; left panel). When evolved in the presence of caspofungin, both rev1∆/∆ mutant and wild-type strains grew similarly when plated on rich media, but the rev1∆/∆ mutant strain grew much more robustly than the wild-type strain when plated on caspofungin-containing media (Fig. 5A; right panel). This trend of the more rapid evolution of resistance to caspofungin was mostly consistent amongst seven of the eight unique passaged isolates of rev1∆/∆ mutants. Further, this more rapid evolution of resistance to caspofungin was reproducible across three distinct experimental evolution assays (Supplementary Fig. 3B). This suggests that the rev1∆/∆ strain evolved caspofungin resistance more readily than the wild-type strain upon passaging in the presence of this antifungal, and this increase in resistance is consistent with our findings in the 5-FOA assay, which found that the rev1∆/∆ mutant had an increased frequency of mutagenesis.
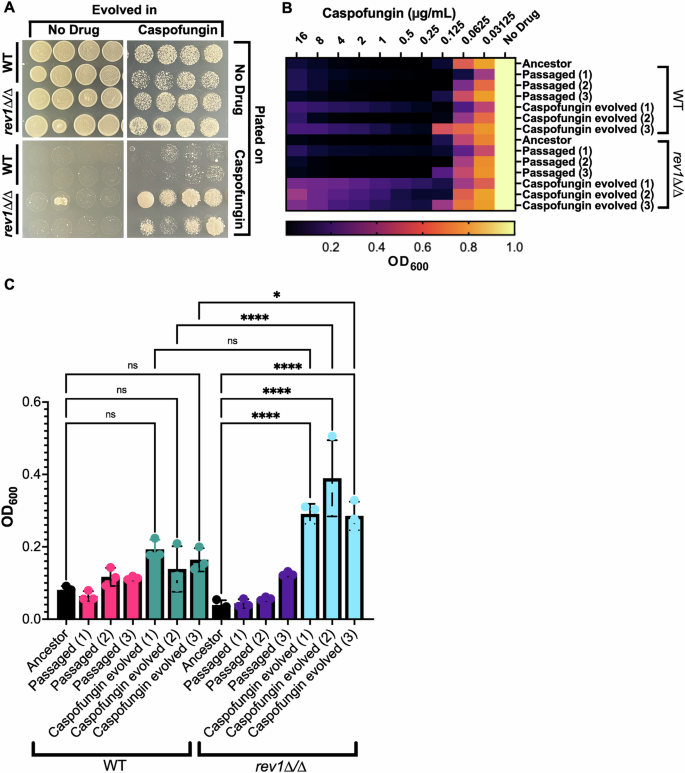
A Plate images depict a comparison between the wild-type and rev1Δ/∆ mutant strains when evolved and plated in the presence and absence of caspofungin. B Heat map depicting evolved wild-type and rev1Δ/∆ mutant isolates exposed to a concentration gradient of caspofungin. C Optical density of each isolate at the highest concentration of caspofungin. Pairwise comparisons were made between the unevolved and evolved isolates within each strain and between the evolved isolates of both strains. A one-way ANOVA test was conducted. (*) P = 0.0494, P < 0.0001 (****), ns not significant, P > 0.05.
Next, we sought to characterize and further quantify the caspofungin resistance seen in the rev1∆/∆ mutant by performing minimum inhibitory concentration (MIC) assays on individual colonies from these passaged and evolved strains to determine their level of antifungal resistance. We monitored resistance across three single-colony isolates for the passaged strains compared to an unevolved strain. We found that the unevolved isolates of both rev1∆/∆ and wild-type strains showed similar susceptibility to caspofungin, and the rev1∆/∆ and wild-type colonies passaged in the absence of the drug also showed similar susceptibility (Fig. 5B, C). When comparing the isolates that were evolved in caspofungin, we found that the rev1∆/∆ mutant strain colonies were capable of growing at higher concentrations of caspofungin, and grew to ~1.5–2 fold higher OD600 at the highest doses of drug (Fig. 5B, C), suggesting decreased susceptibility to this antifungal across evolved rev1∆/∆ isolates. This restoration of growth at higher drug concentrations is reminiscent of the ‘paradoxical effect’ that is sometimes observed at higher concentrations of caspofungin52, and may be due to upregulation of stress response pathways at higher drug concentrations53,54.
Deletion of REV1 results in a significant decrease in the abundance of Shm1
Given the unexpected finding that the C. albicans rev1∆/∆ strain more rapidly acquired mutations compared with a wild-type strain, we wanted to assess if this phenotype might be associated with regulatory changes in the rev1∆/∆ mutant. Thus, we performed proteomics analysis on the rev1∆/∆ mutant strain compared with the wild-type or REV1 reconstituted strain in order to gain a more global understanding of what factors may be modulated in response to the deletion of REV1. Approximately ~2,500 proteins were identified in each sample, and only two proteins were found to be significantly modulated in both the comparison between the rev1∆/∆ mutant and reconstituted strain, and between the rev1∆/∆ mutant and wild-type strain (Fig. 6A, Supplementary Fig. 4, Supplementary Table 1). Rck2, a putative serine/threonine protein kinase55, demonstrated a modest increase in abundance (log2 fold change ~1) in the rev1∆/∆ mutant compared to both the reconstituted and wild-type strains and Shm1, a serine hydroxymethyltransferase56, had a very clear signature of a significant decrease in abundance (log2 fold change ~3; Fig. 6A, Supplementary Fig. 4, Supplementary Table 1).
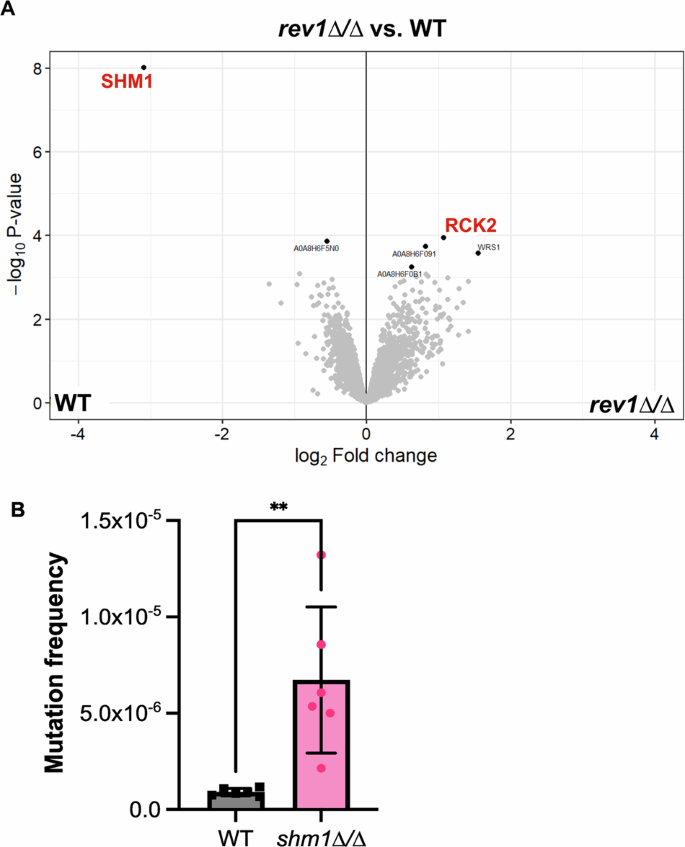
A Volcano plot of all proteins identified via proteomic analysis of WT, rev1∆/∆ strains. Red lettering shows the downregulated protein CaJ7.0385 (Shm1) and the upregulated protein Rck2. B Quantified mutation frequency based on the number of 5-FOA colonies as a fraction of total number of cells plated. An unpaired t-test was conducted. Data represents three independently-performed replicate assays, with two independent platings per experiment. An unpaired t-test was conducted, P < 0.005 (**).
Deletion of SHM1 results in an increased frequency of mutation
Based on the finding of Shm1 being significantly depleted in abundance upon deletion of REV1, we next sought to characterize Shm1 in C. albicans. SHM1 encodes a predicted serine hydroxymethyltransferase involved in glycine metabolism56, but to date has not been robustly characterized in C. albicans. To determine whether SHM1 is involved in an increased mutation frequency, similar to the rev1∆/∆ strain, we deleted SHM1 in C. albicans using CRISPR techniques and monitored the mutation frequency via 5-FOA assays. Similar to what we observed in the rev1∆/∆ deletion mutation, deletion of SHM1 similarly results in an increased mutation frequency (~8 fold increased mutation frequency, P = 0.0037; Fig. 6B). This suggests that similar to Rev1, Shm1 — itself downregulated upon deletion of REV1 — also plays a role in the mutation frequency of C. albicans. In S. cerevisiae, SHM1 has an annotated role in genome stability and chromosome/plasmid maintenance57. If this role is conserved in C. albicans, this might provide insight into the increase in mutation frequency observed in the C. albicans shm1∆/∆ deletion mutation.
Discussion
Here, we investigate the role of error-prone polymerases in DNA damage and antifungal drug resistance in the fungal pathogen C. albicans. We confirm that antifungal agents such as fluconazole and caspofungin can induce DNA double-strand breaks, and find that several predicted error-prone polymerases and related factors were upregulated in these DNA-damaging conditions. Following up on the putative error-prone polymerase REV1, we find that deletion of this gene results in sensitivity to DNA damage, and, unexpectedly, increased mutation frequency, resulting in more rapid evolution of resistance to antifungal drugs. We performed proteomics analysis as a means to assess the mechanism underpinning REV1-mediated mutagenesis and drug resistance and identified a previously uncharacterized factor, SHM1, which, when deleted in C. albicans, similarly results in an increased mutation frequency. Together, this work describes the importance of previously uncharacterized factors in C. albicans’ DNA damage response pathway, mutagenesis, and drug resistance.
In bacterial species, error-prone polymerases are known to become upregulated under conditions of DNA damage to prevent cell cycle arrest20,58. Here, we find that putative error-prone polymerases are similarly upregulated in C. albicans in response to DNA-damaging conditions. While this phenomenon had not previously been investigated in C. albicans, previous research in S. cerevisiae highlighted the role of REV1 as an essential component of the translesion DNA synthesis pathway, whose expression is induced in the presence of DNA damage59. Further, research in S. cerevisiae indicates that the deletion of REV1 results in increased sensitivity to MMS, UV radiation, and oxidative stress45,60. Given its role in error-prone DNA synthesis, the absence of REV1 in S. cerevisiae also confers a decreased mutation frequency61. In agreement with what was seen in S. cerevisiae, we saw a significant sensitivity to treatment with MMS upon deletion of the REV1 ortholog in C. albicans, yet, surprisingly, and in contrast to the trend observed in S. cerevisiae, we found an increase in mutation frequency in the rev1∆/∆ mutant compared with a wild-type strain. This suggests that REV1 may have a function in C. albicans which differs from that in S. cerevisiae, and led us to question what may be occurring in the absence of the gene that might be causing this observed increased mutation frequency phenotype. One limitation of this work is that we have not characterized the nature of the mutations that occur in C. albicans rev1∆/∆, which may differ between C. albicans and S. cerevisiae.
While we do not know for certain why the deletion of REV1 leads to an increased mutation frequency in C. albicans (as opposed to a relative decrease in mutation frequency in S. cerevisiae), some reasons might explain this phenomenon. Firstly, polymerases such as Rev1 are typically involved in translesion synthesis, allowing DNA replication to continue past damaged sites, and if these TLS polymerases are deleted, the replicative polymerases might skip these damaged sites or induce more errors while attempting to replicate past the damage, resulting in a higher mutation frequency. Further, deletion of error-prone polymerases may lead to genetic instability as the high-fidelity polymerases might not be as effective at bypassing DNA lesions or secondary structures, leading to increased incidence of double-strand breaks or other forms of genetic instability that would elevate the mutation frequency. It is also possible that the cellular mechanisms that compensate for the loss of error-prone polymerases might themselves be more error-prone or less efficient, resulting in an overall increase in the mutation frequency. The degree of genetic redundancy (i.e. the presence of multiple polymerases with overlapping functions) likely varies among yeast species, and S. cerevisiae and C. albicans are separated by a whole-genome duplication event62, which has likely led to more functional redundancy in S. cerevisiae. Such organisms with higher redundancy might better compensate for the loss of an error-prone polymerase without an increase in replication errors, potentially leading to a relatively decreased mutation frequency. C. albicans and S. cerevisiae strains may also differ in their ploidy, with C. albicans being almost exclusively diploid, and S. cerevisiae strains being haploid or diploid, which may also play a role in how the organisms respond to DNA damage and the absence of TLS polymerases.
In order to understand what was occurring on a cellular systems level upon deletion of REV1 in C. albicans, and to help explain the increased mutation frequencies and more rapid evolution of caspofungin resistance, we performed proteomic analysis on the rev1Δ/∆ mutant, REV1 reconstituted strain, and wild-type strain of C. albicans, and found two proteins were significantly modulated in the mutant compared with wild-type or reconstitute strain. Of these two proteins, one, Shm1, was of particular interest as its homolog in S. cerevisiae plays a role in chromosome and plasmid maintenance57, and genome stability is known to play an important role in antifungal drug resistance63,64,65,66,67,68. Thus the downregulation of the Shm1 protein, putatively involved in chromosome maintenance, may be an example of genomic instability that is induced upon the deletion of REV1, leading to an increased mutation frequency and more rapid acquisition of antifungal drug resistance. More research will be required to characterize the role of Shm1 in this phenomenon, and further, additional RNA sequencing experiments may reveal additional factors that are differentially transcriptionally regulated in the rev1∆/∆ strain.
While Rev1 and other putative error-prone polymerases have remained largely uncharacterized in C. albicans, other DNA damage repair factors have well-established roles in the response to antifungal drugs. Previous work in C. albicans has demonstrated that deletion of genes involved in double-strand break repair (including MRE11 and RAD50) leads to an increase in genome instability, and increased susceptibility to the antifungal fluconazole69. Deletion of RAD50 and RAD52 has also been demonstrated to lead to a significant decrease in the fungicidal activity of antifungal agents31, and perturbation of factors involved in DNA damage repair in the fungal pathogen Cryptococcus neoformans leads to increased susceptibility to certain antifungal agents70. Conversely, deletion of genes involved in mismatch repair (MSH2 and PMS1) leads to more rapid acquisition of drug resistance69, similar to what we observed upon deletion of REV1 and SHM1. Strains of Nakaseomyces glabrata carrying mutations in MSH2 also exhibit a higher likelihood of breakthrough antifungal treatment in vitro and in vivo, highlighting the role of mismatch repair in influencing antifungal drug susceptibility71. While our work uncovered an unexpected phenotype of increased mutation frequency and evolution of drug resistance upon deletion of REV1 (in S. cerevisiae, deletion of the ortholog leads to decreased mutation frequency61), previous work has shown significant transcriptional rewiring of the DNA damage response between S. cerevisiae and the closely-related pathogen N. glabrata72, suggesting that our findings may reflect similar rewiring in C. albicans.
Methods
Strains, media and growth conditions
C. albicans cells were grown at 37 °C in Yeast Peptone Dextrose (YPD) broth and YPD plates supplemented with 250 µg/mL nourseothricin (NAT) for plasmid selection. Escherichia coli DH5α cells were grown at 37 °C in Lysogeny Broth (LB) and LB plates supplemented with 100 mg/mL ampicillin (AMP) and 250 µg/mL nourseothricin (NAT) for plasmid selection. The C. albicans parental strain used to generate the mutant strains in this study was SN15273, and the Gam-GFP C. albicans strain was previously described46. Strains, plasmids, and oligonucleotide primers used for plasmid/strain validation are described in Supplementary Table 2.
Fungal strain generation
The deletion strains were generated using the CRISPR-based gene drive platform, as previously described49,74. CRISPR gene drive plasmid was constructed using an existing plasmid backbone and a synthesized gene block (Integrated DNA Technologies) specific to the target gene. The existing plasmid backbone and the synthesized gene block were ligated using Gibson Assembly75. The ligated plasmid was transformed into DH5α cells and cells were plated on LB plates containing ampicillin for plasmid selection. The plasmid was then purified using the GeneJet Plasmid Miniprep Kit (Thermo Scientific). Following the PCR confirmation of each plasmid, the gene drive plasmid was then digested with PacI and transformed into a diploid C. albicans strain using regions of homology upstream and downstream of the target gene, ensuring the complete integration of the gene drive and the deletion of the target gene. Integration of the gene drive in place of each target gene was confirmed via PCR.
As the CRISPR generated plasmids contain a NATR cassette, and additional rev1∆/∆ deletion strain was generated that lacked the NATR cassette, to facilitate reconstitution of REV1. Briefly, the NAT flipper cassette76 was PCR amplified for deletion of REV1 using primers containing homology mapping upstream of the start codon and downstream of the stop codon of REV1 (oRS34/oRS35). The resultant PCR product containing the NAT flipper with homology to REV1 was transformed into C. albicans and NAT-resistant transformants were selected. NAT resistant colonies were PCR tested for proper integration and the NAT flipper was removed following growth in YNB-BSA. The same process was repeated to delete the second allele of REV1.
To reconstitute REV1, we generated two plasmids with a NAT resistance marker and a NEUT5L integration site. One plasmid was used as the empty backbone control plasmid (pRS919, see Supplementary Table 2), and the plasmid contained the REV1 ORF amplified from C. albicans genomic DNA, including ~500 bp upstream of the start codon to capture the promoter (pRS918, see Supplementary Table 2). The pRS918 reconstitution plasmid was transformed in to a rev1∆/∆ strain, while the control plasmid, pRS919, was transformed in to both the wild-type and rev1∆/∆ strains, so that all three strains (WT, rev1∆/∆, and rev1∆/∆+REV1) would be marker matched at contain the NAT resistance cassette.
C. albicans transformation
Plasmids were transformed into C. albicans via a chemical transformation strategy, as previously described in detail49,77. Miniprepped plasmids were linearized via restriction digest mix using the PacI enzyme. A transformation master mix containing 800 µl of 50% polyethylene glycol (PEG 3350), 100 µl of 10X Tris-EDTA (TE) buffer solution, 100 µl of 1 M lithium acetate (LiAc), 40 µl of 10 mg/mL salmon sperm DNA, and 20 µl of 1 M dithiothreitol (DTT) was added to C. albicans culture and plasmid DNA and incubated at 30°C for 1 h, then heat-shocked at 42 °C for 45 min. Cells were washed with YPD and grown in fresh YPD for 4 h. Transformed cells were plated on YPD media containing 250 µg/mL NAT, and grown at 30 °C for 2 days.
Microscopy
The C. albicans strain containing the GAM-GFP construct46 was cultured overnight in 5 mL YPD shaking at 30 °C. Two overnights were set for each condition tested, and 100 µg/mL doxycycline (DOX) was added to half of the cultures to induce expression of GAM-GFP, and strains were grown for 14 h. 5 mL YPD was included as a ‘no growth’ control. Following overnight growth, 20 mM H2O2, 0.5 µg/mL caspofungin, or 100 µg/mL fluconazole were added to the appropriate overnight cultures. The cultures were incubated by shaking at 30 °C for an additional 4 h. Following the incubation, 500 µL of each culture was transferred to a 1.5 mL microcentrifuge tube and centrifuged at 12,000 × g for 10 min, after which the supernatant was discarded. The pellet was resuspended in 1 mL of 15 µg/mL DAPI stain. The resuspended pellets were then incubated in the dark at room temperature for 30 min. 2 µL of the cell suspension was pipetted onto a microscope slide and visualized via confocal laser scanning microscopy (Leica TCS SP5) at 63× magnification.
Leica Application Suite X (LAS X) Life Science Microscope Software Platform and Volocity image analysis software were used for image analysis and quantification. Using Volocity, we monitored co-localization of the DAPI and GFP channels. We used the Volocity software to draw a region of interest in order to analyze one cell at a time. We analyzed ~100 cells per condition (range: 84–141 cells). We set thresholds for what was considered a positive fluorescence signal in each channel using Costes’ method for automatic thresholding78, and used Mander’s Overlap Coefficient (MOC)79 as a direct measure of co-localization that is independent of signal proportionality to measure co-occurrence of GFP and DAPI80.
RNA extraction and reverse transcription quantitative PCR
C. albicans strains were cultured overnight in 5 mL YPD shaking at 30 °C. OD600 of each culture was measured and subcultured in fresh media to a concentration of OD600 = 0.05 and grown for approximately 2–3 h until OD600 of 0.2. Once the desired OD600 was achieved, cells were then exposed to 0.01% MMS, 0.02% MMS, or 0.5 µg/mL caspofungin. The cells were grown in the presence of the respective drugs for 1–2 h. The cultures were then pelleted and frozen at −80 °C. RNA was extracted using the RNeasy Mini Kit from Qiagen. Samples were then processed at the Advanced Analysis Centre at the University of Guelph for reverse transcription and real-time quantitative PCR. An RNA ScreenTape assay was performed on all the samples using TapeStation 4150 to assess RNA integrity (Agilent Technologies). cDNA was synthesized using 1000 ng of the RNA sample and was performed using a High-Capacity cDNA Reverse-Transcription kit from (Applied BioSystems). This was done by creating a reaction mixture of 10X reverse-transcription buffer, 25X dNTPs at a concentration of 100 mM, random primers, MultiScribe Reverse Transcriptase, nuclease-free water, and 1 µg of the RNA sample. The reverse transcription reaction conditions were as follows: 10 min at 25 °C, 120 min at 37 °C, and 5 min at 85 °C. QuantStudio 7 Pro Real-Time PCR system (Thermo Fisher Scientific) was used to conduct the real-time PCR assays. The reaction mixture was comprised of 2X SsoAdvanced Universal Inhibitor-Tolerant SYBR supermix (Bio-Rad), forward and reverse primers each at 5 µM, nuclease-free water, and cDNA. The cycle conditions were as follows: 3 min at 98 °C polymerase activation step, 40 cycles of a two-step qPCR (10 s of 98 °C denaturation, 30 seconds of 60 °C combined annealing and extension). Expression levels were calculated and assessed according to the comparative CT method79. The expression levels of each gene of interest were compared to the housekeeping gene ACT181. The ΔCT values in the samples treated with MMS or caspofungin were compared to the ‘no drug’ samples to obtain ΔΔCT and fold change in expression values79. All graphs and statistical analysis were performed using GraphPad Prism v.9.4.1.
MMS serial dilution spot assay
C. albicans strains were cultured overnight in 5 mL YPD shaking at 30 °C. OD600 of each culture was measured and subcultured in fresh media to a concentration of 0.05 and grown for approximately 2–3 h until OD600 of 0.2. Once the desired OD600 was achieved, the culture was divided into two tubes, with 0.05% methyl methanesulfonate (MMS) added to one culture, and no drug added to the second culture. The strains were grown for an additional hour. A 10-fold serial dilution was performed in 1X Phosphate Buffered Saline (PBS) across six columns in a 96-well plate, including a control column containing only 1X PBS, and plated onto YPD agar. The plates were incubated for 16–24 h static at 30 °C. The resulting colonies were then counted using the spot dilution where individual colonies (~10–20) could be readily counted. The final CFU/mL in the original sample was determined by taking the enumerated colonies and multiplying by the reciprocal of the dilution factor and the volume plated: CFU/mL = (number of colonies)/(volume plated in mL) ×1/(dilution factor). Each assay was performed in three independent replicate assays, with duplicate or triplicate dilutions plated for each individual run.
5-FOA fluctuation assay
5-FOA media was made combining 1 g 5-fluoroorotic acid, 6 mL of uridine (100X stock solution; 1.6 g in 200 mL water), and 500 mL water. These were heated to 50 °C to dissolve the components, then filter sterilized and combined with 500 mL of autoclaved yeast nitrogen base (YNB) agar media containing 6.7 g YNB (without amino acids and with ammonium sulfate), 20 g glucose, 15 g agar, and 0.77 g amino acid ‘Complete Supplement Mixture without Uracil’ (CSM-URA). Filter sterilized components and autoclaved agar media were combined and poured into Petri dishes to generate 5-FOA plates. The desired C. albicans strains were cultured overnight in 5 mL YPD shaking at 30 °C. OD600 of each culture was measured and the strains were subcultured in fresh media to a concentration of 0.05 and grown for approximately 2–3 h until OD600 of 0.2 and grown for an additional two hours. Following the incubation, the OD600 of each culture was measured and the cells were subsequently centrifuged at 5000 rpm for 10 min. The supernatant was discarded and the OD600 values were adjusted to the same value in 1X PBS. 100 µL of the cell suspension was plated in triplicate for each condition onto 5-fluoroorotic acid (5-FOA) agar plates. The plates were then incubated for 24–48 h, static at 30 °C. The resulting 5-FOA colonies were then counted. An additional aliquot of cells from the same cell suspension was simultaneously plated on non-selective YPD agar plates to enumerate total CFU in the population. A 10-fold serial dilution was performed in 1X PBS across six columns in a 96-well plate, and plated onto YPD agar. The plates were incubated for 16–24 h static at 30 °C. The resulting colonies were then counted using the spot dilution where individual colonies (~10–20) could be readily counted. The final CFU/mL in the original sample was determined by taking the enumerated colonies and multiplying by the reciprocal of the dilution factor and the volume plated. The mutation frequency (μ) was calculated based on the formula: μ = Nm/Nt, where Nm is the number of mutants (colonies on 5-FOA plates) and Nt is the total number of viable cells (CFU calculation on non-selective YPD agar).
Experimental evolution
Experimental evolution experiments were adapted from previously described protocols82. The desired C. albicans strains were removed from glycerol stocks stored at −80 °C, and plated for isolated colonies on YPD agar. 8 isolated colonies for each strain were then cultured overnight in 5 mL YPD shaking at 30 °C. OD600 of each culture was measured and OD600 values were adjusted to 0.05 in 1 mL fresh YPD. 100 µL of the diluted cells were added to 900 µL casitone, supplemented with 100 µg/mL streptomycin (to prevent bacterial contamination) in a 96-well deep-well plate. Each colony was cultured in duplicate in the 96-well deep-well plate, with half being cultured in casitone supplemented with 100 µg/mL streptomycin, and the other half being cultured in casitone, streptomycin and 0.25 µg/mL caspofungin. Following inoculation, the 96-well plate was covered with a BreatheEasy membrane, wrapped in aluminum foil, and incubated statically at 30 °C for 7 days. Following the incubation period, 100 µL of each culture was removed to create glycerol stocks. 5 µL of the evolved culture was plated on a casitone agar plate, and a casitone agar plate supplemented with 0.25 µg/mL caspofungin. The plates were grown static at 30 °C for 16–24 h and the resulting colonies were analyzed. The remaining culture was passaged three times: the deep-well plate was centrifuged at 1500 rpm for 2 min, the supernatant was removed and the resulting pellets were resuspended in fresh casitone, streptomycin, and caspofungin. These plates were then incubated for an additional 7 days at 30 °C. This passaging process was repeated three times, and at each passage the culture was archived in glycerol and plated on plates with and without caspofungin, as described above.
Antifungal minimum inhibitory concentration assays
This protocol was adapted from previously described minimum inhibitory concentration (MIC) assays83,84. The caspofungin MIC assays were performed in flat-bottom 96-well plates. A solution of 32 µg/mL caspofungin was prepared in YPD, of which 100 µL was added to the first column of the 96-well plate. A two-fold serial dilution was performed across the columns creating a gradient of caspofungin ranging from 16 µg/mL to 0 µg/mL. The desired evolved isolates were cultured overnight in 5 mL YPD shaking at 30 °C. OD600 of each culture was measured and the cultures were diluted to an OD600 of 0.1 in fresh YPD. The diluted culture was mixed into the plates in equal volumes creating a starting cell concentration of OD600 = 0.05 for each strain. Following the serial dilution of caspofungin and the addition of the culture, the final volume in each well is 200 µL. The plates were then incubated statically at 37 °C for 48 h, after which the optical density (OD600) was measured using the Infinite 200 PRO microplate reader (Tecan).
Proteome extraction
The protocol for protein extraction was adapted from previously described protocols85. C. albicans strains were cultured overnight in 5 mL YPD. The following day, cell pellets were collected, washed and exposed to a protease inhibitor. The cells were then lysed using a probe sonicator and 20% sodium dodecyl sulfate (SDS) was added to the samples for a final concentration of 2% SDS. Next,1 µL of 1 M dithiothreitol (DTT) per 100 µL of the sample was added for a final concentration of 10 mM DTT. The samples were then incubated at 95 °C for 10 min with shaking at 800 rpm. Next, the samples were cooled to room temperature and 1 µL iodoacetamide (IAA) was added per 10 µL of sample for a final concentration of 55 mM IAA. Following a 20-min incubation at room temperature, 100% ice-cold acetone was added to each sample and samples were stored at −20 °C overnight. The following day, the samples were centrifuged to pellet the precipitate, which was then washed in 80% ice-cold acetone. The pellet was then left to air dry. The pellet was re-solubilized in 100 µL 8 M urea/40 mM HEPES. The amount of protein in each sample was then quantified using a Bovine Serum Albumin (BSA) standard curve.
Proteomics sample preparation and data acquisition and analysis
C. albicans cell lysate samples were processed using an on-filter digestion protocol using trypsin (Pierce) and S-Trap mini spin columns (Protifi), according to manufacturer’s protocol. The digested samples were concentrated to near-dryness (1–5 μl) using a vacuum centrifuge then labeled with TMT 10plex isobaric labels (Thermo Fisher Scientific) as per the manufacture’s protocol, and the labeled samples were mixed one-to-one.
TMT mixed samples were fractionated into 12 fractions by high pH C18 reversed-phase liquid chromatography using an Agilent 1260 Infinity liquid chromatography system (Agilent Technologies). Each sample was separately analyzed using a nano-flow Easy nLC 1200 connected in-line to an Orbitrap Fusion Lumos mass spectrometer with a nano-electrospray ion source at 2.3 kV (Thermo Fisher Scientific) with a FAIMS Pro attached. The peptide samples were loaded onto a C18-reversed phase Easy Spray column (50 cm long, 75 µm inner diameter, 2 µm particles, (Thermo Fisher Scientific) with 100% buffer A (2% acetonitrile, 0.1% formic acid), and then separated on the same column. Peptides were eluted using linear gradients from 3 to 39% buffer B (80% acetonitrile, 0.1% formic acid) over 120 min. With wash, the total gradient time was 135 min at a constant flow rate of 200 nl/min.
Raw mass spectrometry data was searched using the Sequest search engine within Proteome Discoverer version 2.5 (Thermo Scientific) against a C. albicans (NCBI taxonomy ID: 5476) database from Uniprot. All data processing, including differential expression analysis, was performed using the Bioconductor package DEP86. Variance stabilizing normalization was performed as per the ‘vsn_package‘, then data was imputed by assuming “missing not at random” (MNAR) by taking random draws from a Gaussian distribution centered around a minimal value. Volcano plots were generated after differential expression analysis using the ‘plot_volcano‘ function within the DEP package.

Responses