The radiogenomic and spatiogenomic landscapes of glioblastoma and their relationship to oncogenic drivers
Introduction
Most cancers harbor diverse tumor subpopulations with variable genetic and epigenetic properties, resulting in spatial and molecular intratumoral heterogeneity. Malignant brain tumor progression and heterogeneity may be driven by the selection of specific cancer stem cells (CSCs) over time, influenced by their genetic, epigenetic and tumor microenvironment (TME) interactions1,2,3,4. CSCs may leave the tumor bed, acquire additional mutations, and contribute to tumor progression in distant areas. Within the TME, some CSCs grow and populate in highly vascular, nutrition-sufficient regions, while others adapt to hypoxic, nutrition-depleted) environments5. This co-existence of diverse subpopulations and their adaptation to environmental forces creates a robust tumor landscape resistant to standard treatments. Consequently, therapies that fail to eliminate tumor stem cells are unlikely to be effective in eradicating the tumor. The diversity across the tumor landscape, as reflected in radiographic phenotypes, allows tumor cells to adapt and influences their clinical behavior and response to therapy.
Glioblastoma (GBM), as defined by the 2021 WHO central nervous system (CNS) tumor classification, is the most common primary malignant brain tumor in adults, with a grim prognosis6,7. GBM cells extensively infiltrate brain parenchyma, making surgical cure unachievable even with maximal safe resection and adjuvant chemoradiotherapy8,9. Furthermore, GBM comprises a robust evolutionary ecosystem with multiple genetically distinct clonal populations, resulting in intratumor heterogeneity10,11. Standard treatment (Stupp protocol12), i.e., surgical resection followed by chemoradiotherapy with temozolomide (TMZ), may select resistant subclones from the residual tumor, leading to rapid tumor regrowth and treatment failure10,11,13.
Advances in high-throughput sequencing enable the mapping of genomic alterations and driver mutations, providing opportunities for clinical trial enrollment or development of personalized therapies beyond the standard-of-care14. However, sequencing is generally performed on a small portion of the tumor, which may not reflect the full tumor’s heterogeneous characteristics15,16. Multiple mutations can be detected in a single specimen of a sequenced tumor. However, it remains challenging to identify primary driver genes responsible for the global radiographic phenotype, as mutations are unevenly distributed across the tumor. Furthermore, sequencing outcomes depend on the assay type, coverage depth, library comprehensiveness, and analysis techniques, complicating the development of standardized pipelines for multi-institutional clinical trials17.
Machine learning (ML)-based radiogenomic analyses of multiparametric MRIs (mpMRI) offer a promising noninvasive approach to explore tumor genomics, spatial heterogeneity, and sampling bias18,19. This study investigates how GBM molecular heterogeneity impacts imaging features through radiogenomics, spatiogenomics (relationship between spatial location patterns of tumor occurrence to mutational composition) and the cross-sectionally estimated molecular evolutionary landscapes. We generate radiogenomic signatures from computational analyses of mpMRI scans to predict alterations in driver genes or core signaling pathways using a targeted sequencing panel. These signatures provide insights into TME properties, such as neoangiogenesis, cellularity, hypoxia, and infiltration, serving as surrogate in vivo biomarkers for de novo (primary, i.e., Grade 4 tumor at diagnosis) IDH-wildtype GBM. We hypothesize that tumors with simpler genomic landscapes exhibit more distinctive radiogenomic signatures than heterogenous tumors and that spatial patterns of tumor locations correlate with molecular signatures or sequence of events, driven by cells of origin and local TME. Additionally, we explore imaging phenotypes associated with tumor clonal evolution.
ML analysis of mpMRI scans identifies distinctive in vivo imaging signatures associated with key driver mutations, including EGFR, PTEN, NF1, and TP53, and their associated pathways in GBM, with more pronounced differentiation in homogeneous tumors harboring a mutation in one of these key driver genes or pathways. These imaging signatures offer insights into how various mutations influence tumor phenotype as quantified by imaging features. Additionally, the spatial distribution of tumors varies based on their molecular characteristics. Finally, distinct imaging and spatial characteristics are associated with cross-sectionally estimated evolutionary trajectories of the tumors.
Methods
Study cohort
This retrospective HIPAA-compliant study was approved by the IRB of the University of Pennsylvania (IRB protocol 706564). All patients provided their informed consent at the time of imaging. A retrospective cohort of n = 585 patients with GBM tumors who had undergone surgery at the Hospital of the University of Pennsylvania (HUP) between 2006 to 2019 was reviewed. The patients who had undergone maximal safe or partial resection, were histopathologically confirmed with de novo glioblastoma tumors, received radiotherapy, and concomitant and adjuvant chemotherapy with temozolomide, and at the very least had four conventional MRI scans, including pre- and post-gadolinium T1-weighted (T1, and T1-Gd), T2-weighted (T2), and T2 fluid attenuation inversion recovery (T2-FLAIR), acquired pre-operatively on a 3 T MRI scanner (Siemens, Tim Trio, Erlangen, Germany) for a first-occurrence brain tumor were included. A cohort of 374 patients meeting the inclusion criteria was collected. Of these, 244 had additional advanced MRI sequences available, including diffusion tensor imaging (DTI) and dynamic susceptibility contrast (DSC) MRI with preload administration. All measurements described below were conducted on separate samples and patients.
Next generation sequencing (NGS)
Given that our imaging data and tissue samples were from patients diagnosed between 2006–2019, we reclassified the cohort based on our molecular data. We retrospectively sequenced all tissue samples included in this study using the NGS panels described below. This sequencing ensured that the majority of the included subjects met the definition of GBM according to the 2021 WHO classification of tumors of the central nervous system20.
NGS panel 1
Sequencing was performed for n = 183 subjects using an in-house research NGS panel. A custom AmpliSeq sequencing panel was designed to target the coding sequence of 45 genes and 4 additional mutation loci of interest using the Ion AmpliSeq Designer portal (ThermoFisher, https://ampliseq.com/). The design consists of 2130 amplicons covering 206 kbp, with amplicon size range optimized for FFPE DNA (125 –175 bp). Barcoded libraries were prepared from nanogram quantities of FFPE gDNA using the Ion AmpliSeq Library Kit 2.0 (ThermoFisher cat. no. 4480442). Libraries were quantified using the Ion Library TaqMan Quantitation Kit (cat. no. 4468802) eliminating the need for amplification of the final library. Library concentrations were normalized and pooled in equimolar ratios for multiplex sequencing on an Ion Torrent S5 sequencing system using the Ion 540 Kit-OT2 and Ion 540 Chip (cat. nos. A27753 and A27766).
Signal processing and base calling, followed by alignment of sequence reads to the hg19 reference genome, were performed on instrument using Torrent Suite Software version 5.8. Library performance was assessed using the Torrent Suite coverage analysis plugin. Aligned reads in BAM format were uploaded to the cloud-based Ion Reporter Software (ThermoFisher, https://ionreporter.thermofisher.com/) for variant calling using the version 5.10 default single sample somatic variant calling parameters. Ion Reporter analyses were downloaded to facilitate further processing of the resulting VCF files.
Variant calls were normalized, multiallelic sites split, and NOCALL or reference calls removed using BCFtools. Normalized variants were annotated with Annovar then filtered on variant quality metrics and annotations, again with BCFtools. Variants with variant quality score <30, read depth <100, allele frequency <0.05, number of alternate reads <5, strand bias >0.7, as well indels called in a homopolymer greater than 8 bp in length, were removed. Also removed were any variants identified as likely artifacts by (1) low population frequency (gnomAD exome or genome frequency <1%) AND (2) presence in more than 2 of 10 HapMap samples obtained from the Coriell Institute and sequenced by the same means. The 10 control samples include the following DNA sample obtained from the NIGMS Human Genetic Cell Repository at the Coriell Institute for Medical Research: NA12342. Annotation filters retained only exonic and splicing variants with gnomAD exome or genome population frequency less than 1%.
Target genes in this sequencing panel included TP53, PTEN, ATRX, EGFR, VEGF, PDGFRA, PIK3CA, PIK3R1, NF1, PDL1, CTLA4, HIF1A, MDM4, RB1, STAT1, CD70, CIC, FUBP1, CDK4, ACADL, TRIM26, SMAD1, ARID2, CDKN1B, CREBZF, DNMT3A, EPHB2, ERRFI1, FGFR2, GIGYF2, KDR, KRAS, MAP3K1, MET, NIPBL, NOTCH2, NRAS, NTRK1, PTBP1, PTPN11, SETD2, SMARCB1, TP63, WRN. The hotspots included IDH1 p.R132, IDH2 p.R172, BRAF p.V600, H3F3A p.K28, TERT (chr5:1295151-1295315). H3F3A and TERT were excluded, the former was not effectively covered due to presence of pseudogene that was ignored by the variant caller, and the latter had poor amplicon performance.
NGS panel 2
Genetic data was available for n = 191 patients through a clinical sequencing panel of 153 actionable and prognostic genes for solid tumors, implemented and validated at our institution for clinical assessment of the resected tumors. The panel has a full coverage of all included genes with its Agilent Haloplex design. Full description of this panel and the in-house data processing bioinformatics pipeline can be found in the study carried out by Nasrallah et al.21.
Final mutational data
A total of 27 genes in both panels were included for n = 374 subjects and used for our radiogenomic analysis: ARID2, ATRX, BRAF, CDKN2A, CIC, DNMT3A, EGFR, FGFR2, FUBP1, IDH1, IDH2, KDR, KRAS, MDM4, MET, NF1, NOTCH2, NTRK1, PDGFRA, PIK3CA, PIK3R1, PTEN, PTPN11, RB1, SETD2, SMARCB1, TP53. We excluded patients with mutations in IDH1 or IDH2 (n = 16). The histology of the tumors from the remaining patients (n = 357) exhibited grade 4 features, aligning with the current WHO definition of glioblastoma. Among these 357 patients, 290 were aged 54 or older. Of the remaining 68 cases in our cohort, all but 13 (all IDH1/2 wildtype) had mutations in one or more of the following genes: EGFR, NF1, PTEN, RB1, PTPN11, PIK3CA, or PDGFRA, suggesting a high likelihood of consistency with the current biological concept of glioblastoma.
A cohort of n = 357 patients with IDH-wildtype GBM (a summary of demographics, clinical, and genomic characteristics can be found in Supplementary Table 1) was considered for generating the population atlases of spatial locations and generating radiogenomics signatures based on conventional MRI (T1, T1-Gd, T2, and T2-FLAIR) scans, of which a subset of n = 228 patients had advanced imaging scans (DTI and DSC-MRI) along with conventional MRI.
We considered the GBM pathways introduced in the seminal paper by Brennan et al.22, including RTK pathway (with EGFR, PDGFRA, MET, FGFR2 genes), PI3K pathway (including PIK3CA, PIK3R1, PTEN genes), MAPK pathway (NF1, BRAF), P53 pathway (TP53, MDM4), RB1 pathway (CDKN2A, RB1), and ChrMod pathway (ATRX).
Mutational signature analysis
We extracted mutational signatures to explore characteristic molecular underpinnings for the groups of patients with specific spatial predisposition. The analysis was performed in accordance with the method proposed by Alexandrov et al.23. De novo global-signature discovery was performed using sigProfilerExtractor23 with 100 iterations to extract each signature and 96 trinucleotide sequence contexts were included.
Mutant-allele tumor heterogeneity (MATH) score; a measure of molecular heterogeneity
Mutant-Allele Tumor Heterogeneity (MATH) score utilizes bulk NGS data to provide a quantitative measurement of intratumor heterogeneity24. The MATH score is determined by computing the width of the distribution of mutant-allele fractions (MAF) among tumor loci24. In the clonal evolution of the tumor, a locus with earlier mutation has higher MAF and therefore MATH score, while later events result in lower MAF and MATH score24. We imported the clinical data and NGS sequencing results for 183 GBMs. MATH score for each tumor was calculated from the median absolute deviation (MAD) and the median of its mutant-allele fractions at tumor-specific mutated loci according to the following formula24:
Tumor evolutionary trajectories
Analysis of copy number variation
CNVs were called from the Ion Torrent sequence read alignments (BAM files) using CNVkit (version 0.9.9)25. An FFPE CNV baseline was bootstrapped using ten HapMap control samples obtained from Coriell and FFPE tissue derived DNA from 14 lung metastases to the brain, all sequenced with the AmpliSeq panel. The HapMap samples were screened for the absence of CNVs in panel genes in DGV, but an FFPE baseline is desirable to more accurately represent the variability in sequencing coverage expected from the cases. An initial baseline was generated using the HapMap samples, against which the lung metastases were analyzed. The lung metastases were then filtered based on CNV calls to retain 6 samples for which all calls were either single copy gain or loss, and no two samples contained a call in the same gene. These six samples were used to generate an FFPE CNV baseline for analysis of the AmpliSeq cohort.
The case and control sample BAM files were first processed using CNVkit’s ‘batch’ command in ‘targeted amplicon sequencing’ mode with the ‘–drop-low-coverage’ flag, using the UCSC hg19 refFlat.txt file for gene annotation. CNVkit splits the targeted regions into bins and calculates coverage tables for each sample. A pooled copy number reference is generated from the control samples’ coverage tables then used to correct case sample coverage for regional biases and calculate normalized copy number ratios.
CNVkit’s ‘segment’ command uses the ‘circular binary’ method to generate copy number segments from bins. Because the 45 panel genes are sparsely distributed across 18 chromosomes, this approach resulted in segments combining genes separated by large genomic distances. To avoid this behavior bins were instead segmented per gene using the ‘genemetrics’ command. Segments consisting of less than 5 bins were dropped, and a copy number ratio threshold of 0 was used to prevent copy number calls at this stage. Segments were then annotated with additional summary statistics using the ‘segmetrics’ command to support downstream QC and filtering.
Using the ‘call’ command, copy number ratios were adjusted for tumor cellularity and converted to integer copy number values using the ‘threshold’ method. Copy number ratio thresholds of -1 and 0.58 were selected to correspond to strict copy loss and gain respectively26,27. Germline variant allele frequencies were input during the ‘call’ step resulting in output annotated with the average b-allele frequencies of heterozygous SNVs in each segment. Finally, CNVs were filtered using a custom script to remove calls for which the log2 ratio 95% confidence interval contains 0, the balanced case. The specific details about the statistics of copy number variations in the patient population are provided in Supplementary Table 2.
The default for CNVkit is to calculate log2 ratios and copy number with respect to a diploid chrX and haploid chrY, infer sample sex based on chrX and chrY coverage, and double chrX coverage for male samples. Because this panel targets only one gene on chrX and none on chrY, sex inference was not always accurate. Additionally, the ‘genemetrics’ and ‘call’ commands are not typically used in conjunction, and both attempt to determine sex, which can result in unexpected behavior. To address this all samples were treated as female at the ‘genemetrics’ step while sex was explicitly asserted in the ‘call’ command.
Prediction of evolutionary trajectories
The oncoprint function implemented in maftools package28 was used for visualization of somatic mutations and pathway level alterations in the GBM samples. We performed the evolutionary analysis using the CAPRI algorithm implemented in TRONCO23 with its default parameters. Both Akaike and Bayesian information criteria were used for regularization to prevent overfitting. The evolutionary trajectories were drawn using sem-supervised approach to improve clarity and interpretability. We used chordDiagram function implemented in circlize package29 to visualize the co-mutated genes in GBM tumor samples. ggplot2 package30 was used to visualize the allele frequency for all mutate genes. All analysis was conducted in R 3.6.0 (2019-04-26).
Radiogenomic signatures
We trained and evaluated the performances of ML and DL classifiers in predicting mutation status, where the presence of a mutation was assigned a label of 1, and 0 otherwise. Radiogenomic signatures were calculated from the output probabilities of the trained classifiers in predicting the mutation status in each patient.
Image pre-processing
Pre-processing of multi-parametric MRI (mpMRI) scans was performed using the CaPTk software31,32 (https://www.med.upenn.edu/cbica/captk/) with the following steps: (1) conversion of MRI volumes from DICOM to Neuroimaging Informatics Technology Initiative (NIfTI) format; (2) re-orientation to a reference coordinate system (here, left-posterior-superior (LPS)); (3) co-registration and resampling to an isotropic resolution of 1mm3 based on a common anatomical SRI24 atlas33, performed using the Greedy software34; (4) skull-stripping of the MRI volumes using a pretrained DeepMedic algorithm35 available through CaPTk, followed by manual revisions where necessary.
Automatic segmentation of tumorous subregions, i.e., enhancing tumor (ET), nonenhancing tumor core (NC), and peritumoral edema (ED), was applied using DeepMedic followed by manual revisions where necessary. An additional segmentation label, namely the whole tumor, was produced by taking the union of all three subregions (WT = ET + NC + ED). Finally, the image intensities were rescaled in the intensity range of 0-255 after removing outliers.
For radiogenomics signatures, in addition to the structural images described above, quantification of DTI scans was performed to generate maps of axial diffusivity (DTI-AD), trace (DTI-TR), radial diffusivity (DTI-RD), and fractional anisotropy (DTI-FA), and DSC-MRI perfusion scans to create maps of peak height (DSC-PH), percentage of signal recovery (DSC-PSR) after considering leakage correction36,37, and an automatically extracted proxy to relative cerebral blood volume (DSC-rCBV). For DSC-MRI, principal component analysis (PCA) was performed to reduce the dimensionality of perfusion time series to 5 components that represent the temporal dynamics of tissue perfusion. Quantification of perfusion PCA was performed using CaPTk’s Perfusion PCA Parameter Extractor (https://cbica.github.io/CaPTk/PCA_Extraction.html)38. As a result, voxel-wise parametric maps of five PCAs (DSC-PC1, DSC-PC2, DSC-PC3, DSC-PC4, and DSC-PC5) were generated.
Atlases of spatial location
We applied the Glioma Image Segmentation and Registration (GLISTR) software39 to generate population atlases of spatial distributions. GLISTR simultaneously co-registers the structural MRI scans (T1, T1-Gd, T2, T2-FLAIR images) of each patient to the reference atlas, and segments the brain tissue, including tumorous regions of peritumoral edema, enhancing tumor and non-enhancing necrosis core. As a result of applying this method to patient scans, the images and segmentations are warped into a common atlas space, accounting for the mass effect of the tumor.
Radiomic feature extraction
Radiomic feature extraction was performed using the CaPTk software31,32, which offers functionalities to extract a wide array of radiomic features compliant with the Image Biomarker Standardization Initiative (IBSI)40 (see: https://cbica.github.io/CaPTk/tr_FeatureExtraction.html). The masks of tumor segmentations, i.e., ET, NC, ED, and WT were overlaid on each of the MRI scans or the DTI or DSC-derived parametric maps (T1, T1-Gd, T2, T2-FLAIR, DTI-AD, DTI-FA, DTI-RD, DTI-ADC, DSC-rCBV, DSC-PH, DSC-PSR, DSC-PC1 to PC5) to extract radiomic features of shape, volume, intensity, first-order histogram, gray-level co-occurrence matrix (GLCM), gray-level run-length matrix (GLRLM), gray-level size zone matrix (GLSZM), neighborhood gray tone difference matrix (NGTDM), local binary pattern (LBP), and Collage features. The extracted radiomic features were normalized using z-scoring. Furthermore, for each patient, n = 9 loci features were generated by overlaying the tumor core (ET + NC) on nine brain regions, i.e., frontal, temporal, parietal, and occipital lobes, basal ganglia, insula, corpus callosum, cerebellum, and brain stem, and calculating the average probability of the tumor core belonging to each of these regions. For n = 228 subjects that had all the conventional and advanced MRI scans, a total of n = 5,569 features, and for n = 357 subjects that only had conventional MRI scans, n = 2477 features were extracted from multi-parametric MRI scans.
Pairwise correlation was performed on the extracted radiomic features using Pearson’s method and in highly correlated pair of features (r > 0.85), one of the features was eliminated. The following model training methods were carried out in the discovery cohorts for each of the classification scenarios, and the trained model was independently tested on the replication cohorts.
Deep learning-based radiogenomic signatures
In the discovery cohort, the remaining radiomic features were ranked using recursive feature elimination with random forests and the optimal number of features was determined through nested cross-validation (10 folds for the outer and 5 folds for the inner folds). The selected feature subset was imported into the CNN classifier, as described below, for prediction of mutation status in the key driver genes, i.e., EGFR, NF1, PTEN, and TP53, and pathways, i.e., RTK and PI3K.
In the discovery cohort, we trained a CNN classifier based on a modified 34-layer ResNet architecture41, with an initial 7 × 7 convolution and four layers (layers 1 to 4, composed of 3, 4, 6, and 3 residual blocks respectively; each residual block comprises two 3×3 convolution)42. Slices of two structural images, i.e., T1-Gd and T2, along with slices of tumor segmentations (overall three image volumes) were passed as inputs for training the ResNet model. Specifically, the structural images and segmentation masks were cropped with margins of 8 pixels from the boundaries of brain tissue and resampled to 128 × 128 × 128 voxels. Intensity normalization of the brain tissue was performed using z-scoring for all structural MRI scans. Five axial slices were identified from the tumor segmentations, where the axial slice in the center included the maximum tumor mask area; 2 upper and 2 lower slices were also identified along with the center slice. After concatenating all three volumes together, the five slices were finally extracted from this concatenated volume. The discovery cohort was split into 70–30% training-validation sets. The ResNet model was pretrained with input size of 5 × 3 × 128 × 128 × 128 for each subject in the training set (Supplementary Fig 1). After pretraining the ResNet, the weights from the initial 7 × 7 convolution to layer 3 were fed to the CNN classifier and were not used in any further training process. The radiomic features (including spatial location features) were imported as inputs to the fully connected layers that followed layer 4, and along with the weights from layer 4 were used to train the CNN classifier. Input images were further augmented using rotation. Optimization was performed using Adam optimizer (initial learning rate (x0) = 0.0001), with L2 penalty of 0.01, the cross-entropy cost function, and an exponential learning rate decay (xepoch = x0*0.99epoch). For both pretraining and training phases, the maximum training epoch was set to 75, and the model was saved when minimum validation loss was achieved.
Machine learning-based radiogenomic signatures
We also trained classical machine learning models, using support vector machines (SVM), with radiomic features for prediction of mutations in each of the key driver genes and pathways. For the patients in the discovery cohort, feature selection and classifier training were performed using Least Absolute Shrinkage and Selection Operator (LASSO) feature selection approach wrapped with SVM with a linear kernel. This method was applied in a nested cross-validation (nested-CV) schema with 5-fold CV in the inner loop for feature subset selection and with 10-fold CV in the outer loop for model optimization and hyperparameter selection to avoid data overfitting and ensure generalizability to the unseen replication cohort.
Classification scenarios
Radiogenomic signatures of co-occurring mutations in key driver genes, i.e., EGFR, PTEN, TP53, NF1, and key pathways, i.e., RTK, PI3K, P53, and MAPK were generated based on (1) radiomic features extracted from multi-parametric conventional MRI scans using deep learning and SVM classification methods, and (2) the features calculated from multi-parametric conventional and advanced MRI scans using SVM classification.
Histograms of imaging features
Histograms of the most predictive features were generated for the mutant and wildtype tumors for each of classification scenarios, to gain a deeper understanding about the underlying biological processes that follow certain genetic mutations. Histograms indicate the frequency (y-axis) of a feature value (x-axis) based on the data from all patients.
Statistics and reproducibility
In all DL and ML classification scenarios, the data was randomly split using a stratified approach to ensure the proportion of mutated to wildtype tumors was preserved in both the discovery and replication cohorts. The split assigned 75% of the data to the discovery cohort and 25% to an independent (unseen) replication cohort. For the DL and ML models utilizing conventional MRI, the discovery and replication cohorts included 268 and 89 patients, respectively. For the ML model incorporating both conventional and advanced MRI, the discovery and replication cohorts consisted of 171 and 57 patients, respectively. The performance of our predictive ML and DL models in stratifying mutation status was evaluated using the area under the receiver operating characteristic (ROC) curve (AUC) and balanced accuracy metrics. Pairwise correlation of the extracted radiomic features was assessed using Pearson’s correlation coefficient. To analyze the separability of DL and ML signatures, we compared tumors with single alterations (i.e., exclusive tumors) to those with co-occurring multiple alterations using Cohen’s D effect size. Additionally, cosine similarity metrics were calculated to compare molecular signatures across tumor groups stratified by spatiogenomic tumor location, thereby quantifying and validating distinct mutational profiles among these groups. Differences in MATH scores across brain regions were analyzed using the Wilcoxon rank-sum test.
Reporting summary
Further information on research design is available in the Nature Portfolio Reporting Summary linked to this article.
Results
Radiogenomic markers are more distinctive in tumors with single gene/pathway alterations compared to tumors with multiple genes/pathways altered
Radiogenomic signatures were generated using deep learning (DL) and conventional machine learning (ML) models to predict the presence or absence of alterations, which in this analysis refers to point mutations or insertions/deletions, in the key driver genes and their associated pathways (Supplementary Table 1). Throughout this section, for brevity, we will refer to a tumor as mutant/wildtype if it does/does not have alterations in a certain gene or pathway of interest, respectively. For co-occurring radiogenomic signatures, the tumors are considered as mutant/wildtype for a gene or pathway if they do/do not have alterations in a gene/pathway of interest, respectively, regardless of the presence or absence of alterations in other genes or pathways.
The cohorts were divided into discovery and independent replication sets to validate the reproducibility of the generated signatures in unseen data. A summary of diagnostic performance of our predictive models in terms of area under the receiver operating characteristic (ROC) curve (AUC) and balanced accuracy, is provided in Tables 1 and 2. We found high reproducibility of our radiogenomic signatures in independent replication cohorts. DL and support vector machine (SVM) models based only on features computed from conventional MRI scans resulted in comparable distinctive power for most of co-occurring signatures, while the SVM models with features from conventional and advanced MRI achieved better performances (Table 2). This finding highlights the importance of physiological MRI scans, namely diffusion tensor imaging (DTI) and dynamic susceptibility contrast enhanced (DSC-) perfusion MRI, in characterizing the pathophysiological processes that are derived from molecular alterations in the TME43,44.
We postulated that radiogenomic signatures become more distinctive in tumors that have mutations in one of the key driver genes/pathways in their mutational landscape, compared to those with mutations in multiple genes/pathways. To test this hypothesis, the distinction of our generated radiogenomic signatures for single-alteration or exclusive tumors was investigated. For such radiogenomic signatures, in contrast to the multiple-alterations or co-occurring situation, the mutant tumors only had mutations in one gene/pathway of interest, and wildtype tumors had no mutations in any of the genes in the main six pathways (described in the Methods section). The performances of most radiogenomic signatures showed improvement in discrimination of exclusive mutant from wildtype tumors (as indicated in Table 2).
The separability of the signatures for tumors with single alterations, i.e., exclusive tumors, is presented in Fig. 1a–c, as a comparison with the values of the signatures for co-occurring tumors with multiple alterations, along with their Cohen’s D effect sizes. These results show larger effect sizes for discrimination of tumors with and without mutations for the exclusive cases, in contrast with the co-occurring tumors for most of the predictive models. This finding suggests that the imaging signatures become clearer and can differentiate the mutant and wildtype tumors better than the tumors with mixed mutation compositions. However, even in the presence of co-occurring mutations, the imaging signatures carry fairly strong distinctive power, as reflected by the effect sizes.
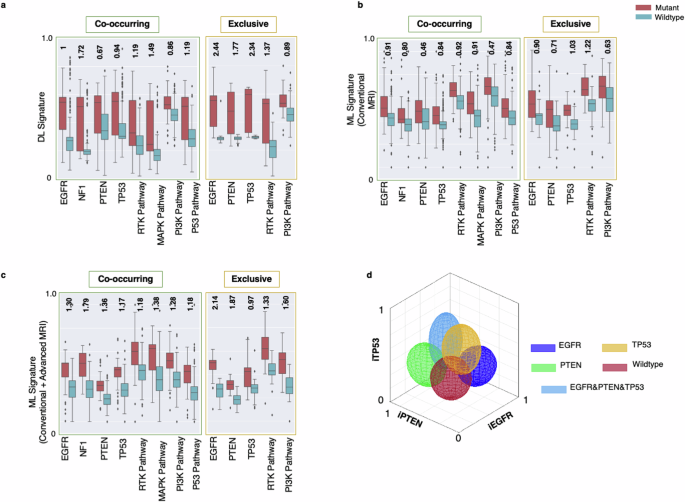
Signatures generated using deep learning (DL; subfigure a; n = 357 independent samples), and conventional machine learning (ML) using only conventional MRI (subfigure b; n = 357 independent samples) as well as using both conventional and advanced MRI (subfigure c; n = 228 independent samples) in mutant (red boxes) and wildtype (blue boxes) tumors. These signatures in Panels (a & c) are shown for co-occurring (left) and exclusive (right) mutations and pathways. The numbers indicated at the top of each pair of mutant-wildtype box-whisker plots indicate the Cohen’s D effect sizes for the signatures generated by DL, ML (conventional MRI), ML (conventional and advanced MRI) models for co-occurring and mutually exclusive tumors. Error bars in the box-and-whisker plots represent the range of the data excluding outliers, with whiskers extending to the smallest and largest values within 1.5 times the interquartile range (IQR) from the lower and upper quartiles. The outliers are represented as individual points outside this range. d A representative example of the degree of expression of imaging signatures, quantitatively measured along respective axes, for mutations in the EGFR (dark blue), PTEN (green), and TP53 (yellow) genes, wildtype tumors (red), and tumors with a combination of EGFR, PTEN, and TP53 mutations (light blue) [iEGFR, iPTEN, and iTP53 = imaging signatures of EGFR, PTEN, and TP53 mutations, respectively]. The colors of the ellipsoids represent the molecularly defined mutation status, and the shape of the ellipsoids reflects the spread of values of respective imaging signatures. For example, molecularly defined EGFR mutant tumors (dark blue) tend to express the iEGFR signature, i.e. they have higher values along the iEGFR axis.
In the histograms presented in Supplementary Fig 2, the imaging characteristics that are most discriminative between tumors that do and do not have mutations in the various genes are summarized. As the results show, EGFR mutant (EGFR(m)) tumors exhibit hypervascularity (increased relative cerebral blood volume (rCBV)) in their enhancing tumor region compared to the tumors without EGFR changes. Mutations in TP53 are associated with altered permeability and vascular leakage (increased percent signal recovery (PSR)) in the enhancing tumor, decreased water concentration (decreased T2), higher cell density (lower apparent diffusion coefficient (ADC)), and higher neovascularization (elevated rCBV) in their peritumoral edema region. The so-called peritumoral edema manifests as a region of high signal intensity on T2-weighted and T2-FLAIR MRI sequences surrounding the enhancing tumor mass and presents a combination of vasogenic edema and infiltrating glioma cells. Tumors with mutations in PTEN show relatively more water concentration (increased T2 signal) and facilitated diffusion (higher ADC) in the non-enhancing tumor region. NF1-mutated tumors have relatively more pronounced vascularization (increased peak height (PH)) and reduced diffusion resulting from higher cellularity (lower ADC) in the non-enhancing tumor region. Furthermore, mutations in NF1 lead to altered permeability and vascular leakage (increased PSR) in the enhancing tumor and higher angiogenesis (increased PH) in the peritumoral edema.
The scatterplots in Fig. 1d illustrate the imaging signatures (denoted by iEGFR, iPTEN, and iTP53) for our ML models created based on conventional and advanced MRI sequences for prediction of mutations in EGFR, PTEN, and TP53 genes. This figure demonstrates the discrimination of tumors for which our sequencing panel identified mutations in a single gene (related to purer molecular landscape) in comparison to tumors with no mutations detected or the tumors with mutations in multiple genes. Radiogenomic signature values for mixed tumors are typically scattered across the plot, whereas values for tumors harboring a single mutation tend to cluster within a specific region. These findings further confirm that tumors with multiple mutations or a more heterogeneous molecular landscape exhibit imaging characteristics that reflect the combined signatures of their co-existing mutations.
Spatiogenomic landscape of IDH-wildtype GBM: spatial distributions are associated with specific molecular mutations and pathways
To test whether spatial location of the tumor is associated with its mutational profile, statistical atlases capturing the probability that a tumor with certain mutation(s) occurs at a particular brain region (see Methods) were generated. Figure 2 depicts spatial maps of the frequency of occurrence of 357 IDH-wildtype GBMs with mutations in each of the key driver genes, i.e., EGFR, PTEN, NF1, and TP53 (Fig. 2a, Supplementary Video 1), as well as their associated signaling pathways, i.e., RTK, PI3K, MAPK, and P53 (Fig. 2c, Supplementary Video 2). Furthermore, we generated atlases of spatial patterns for wildtype tumors, i.e., tumors without any mutations in any of the six main pathways, RTK, PI3K, MAPK, P53, and RB1 pathways, and ChrMod regulation (including chromatin modifier genes, such as ATRX)22. Tumors with mutations in certain genes/pathways or their combinations show predilection for specific brain regions, as demonstrated in the atlases on the right side of panels (A) and (C) in Fig. 2. We found that EGFRm tumors to be more frequent in the left parietal, right temporal, and right occipital lobes, while PTENm cases tend to occur more frequently in the left and right temporal, and right parietal lobes (Fig. 2a, b). TP53m is more likely to occur in the right temporal and right frontal lobes, and NF1m has a predilection for the left frontal lobe (Fig. 2a, b). As the results in Fig. 2(c, d) suggest, subjects with activated RTK pathway are more frequent in the right temporal, left parietal, and left frontal lobes, tumors with mutations in the PI3K pathway tend to occur in the left and right temporal and left frontal lobes, P53 activated pathway subjects are more prominent in the right temporal, right frontal lobes, and right basal ganglionic regions, and MAPK activated tumors are more likely to grow in the left frontal lobe.
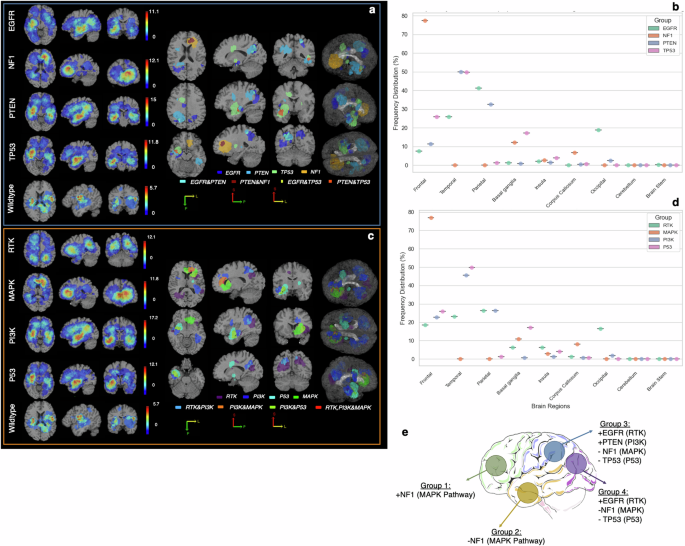
a Spatial maps of frequency of occurrence for the tumors with mutations in key driver genes, including EGFR, NF1, PTEN, and TP53, and (c) their associated signaling pathways, i.e., RTK, MAPK, PI3K, and P53. The spatial map of wildtype tumors, i.e., tumors with no mutations in any of the genes involved in the main six signaling pathways (RTK, MAPK, PI3K, P53, RB1, ChrMod) is also shown. In each of subfigures (a) and (c), the maps on the right side indicate the regions with higher likelihood of occurrence of mutations in a gene/pathway or a combination of genes/pathways. The box plots shown in subfigures (b) and (d) indicate frequency distribution for occurrence of tumors carrying each of the key driver genes/pathways in different brain regions. The basal ganglia label consists of multiple brain regions, i.e., putamen, caudate nucleus, globus pallidus, subthalamic nucleus, nucleus accumbens, internal capsule, and thalamus. All images are displayed in the radiological convention orientation. Subfigure (e) summarizes the findings, illustrating four main groups of regions, towards which the tumors with specific gene mutations show higher predilection.
Based on a population-based approach, four distinct brain regions were derived, representing relatively high prevalence of certain mutations in those regions. A summary of the spatiogenomic markers is provided in Fig. 2e where four main groups of tumor occurrence propensity are specified. To explore characteristic molecular underpinnings for these groups of tumors we extracted mutational signatures (Fig. 3a). We used cosine similarity metric (CM) as a measure of closeness among the four mutational profiles (Fig. 3b). This value ranges from 0 (completely different mutational signatures) to 1 (identical signatures). Mutational signatures were significantly different (CM = 0.35) between Group 1 (frontal lobe) and Group 4 (occipital lobe), which respectively include or lack NF1 (MAPK) mutations. The differences between the spatiogenomic groups were further examined through calculation of MATH (Mutant-Allele Tumor Heterogeneity; See Methods Section) scores, which quantitatively measure intratumor heterogeneity24. During the clonal evolution of a tumor, loci with earlier mutations exhibit higher mutant allele fractions (MAFs) and thus higher MATH scores, whereas loci with later mutations have lower MAFs and MATH scores. Notably, our results show that Group 4 tumors in the occipital lobe, which reflect these early mutation patterns, demonstrated significantly higher MATH scores compared to Group 1 tumors in the frontal lobe (p = 0.013; Supplementary Fig 3). The MATH scores for Group 4 tumors were lower compared to Group 2 and Group 3 tumors located in the temporal and parietal lobes, though this difference did not reach statistical significance (p = 0.05; Supplementary Fig 3).
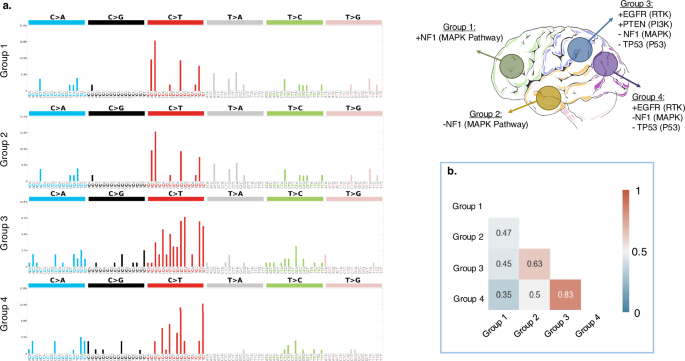
The four groups from Fig. 2e are illustrated on the top right side of this figure. a Mutational signatures; b cosine similarity metric (CSM) for the signatures of the four groups, suggestive of least similarity between tumors in groups 1 and 4. MATH scores for the tumors in these four groups showed significant differences in the mean MATH scores between groups 1 and 4 (p = 0.013).
Molecular underpinnings of primary IDH-wildtype GBM with spatial anatomical predilection
To elucidate the links between tumor progression or evolution with radiographic appearances, 177 samples with available single nucleotide variants (SNVs) and copy number variation (CN) information were analyzed. Only somatic mutations with MAFs of 5% or greater were included. Figure 4 and Supplementary Table 2 depict a summary of common oncogenic mutations, pathway-level alterations, and trajectory evolution model of GBM. The high copy number gains and losses were defined as ≥5 copies and ≤1 copy, respectively.
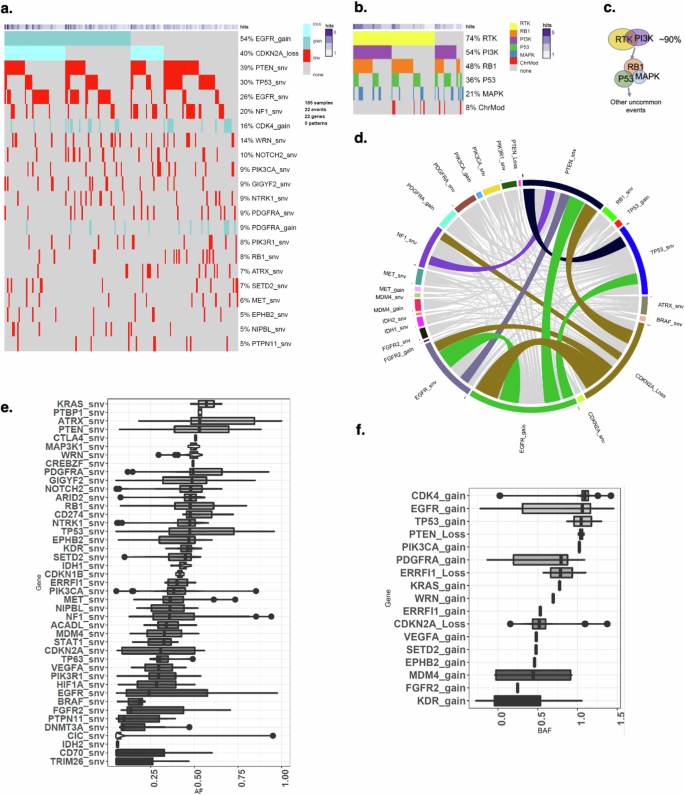
a Heatmap showing the somatic mutations including single nucleotide variant (snv) and copy number changes identified from target exon sequencing of n = 177 independent tumors. Snv, CN deletion and amplification are separately denoted by red, blue and dark blue color. b Heatmap showing the six mutation pathways including 35 mutated genes in 177 tumor samples. The bar graph on the top depicts the number of tumors. c Schematic representation of evolutionary trajectory model of GBM progression that shows the estimated order of events at the pathway level. d Circos plot showing the co-mutated genes shared by tumors; colored connections present co-mutated genes shared by more than 20% of tumors and the grey color connections denote co-mutated genes shared by less than 20% of samples. The width of the connection represents the sample size. e The allele frequency for all sequenced genes, f B allele frequency for genes with CN alterations (gains and losses). Error bars in the box-and-whisker plots represent the range of the data excluding outliers, with whiskers extending to the smallest and largest values within 1.5 times the interquartile range (IQR) from the lower and upper quartiles. The outliers are represented as individual points outside this range.
The oncoplot (Fig. 4a) shows that the most prevalent somatic genomic alterations present in these 177 samples were EGFR CN gain (54%), CDKN2A CN loss (40%) and PTEN somatic mutation (39%). These findings are in line with reports that EGFR amplification and rearrangement are early events in tumorigenesis45. The pathways with the most frequent genomic alterations were receptor tyrosine kinase (RTK, 74%) pathway, which included EGFR, followed by PI3K pathway (54%) which included PTEN, followed by RB1 pathway (48%) including CDKN2A (Fig. 4b). Overall, more than 90% of the tumors have RTK and/or PI3K alterations (Fig. 4b). The circos plot (Fig. 4d) shows that the most co-mutated alterations were EGFR snv – EGFR amplification, EGFR amplification – CDKN2A deletion, and EGFR amplification – PTEN snv.
Next, we examined whether the tumors differ in their order of events of somatic genomic alterations during GBM evolution using a Bayesian inference approach implemented in TRONCO23. In brief, this approach combines techniques for sample stratification, driver selection, and identification of fitness-equivalent exclusive alterations to predict likely temporal order of mutational events during disease progression based on Suppes’s probabilistic causation. The trajectory of GBM progression was inferred based on mutated genes included in the six signaling pathways that were present in more than 10% of all samples. The model captured the early drivers including EGFR amplification, and somatic mutations in NF1, PTEN and TP53 (Supplementary Fig 4). EGFR amplification was accompanied by elevated allele frequency and mutations in PTEN and TP53 also showed higher allele frequencies (Fig. 4e, f ). EGFR point mutations were detectable at a moderately low allele frequency (Fig. 4e).
Next, we postulated that the differences in oncogenic alterations and evolutionary trajectory are manifested in tumor phenotypes, ultimately reflected in radiogenomic features and therefore investigated the evolution patterns for the tumors originating in the distinctive brain regions of Groups 1-4 of Fig. 2. Figure 5 provides the evolutionary trajectories for tumors in the four brain regions shown in the middle (regions of relatively distinct molecular profiles). As suggested by the results, NF1 alterations (100%) were identified as the most frequent and potentially early event in Group 1. In contrast, PTEN mutations (56%), EGFR amplification (56%), and EGFR mutations (44%) were the most common events in Group 2, followed by TP53 (38%) and NOTCH2 (31%) mutations. PTEN mutation and EGFR amplification were the likely early and driver mutations in Group 2 tumors, but it was not possible to ascertain the preferential precedence between those two with statistical significance. In Group 3, PTEN mutations (73%), EGFR amplification (61%), and EGFR mutations (33%) were the most frequent events, and the evolutionary analysis identified PTEN mutation and EGFR amplification as the likely early driver events. In addition, TP53 and CDKN2A mutations were also captured as additional driver mutations. The most frequently occurring alterations in Group 4 were EGFR mutations (86%), EGFR amplification (71%) and GIGY2 mutations (43%). The evolutionary trajectories also indicated the possibility of EGFR and PTEN mutations as early events in the progression of tumor growth, but sample sizes were small and inferences did not reach significance level (p > 0.05). The derived evolutionary trajectories for all the four groups are provided in more detail in (Supplementary Fig 5–8).
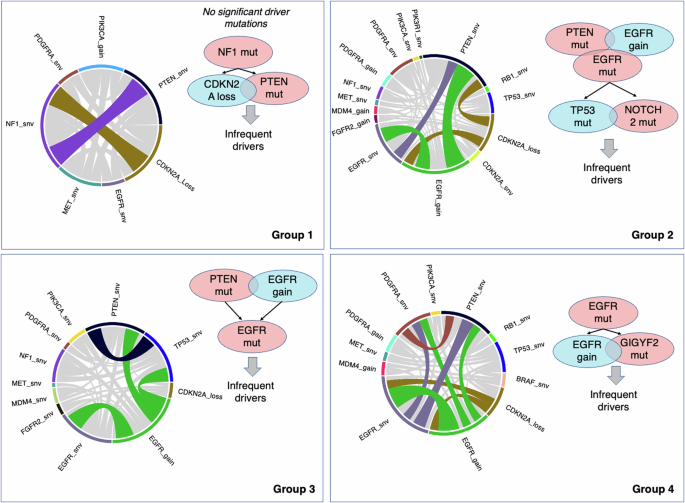
Schematic representation showing a summary of the order of events in GBM progression. NF1 alterations were identified as the most frequent and potentially early event in Group 1. In Group 2, PTEN mutations, EGFR amplification, and EGFR mutations were the most common events, followed by TP53 and NOTCH2 mutations. In Group 3, PTEN mutations, EGFR amplification, and EGFR mutations were the most frequent events. In Group 4, EGFR mutations, EGFR amplification and GIGY2 mutations were most frequent alterations.
Discussion
Cancer arises from genetic and epigenetic alterations in primary founding clones46, with subclones developing during tumor progression, contributing to intratumoral heterogeneity46. Like other cancers, GBM formation and progression involves oncogene activation, tumor suppressor inactivation, DNA repair deregulation, genomic copy number changes, and epigenetic alterations47. These alterations occur across subpopulations within the same tumor, giving rise to intratumor heterogeneity, influencing imaging characteristics. Our study explores the relationship between neuroimaging patterns, or radiophenotypes, and the molecular underpinnings of IDH-wildtype GBM revealing how mutations influence radiographic characteristics of the tumor. We attempted to bridge genomic and imaging scales by mapping the molecular landscape of IDH-wildtype GBM through spatiogenomic analysis and multivariate quantification of clinically-obtained mpMRI scans.
We developed imaging-AI models using radiomic features extracted from the entire tumor and its subregions, predicting mutations sequenced from single tumor specimens. These models revealed associations between in vivo imaging characteristics and underlying genetics, identifying non-invasive radiogenomic signatures of driver genes or pathways and assessing the impact of molecular heterogeneity on these imaging signatures. Unlike previous studies on GBM radiogenomics43,44,48,49,50,51 that focused on single targets, we explored co-occurring mutations simultaneously, demonstrating that AI-driven radiogenomics analyses can capture phenotypic expressions of driver genes alterations.
Our results demonstrate that molecular heterogeneity is reflected in radiophenotypes, with less heterogeneous tumors exhibiting more distinctive radiogenomic signatures. These in vivo phenotypic biomarkers provide insights into tumor ecosystems, including its molecular heterogeneity52, aiding clinical management and trial stratification, particularly for molecularly targeted therapies Tumors with EGFR mutations showed imaging features consistent with increased angiogenesis in enhancing tumor regions. This finding is in agreement with the involvement of amplified and/or overexpressed growth factors, or oncogenes, including PDGF, EGFR, MET, and FGFR, in overgrowth of high-grade gliomas53. The EGFR gene, as one of the most frequently altered genes in the RTK pathway, encodes the EGFR protein, which is a transmembrane tyrosine kinase receptor, and is critical in regulating cell division and death. Ligand-receptor binding transmits signals that result in activation of a series of intracellular signaling cascades affecting apoptosis, angiogenesis, and invasion53. Alterations in EGFR can lead to constitutive activation of the signaling pathway53, and the resulting phenotype is detectable by our imaging analysis.
PTEN, in the PI3K-AKT-mTOR signaling pathway, is a tumor suppressor gene that regulates cell division to prevent uncontrolled or rapid proliferation, inhibits transmission of growth factor signals through the PI3K/AKT signaling pathway, triggers the apoptosis process, and is involved in cell migration, angiogenesis, and adhesion of cells to the surrounding tissue54. PTEN loss or downregulation is an early phenomenon and among the most frequent mutations in GBM22. Our findings show that tumors with PTEN mutations compose of relatively less dense tissue in the non-enhancing core (including necrotic areas), as suggested by increased T2 signal and ADC values. This finding aligns with the reported role of elevated water content in the necrotic core in facilitating invasive tumor growth and its penetration in the surrounding tissue55 and involvement of PTEN mutations in necrogenesis and tumor invasiveness56. Increased water density can reflect lower tumor density, potentially due to pre-necrotic processes.
TP53 maps to chromosome 17p and encodes the p53 protein, which has an integral role in cell cycle arrest, response to DNA damage, and apoptosis; therefore, its inactivation leads to tumor progression through genomic instability57. In our study, mutations in the p53 pathway are accompanied by elevated cellular density (lower ADC), decreased water concentration (lower T2), and relatively increased perfusion (higher rCBV) in peritumoral edema, suggestive of diffuse infiltration. Given that the inactivation of genes in p53 pathway regulate the cell cycle by governing the G1-to-S phase transition58, alterations in this cell cycle regulator expose the tumors to abundant cell division via mitogenic signaling effectors, including PI3K and MAPK58, with one potential downstream effect being expansion of the tumor by infiltration further into the brain, as suggested by imaging
NF1 is a tumor suppressor gene that encodes neurofibromin protein, a negative regulator of cell growth through suppression of RAS activation59. Therefore, losses in neurofibromin functionality, as a result of inactivating mutations in NF1, will prolong activation of the RAS/MAPK signaling pathway, cause a loss in growth control and increase cellular proliferation60. In addition, reduced expression of neurofibromin confers resistance to therapeutic drugs, a fact that highlights the importance of detecting alterations in this pathway clinically60. NF1 alterations and RAS/MAPK pathway activation have been reported to prevail in a majority of mesenchymal subtype GBMs, which have the lowest survival rates among GBM molecular subtypes22,61. Such tumors exhibit a high degree of macrophage/microglia infiltration, express high levels of angiogenic markers and demonstrate extensive necrosis62,63. These biological characteristics of NF1 mutations supports our findings of relatively greater vascularization and increased cellular density within the non-enhancing tumor core (that also contains pre-necrotic regions) and higher angiogenesis in peritumoral edema in tumors with presence of mutations in NF1.
Radiogenomic signatures generally showed higher variance in mutated tumors compared to their wildtype counterparts, reflecting higher intratumoral heterogeneity44. This highlights the role of the proposed radiogenomic signatures in complementing the findings obtained via molecular analysis by overcoming the limitations posed by sampling bias in such a heterogeneous tumor44.
Our findings reveal that mutations in central core area of the tumor influence imaging features in peritumoral edema (e.g., mutations in TP53 and NF1 genes accompanied alterations in water content, infiltration, and neo-angiogenesis in peritumoral edema). This tumor subregion is formed as a biological response to diffuse infiltration of glioma cells into normal tissue surrounding the tumor, which causes the release of angiogenic and vascular permeability factors49. As resection of peritumoral edema, the propagating front of the tumor, is not usually a part of standard of care treatment for GBMs, future tumor recurrence becomes inevitable. Better understanding of radiogenomic characteristics of peritumoral edema can potentially aid in adopting alternative local therapies such as extended resection, intensified radiation, focused ultrasound, intra-operative viral injections, or convection enhanced intratumoral delivery of therapeutic agents.
We also observed spatial patterns in tumor locations associated with specific mutations, suggesting contributions from region-specific precursor cells. We found clusters of tumors in perisylvian regions and subcortical white matter with extension to superficial grey matter, which aligns with the previous findings about presence of neural CSCs in regions of the brain, such as the dentate gyrus64. GBMs likely arise from neural progenitor cells or stem cells, specifically astrocyte-like neural CSCs in the subventricular zone with low-level somatic mutations, which are the likely origin of IDH-wildtype GBM65.
We show that molecular heterogeneity, to the extent that can be measured by our targeted sequencing panel and MATH, and the similarity of the mutational signature for the group of tumors located in the frontal lobe are statistically lower (p = 0.01) than heterogeneity and signatures of the tumors clustered in the occipital lobe, and lower than the clusters of tumors in the temporal and parietal lobes (although not found statistically significant, p = 0.05). This distinction in the molecular composition of the tumors in the discovered tumor region groups was also observed by analyzing the evolutionary trajectories, which were estimated via statistical modeling of the pre-surgical genomic data. As the findings suggest, the tumors in the cluster concentrated around the frontal lobe may undertake a different progression path compared to tumors that occur in other regions, especially those arising in proximity to the occipital lobe.
It is proposed in the literature that tumor progression and heterogeneity are governed by selection of specific CSCs over time, due to factors including their genetic, epigenetic and TME interactions1,2,3,4. The progenitor CSCs may migrate from their origin and acquire additional somatic mutations, ultimately resulting in formation and progression of the tumor in distant brain parenchyma. Interactions with the TME can give rise to growth of some CSCs in highly vascular regions, or adaptation of some subpopulations to more hypoxic TME5. Numerous studies have reported on the role of the TME in forming the tumor phenotype and giving rise to its spatial and temporal heterogeneity66. The distinction in spatiogenomic signatures of tumors located in different brain regions, as supported by their modeled temporal evolution path, further highlights the contribution of TME in building the underlying molecular landscape of GBM.
In a previous study on the spatial tumor location of GBMs, tumors with amplification in EGFR and mutation in EGFR VIII were found to occur in the left temporal lobe67. In another study, the right frontotemporal region was reported to be absent in tumors with mutation in EGFR VIII 64. We found that EGFR mutant tumors, including those with EGFR VIII mutations, more frequently occur in the left parietal, right temporal, and right occipital lobes. The differences in the reported tumor locations could be attributed to the inclusion of different EGFR alterations in our study. EGFR amplification, reported in the study by Ellingson et al.67, occurs in 57.4% of primary GBMs22, leading to a higher frequency than somatic mutations and resulting in different findings. Additionally, varying thresholds and sequencing approaches could contribute to these differences. The smaller sample size in the study by Billelo et al.64 could also be a factor in the absence of mutations of EGFR VIII in the right temporal region.
As our study did not investigate the spatial location of tumors with or without PTEN loss, it is difficult to compare our finding that PTEN mutant tumors more frequently occur in the left and right temporal, and right parietal lobes with the findings reported by Ellingson et al.67, who reported that tumors without PTEN loss most frequently occurred in the frontal lobe. Further research is needed to reconcile these differences and understand the underlying factors influencing the spatial distribution of PTEN and EGFR mutant tumors.
Our study has several limitations. While the sample size for this study was larger than several other radiogenomic studies of GBM, it would benefit from a larger cohort, in which additional pathway level alterations can be detected and be correlated to the radiogenomic and spatiogenomic characteristics. Furthermore, this study did not include data from external institutions. The MR images from public databases are often of low quality and lack the necessary imaging data required for our multiparametric MRI predictive models. This limitation highlights the need for further validation of our predictive models to ensure their generalizability to multi-institutional data. Future studies should focus on acquiring higher-quality and more comprehensive datasets from diverse sources to enhance the robustness and applicability of the models.
Furthermore, limited sampling of biospecimen for genomic profiling and targeted gene panel sequencing may not capture certain classes of genomic alterations (e.g. fusions) and underappreciate intratumor genetic heterogeneity in driver mutations. Formalin fixation of the tumor samples that is carried out for diagnostic tests in molecular pathology can cause DNA damage, such as fragmentation and non-reproducible sequencing artifacts47. In our analysis of mutational signatures, disproportionate levels of C > T changes that appeared in all our four signatures may have been a result of these artifacts. However, as we used cosine similarity metric to determine the distinct patterns of mutational signatures, we do not believe that these artifacts that were similar among all four signatures influenced the derived conclusions.
While our sequencing panel ensured that the majority of tumors met the GBM criteria recommended by the 2021 WHO CNS tumor classification, the absence of TERT among the sequenced genes in our NGS panels and copy number data means that a few non-GBM patients may have been included in our cohort. However, given our thorough model training using nested cross-validation and independent testing approaches, the impact of these few non-GBM patients on the robustness of our models is expected to be minimal.
Additionally, our study demonstrated differences in imaging characteristics of tumors with different molecular drivers. However, these conclusions are based on the analysis of retrospective clinical data. Our study was limited to post-operative biopsies collected from resected tumors, making it impossible to obtain localized biopsies from different tumor subregions to directly associate their imaging phenotypes with genomic markers. We developed imaging-AI predictive models of gene or pathway mutations based on the imaging characteristics derived from the whole tumor and its subregions, including the enhancing tumor, non-enhancing tumor core, and peritumoral edema. However, the mutations were analyzed based on a single tissue sample typically cut from the enhancing core of the tumor. Validation of the characteristics of the peritumoral edema and non-enhancing core requires the collection of biopsy samples from these regions and the analysis of the gene mutations present within those areas, as carried out in a few other studies68,69,70,71. Alternatively, preclinical experiments can be conducted to confirm the observed imaging-molecular associations.
Lastly, it was not possible to directly associate changes in PSR levels in tumors with or without TP53 or NF1 mutations to specific biological characteristics like tumor permeability and vascular leakage. This is primarily because PSR variations are influenced by several factors, including imaging acquisition parameters (e.g., flip angle, echo time (TE), preload injection) and vascular bed architecture, such as compact extracellular-extravascular space (EES), rapid cerebral blood flow, and variations in capillary leakiness36,37,72,73.
In conclusion, we have elucidated the links between regional variations expressed as radiophenotypes and the molecular landscape of IDH-wildtype GBM. Prompted by the growing advances in computational analytics in the radiology – neuro-oncology domain and evidence for the potential of imaging to reveal molecular characteristics of the tumors, we comprehensively analyzed the radiogenomic, spatiogenomic, and evolutionary landscapes of GBMs to provide better understanding of the links between radio-phenotypes and the underlying molecular heterogeneity of GBMs. We found distinct radiogenomic signatures of mutations in several genes and signaling pathways that became more pronounced when the tumors were less molecularly heterogeneous. Importantly, these signatures offered mechanistic insights into how various mutations shape the phenotype of the tumor and its surrounding brain tissue via changes in cell density and neo-vascularization. We further discovered spatiogenomic signatures from tumors that carry certain mutations, suggesting the association of molecular composition with the brain regions they arise from. We showed that these spatial patterns may emerge as a result of differences in TMEs in different brain regions that give rise to distinct spatial and temporal heterogeneity and define molecular composition of the tumors. The findings of this study can assist in noninvasive identification of patients who may benefit the most from molecular targeted therapies, as well as allow for longitudinal monitoring of mutational changes during treatment.
Responses