The representational instability in the generalization of fear learning

Introduction
The conventional approach to understanding behavior transfer involves formulating the similarity between learned and novel contexts using a transfer function, widely adopted across domains like categorization1,2,3, memory4, and machine learning5, where the similarity between stimuli conforms to a decaying function of psychological distance6,7. Despite the wide variety of decaying functions8, the general exponential rule prevails, suggesting that behavior transfers more when the new context closely aligns with the learned context in mental space (Fig. 1a). In addition, other common practices in learning and generalization, such as elemental representation models9,10 or neural network models11, directly operate stimulus representation in the physical dimension, assuming that greater similarity in physical features leads to more overlap in stimulus (neural) representations and, consequently, more behavior transfers. Despite operating in different dimensions, all these approaches assume a static stimulus representation (Fig. 1a).

The left panels depict the relationship between physical and perceptual distances of stimuli, showing how the perceived similarity between previously learned and newly encountered stimuli relates to their actual physical differences. The right panels illustrate the relationship between perceptual distance and behavioral response, demonstrating that stimuli perceived as more similar to the learned stimulus (smaller perceptual distance) trigger stronger responses, while those perceived as more different elicit weaker responses. In the first scenario (a), mental representation is assumed to remain static over time, with behavior following a one-to-one mapping based on the point-based mental distance between novel encountered contexts and learned contexts. In contrast, in the second scenario (b), mental representation is characterized by noises and exhibits a dynamic nature over time. Consequently, applying the same mapping function may result in different behavioral predictions. The temporal patterns in (b) illustrate the dynamic nature of mental representations, serving as an example without specific theoretical implications for the changes shown.
The challenge with these invariant stimulus representation assumptions is that they overlook the dynamic and probabilistic characteristics of the mental representation process. Recent research has highlighted the imperfections of the nervous system12,13, characterized by the brain’s stochastic processes in encoding physical inputs14. To navigate such complexities, a probabilistic framework of mental representations is essential for understanding how behavior evolves in dynamic environments15,16. Behavioral17,18,19 and neural20,21,22 evidence in humans and other animals indicates a significant influence of internal uncertainty on behavior. In situations where mental representations of the physical inputs are unstable, even precise mapping functions can yield vastly different behavioral patterns (Fig. 1b). Therefore, investigations into behavior transfer must consider not only external environmental variability but also internal representational variability, a dimension notably overlooked in fields of stimulus generalization23.
Recent advancements in human perception theories underscore the non-linear, dynamic and inferential nature of perception, shaped by intricate sensory24,25,26 and psychological27,28,29,30 processes. Grounded in the predictive coding framework31,32,33 and particularly within the Bayesian brain theory29,30,34,35, these modern perspectives propose that our perception of the physical world is a dynamic process of continuous temporal evolution. This process is characterized by the brain’s ongoing management of inherent uncertainties in sensory input and the constant updating of expectations based on prior experiences and current context. A compelling illustration of these principles is provided by Weiss et al.36, who elucidates several perceptual patterns in human visual motion perception using Bayesian principles. Their research demonstrates that the visual system generally assumes slower motions to be more probable than faster ones, often leading to an underestimation of speed, particularly in low-contrast conditions. Moreover, their study reveals that the perception of motion direction in complex stimuli, such as plaids and rhombuses, can deviate from the actual motion. This deviation occurs as the visual system integrates noisy local measurements with a prior belief favoring slower motions, exemplifying the interplay between sensory input and pre-existing expectations in shaping perception.
Similarly, recent investigations into visual memory have revealed its complex and imperfect nature, highlighting the significant influence of contextual factors and the intricate interplay between encoding and retrieval processes37,38,39. A paradigm shift in understanding visual information storage and retrieval has emerged through the concept of hierarchical coding40,41,42. This framework challenges the traditional view of independent item storage, proposing instead that visual memory operates simultaneously across multiple levels of abstraction. Compelling evidence for this hierarchical model comes from experiments on size recall conducted by Brady et al.41. These studies demonstrated that when recalling the size of a specific circle, participants were systematically influenced by the average size of other circles sharing the same color. This bias toward ensemble statistics illustrates the complex interaction between item-specific details and higher-order information in memory processes. Building on these findings, recent research has further challenged the conceptualization of perceptual memory as a passive storage system. Brady et al.43 emphasize its probabilistic and inferential nature, aligning perceptual memory more closely with contemporary theories of perception. This emerging view posits that perceptual memory engages in active inferential processes. Such a framework suggests enhanced flexibility and adaptability in information storage and retrieval mechanisms, reflecting the dynamic nature of human memory.
Contemporary advancements in our understanding of human perception and perceptual memory challenge the assumption of veridical and deterministic perception that underlies much of traditional generalization research. In traditional generalization research, even in probabilistic models that acknowledge uncertainties9,10, the shape and location of stimulus representation distributions are often assumed to remain fixed for the same physical stimulus. Notably, a recent study highlights the constraints of the sensory processing system and establishes a connection between the inferential nature of human perception and the process of perceptual generalization44. Specifically, the study suggests that the slope of generalization gradients may correlate with the information processing capacity of the brain. Recent empirical evidence has begun to explore the impact of idiosyncrasies in perception45,46,47,48,49,50 and memory51,52 on fear generalization behavior. These studies have revealed that both stimulus perception and perceptual memory for a given stimulus can differ over time, with these differences directly mapping onto generalization behavior. This dynamics manifests in two key ways: quite often, a newly encountered stimulus, when misidentified as a previously learned stimulus, elicited stronger fear responses compared to when it was correctly identified; conversely, fear responses were substantially lower to the learned threat stimulus when mistakenly identified as different from its original encoding. This recent body of evidence adds support to the notion that examining generalization behavior within a fear context based on one-to-one physical perceptual mapping and flawless memory retention is overly simplistic. While these empirical findings have highlighted the importance of interindividual differences in stimulus representation, the dynamic interplay between perceptual and memory systems and their combined modulation of fear-related behavior remains largely unexplored.
In this work, we investigated, under fear contexts, the dynamic patterns of two primary sources of stimulus representations: perception and perceptual memory. Simultaneously measuring how individuals perceive and recall features of threat and safety stimuli acquired during learning and generalization paradigms in a differential conditioning experiment (Fig. 2), we explored the existence of specific temporal patterns in perception and perceptual memory. In addition, we investigated whether such patterns are driven by threats. Utilizing computational modeling to formulate a comprehensive system for perceptual fear generalization49, which integrates error-driven learning53 and similarity-based generalization processes6,7, we further explored the contributions of individual perception and perceptual memory to shaping fear generalization behavior.
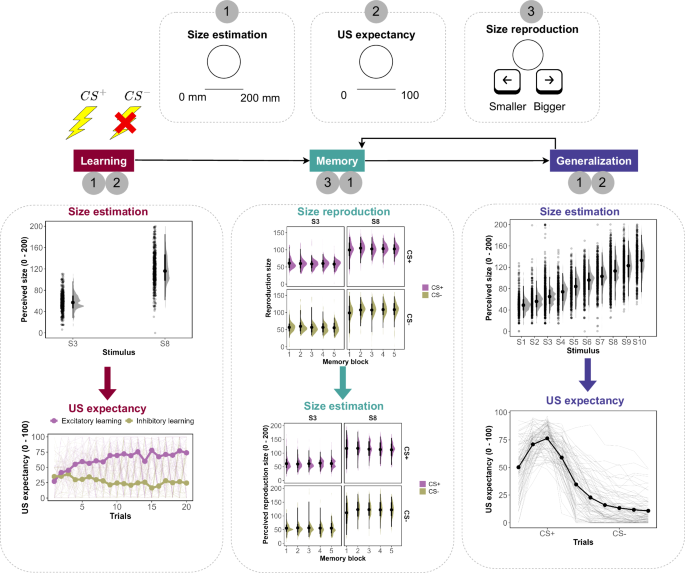
The experimental design and group-level descriptive data from the current study are presented, involving three distinct tasks: size estimation, US expectancy, and size reproduction.
Results
In this section, we report findings regarding the perceptual temporal pattern, perceptual memory temporal pattern, the variation between perception and perceptual memory, and how they relate to fear generalization behavior. For parameter inferences, we used Bayesian statistics, which represents our uncertainty about parameters through probability distributions in a principled manner.
Perceptual dynamics: group patterns
In Fig. 3a, a distinct perceptual drift with opposite directions is observed for the threat-associated stimulus (CS+), depending on its physical size (S3: 66.048 mm, S8: 104.168 mm). Specifically, the group-level (across blocks) parameter ({mu }_{{delta }_{mu }}), governing the overall changes in the mean of perceived size throughout the experiment, was estimated as positive when S3 served as threat stimulus (95% CI [1.74, 4.04], median = 2.80) and negative when S8 served as threat stimulus (95% CI [−5.05, −1.19], median = −2.90). This led to an increase in perceived size when S3 served as threat stimulus and a decrease in perceived size when S8 served as threat stimulus throughout the experiment. Interestingly, the drift pattern was much less pronounced when the same stimuli had no association with threat (CS−). The estimated ({mu }_{{delta }_{mu }}) covers 0 in its 95% CI when either S3 (95% CI [−0.18, 0.29], median = 0.05) or S8 (95% CI [−0.17, 0.03], median = −0.07) served as safety stimulus. This results in overlaps between the estimated μ at the beginning and at the end of the experiment when either S3 or S8 served as safety stimulus.
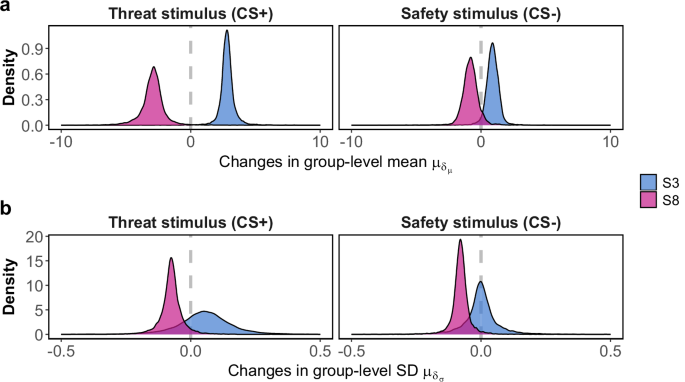
The general temporal patterns of perceived size of two stimuli, S3 (physical size = 66.048 mm) and S8 (physical size = 104.168 mm), serving as threat-associated (CS+) and threat-absent (CS−) stimuli. The two panels depict 10,000 MCMC samples of the group (across blocks) level parameter modulating the overall temporal variations in the mean (a) and SD (b) of the perceptual response.
Concerning the standard deviation of the perceived size (σ), a more stimulus-specific pattern, rather than fear-specific, emerged (panel b, Fig. 3). For S8, ({mu }_{{delta }_{sigma }}) (on a logarithmic scale) was estimated mostly as negative either when it served as threat stimulus (95% CI [−2.01, 0.48], median = −0.82) or safety stimulus (95% CI [−0.15, 0.002], median = −0.08). This led to a decrease in σ throughout the experiment when S8 served as either threat or safety stimulus. For S3, the continuous temporal pattern was less evident. Another stimulus-specific pattern surfaced, revealing that uncertainty regarding S8 surpassed that of S3 at the onset of the experiment, regardless of whether in threat or safety conditions, while the variance decreased gradually over time. For the complete block-level μ and σ estimates with the size estimation data for threat and safety stimuli in the acquisition and generalization stage, see Supplementary Tables 1 to 6.
Perceptual dynamics: computational modeling
Employing a one-dimensional state space model, we explored both inter- and intra-individual differences in perceptual dynamics. This extended analysis not only investigated perceptual dynamics concerning threat (CS+) and safety (CS−) conditioned stimuli but also tracked evolving perceptions of all encountered stimuli throughout the experiment. The model featured a mixture structure, allowing us to test two hypotheses about the nature of perceptual dynamics in fear contexts.
First, we examined two assumptions about the perceptual prior. This involved contrasting two ideas: (1) that current perception is grounded in the most recent preceding perceptual mean, and (2) that it relies on the mean of individual sensory transformations across the spectrum of physical stimuli presented during the experiment (i.e., regression to the mean effect). Second, we scrutinized, on an individual basis, whether there was a difference in the propensity of current perception to adhere to the perceptual prior (see “Methods” section for more modeling details). The effectiveness of our model in interpreting the observed data is underscored by posterior predictive checks (see Supplementary Figs. 1 to 6).
The underlying premise of the current perceptual model posits that perception, at any given point in time, is influenced by the interplay between the ongoing sensory transformation, known as the perceptual likelihood (see Supplementary Fig. 13), and the existing perceptual prior, taking into account the relative uncertainty associated with both sources, as delineated by the Kalman gain (κ). A lower Kalman gain signifies an increasing emphasis of the perceptual prior on the current perceptual distribution.
In Fig. 4a, our findings strongly support the utilization of the mean of sensory translated values as the perceptual prior, rather than the most recent perception. The 95% credible interval for the probability parameter πψ of the prior source is estimated to be [0.95, 1], with a median value of 0.99. Turning focus to Panel b, we observe that the proportion of fear-conditioned stimulus uncertainty exceeding that of the other stimuli hovers around 0.5. This suggests that, for the majority of participants, the sensory uncertainties associated with fear-inducing and neutral stimuli are approximately equivalent.
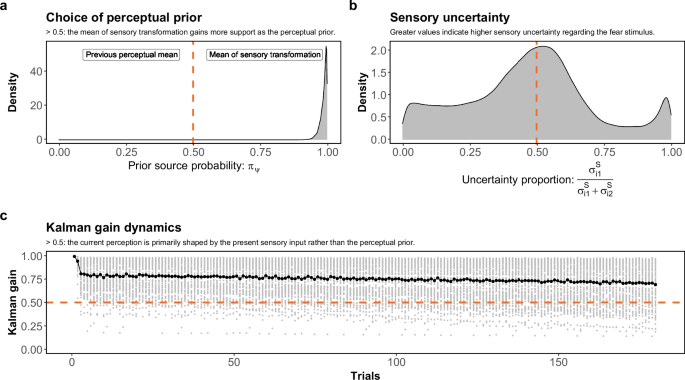
a Posterior distributions with 10,000 MCMC samples of the probability parameter πψ, determining whether the data favors using the previous perceptual mean or the mean of individual sensory mapping values of the presented sensory inputs in the experiment as the perceptual prior. A value smaller than 0.5 signifies support for the former prior source, while a value greater than 0.5 indicates the opposite. b The proportion of sensory uncertainties for fear-conditioned (({sigma }_{1,i}^{S})) and other (({sigma }_{2,i}^{S})) stimuli ((frac{{sigma }_{1,i}^{S}}{{sigma }_{2,i}^{S}+{sigma }_{1,i}^{S}})) computed by estimated ({sigma }_{1,i}^{S}) and ({sigma }_{2,i}^{S}). A value greater than 0.5 implies greater sensory uncertainty for fear-conditioned stimulus, suggesting its higher susceptibility to the perceptual prior in comparison to other stimuli; conversely, a value smaller than 0.5 implies the opposite. c The dynamics of Kalman gain (κ) for participants across trials are illustrated. A Kalman gain greater than 0.5 signifies a higher susceptibility of the current perception to the sensory transformation of the current sensory input, while a value smaller than 0.5 implies the opposite.
Figure 4c illustrates the progressive changes in the Kalman gain κi across multiple trials. It can be seen that, in general, there is a dominance of the perceptual likelihood over the perceptual prior throughout the entire experimental duration for most participants. Nevertheless, a discernible decrease in this trend indicates a slight increment in the influence of the perceptual prior on shaping perception for a subset of participants. Thus, on average, throughout the experiment, the prior becomes somewhat more important in the construction of the percept.
Perceptual memory dynamics: group patterns
In Fig. 5a, the mean recalled sizes for both threat (CS+) and safety (CS−) stimuli remain stable throughout the experiment, irrespective of physical size. In the size reproduction task, median ({mu }_{{delta }_{mu }}) estimates for CS+ are −0.50 (S3) and 0.51 (S8), with 95% CIs of [−1.33, 0.28] and [−1.76, 0.78], respectively. The corresponding median estimates for the safety stimulus are 0.28 (S3) and 1.87 (S8), with 95% CIs of [−0.92, 1.66] and [−1.85, 6.37], respectively. In the subsequent size estimation task, median ({mu }_{{delta }_{mu }}) estimates for the treat stimulus are 0.45 (S3) and −0.02 (S8), with 95% CIs of [−0.52, 1.36] and [−1.27, 1.25], respectively. The corresponding estimates for the safety stimulus are −1.42 (S3) and 1.91 (S8), with 95% CIs of [−3.15, 0.36] and [−3.32, 8.10], respectively. These estimates reveal that the temporal effect is not discernible in perceptual memory, regardless of the stimulus size or the presence of threat associations (see Supplementary Figs. 2 to 3 for the estimated μ in the memory task).
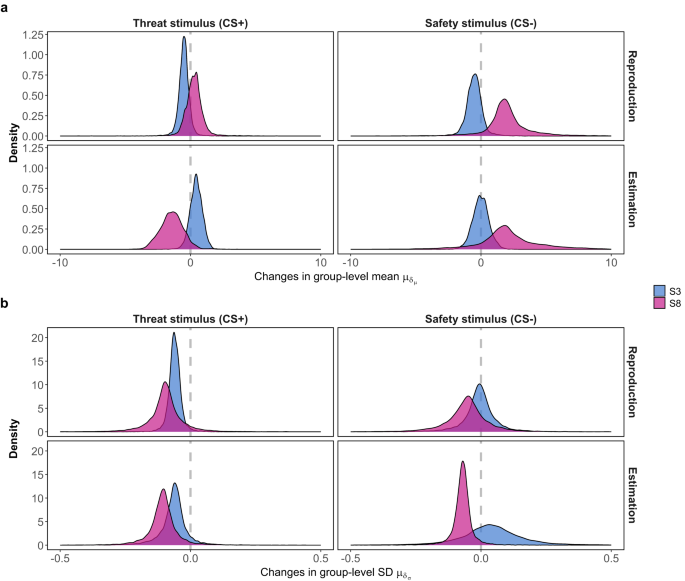
The general temporal patterns of recalled perceived size of two stimuli, S3 (physical size = 66.048 mm) and S8 (physical size = 104.168 mm), serving as threat-associated (CS+) and threat-absent (CS−) stimuli. a The two panels depict 10,000 MCMC samples of the group (across blocks) level parameter modulating the overall temporal variations in mean (a) and SD (b) of the perceptual memory response.
The standard deviation of recalled sizes exhibits an overarching decreasing pattern, although it is not consistently observed across all conditions (Fig. 5b). In the size reproduction task, median ({mu }_{{delta }_{sigma }}) estimates for threat stimulus are −0.06 (S3) and −0.10 (S8), with 95% CIs of [−0.11, −0.009] and [−0.25, 0.06], respectively. The corresponding median estimates for the safety stimulus are −0.004 (S3) and −0.05 (S8), with 95% CIs of [−0.16, 0.15] and [−0.26, 0.13], respectively. In the subsequent size estimation task, median ({mu }_{{delta }_{sigma }}) estimates for the threat stimulus are −0.06 (S3) and −0.11 (S8), with 95% CIs of [−0.19, 0.05] and [−0.24, 0.02], respectively. The corresponding estimates for the safety stimulus are 0.04 (S3) and −0.07 (S8), with 95% CIs of [−0.23, 0.33] and [−0.16, 0.009], respectively. In addition, the findings in perceptual memory mirror the pattern observed in the perceptual data, where the uncertainty of S8 notably surpasses that of S3 at the onset of the experiment, gradually converging as the uncertainty of S8 declines over time (see Supplementary Figs. 5 to 6 for the estimated σ in the memory task).
Variability between individual perception and perceptual memory
Subsequently, we investigated the alignment between individual perceptual memory of threat and safety conditioned stimuli and the most recent perception prior to the memory task. This analysis utilized predictive samples from individual perceptual and memory distributions, derived from the second analysis. The perceptual distribution was based on estimations from the most recent threat and safety stimuli encountered before each memory task.
Figure 6 reveals significant individual disparities in the discrepancies between predictive samples of perception and perceptual memory. While some individuals exhibit perceptual memory that closely aligned with the most recent encoding of physical inputs, overall, the predictions of perceptual memory and perception do not align well. In addition, a stimulus-specific pattern emerged in the size reproduction data. According to median estimates, participants tended to recall larger sizes for S3 (fear stimulus: 71.88% of participants; safety stimulus: 93.75% of participants) and smaller sizes for S8 (fear stimulus: 50% of participants; safety stimulus: 87.5% of participants).
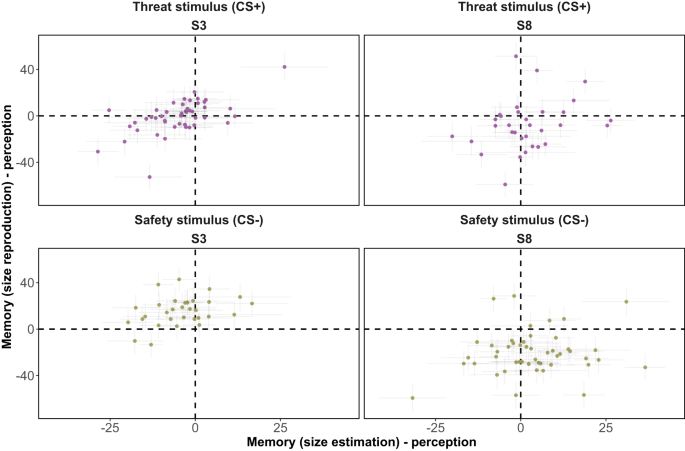
Mean variations in predictions across blocks for individual perceptual and memory distributions of two stimuli, S3 (physical size = 66.048 mm) and S8 (physical size = 104.168 mm), which served as threat-associated (CS+) and threat-absent (CS−) stimuli. For each memory block, 10,000 predictive samples were generated from both perceptual distributions (representing the most recent encoding before the memory task) and perceptual memory distributions. The mean was then calculated across all memory blocks for each distribution, after which the differences were computed. A value of 0 signifies a perfect alignment between perception and perceptual memory (memory data – x-axis: size estimation; y-axis: size reproduction). Values greater than 0 indicate overestimation in perceptual memory, while values smaller than 0 indicate underestimation. The error bars denote the interquartile range (25th to 75th percentiles). The points correspond to the median values of each individual.
Links to fear generalization behavior
For the final analysis, we examined the influence of real-time perception and perceptual memory on fear generalization behavior, as pre-registered. To achieve this, we applied the data to a computational model of human generalization49 and devised a mixture framework within the model. This composite structure enabled us to assess the extent to which the incorporation of memory data and perceptual data contributed to explaining the generalization behavior. Similar to the computational perception model, the validity of our model in explaining the observed data is affirmed through posterior predictive checks (see Supplementary Figs. 7 to 12).
For the first comparison, akin to the previous research49, we examined whether the primary mechanism of data formation indicated potentially clinically relevant subgroups characterized by either the absence of learning (Non-Learners, π1,1) or an abnormal tendency toward overgeneralization (Overgeneralizers, π1,2). Furthermore, we assessed whether the data on generalization behavior were more aligned with physical distance (Physical generalizers, π1,3) or perceptual distance (Perceptual generalizers, π1,4).
In the second comparison, we established three distinct perceptual distances based on different assumptions regarding perceptual memory. The first assumes that distances in psychological space are determined by current perception and perceptual traces, as derived from our computational model of perception. The second and third assumptions propose that perceptual memory, as measured in the memory task (via size reproduction and estimation), rather than perceptual traces, determines the memory component in perceptual distance. The level of support for each of these perceptual distance assumptions is quantified by the estimated probability parameters π2,1, π2,2, and π2,3, respectively.
Figure 7a demonstrates the dominance of Perceptual Generalizers in the current data, with the estimated probability parameter π1,4 having a 95% CI of [0.84,0.96] and a median of 0.92. The probability parameters for the other three latent groups are all estimated to be negligible, with 95% CIs of [0.007,0.084], [0.057,0.011], and [0.007,0.084], and medians of 0.032, 0.011, and 0.032 for π1,1, π1,2, and π1,3, corresponding to the latent groups of Non-Learners, Overgeneralizers, and Physical Generalizers, respectively (see Supplementary Fig. 14 for MCMC trace plots).
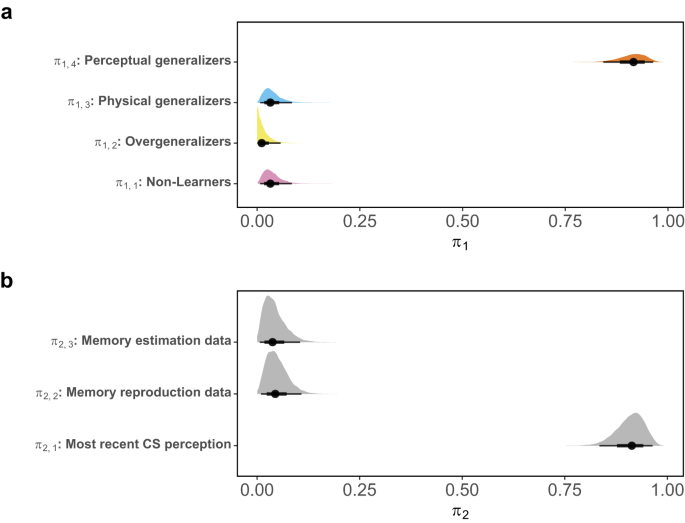
a The four probability parameters denote the extent to which the current data supports the assumptions of generalization behaviors being influenced by either the absence of learning (π1,1) or overgeneralization (π1,2). In addition, they assess whether learning and generalization reasonably occur through the influence of physical distance (π1,3) or perceptual distance (π1,4). b The three probability parameters indicate the extent to which the current data support the assumptions of perceptual distance. These are computed using either the most recent perceptual distribution of threat and safety stimuli (π2,1), or the distributions estimated by the size estimation data (π2,2) and the size reproduction data (π2,3) as the perceptual memory components. Each distribution consists of 10,000 MCMC samples.
Regarding the second comparison, Fig. 7b presents compelling evidence indicating that memory data did not contribute more to explaining the observed fear generalization behavior than simply assuming that the most recent perceptual encoding represents the current memory representation of the learned stimuli. The estimated probability parameter π2,1 has a 95% CI of [0.84,0.96] and a median of 0.91, which is notably higher than the other two assumptions about perceptual distance. These assumptions have 95% CIs of [0.007,0.105] and [0.01, 0.11] and medians of 0.37 and 0.44 for π2,2 and π2,3, corresponding to perceptual distances computed with size estimation and reproduction data in the memory task, respectively.
In summary, our findings corroborate those of Yu et al.49, demonstrating that both inter- and intra-individual differences in perception are important contributors to human fear generalization behavior. However, contrary to our initial hypothesis, our evidence did not support the notion that incorporating perceptual memory enhances the explanation of generalization behavior.
Discussion
In this research, we explored the dynamic interplay between the dual underlying mechanisms that govern stimulus representations within fear contexts: the instantaneous visual perception and the perceptual memory. Our findings suggest that there is no evidence of meaningful temporal shifts in perceptual memory. This observation aligns with existing research evidence that supports the notion of a well-preserved process of low-level visual perception over short time intervals54,55,56, a characteristic that remains unchanged within fear-laden contexts in the current study. However, in the case of visual perception, we observed a progressive drift associated with the smaller size stimulus when conditioned with fear-inducing outcomes. Conversely, we noticed a diminishing drift when the larger size stimulus was conditioned with fear-inducing outcomes. Notably, these drifts were less pronounced when the stimuli were not associated with threats. Moreover, we found a decreasing trend in perception in terms of uncertainty, particularly for the larger size stimulus, irrespective of whether it was conditioned with fear or not. The computational modeling, which examined the trial-to-trial changes in perceptual distributions at the individual level across all stimuli, supports a similar notion: around half of the participants exhibited a more pronounced regression to the mean effect when encountering threat-associated stimuli compared to other stimuli.
Since the seminal work of Shepard6,7, generalization has been envisioned as a cognitive inferential system57,58 operating within the mental space. In this framework, stimuli with minimal distances in the mental space are more likely to be inferred as belonging to the same psychological region. The extent of generalization varies based on how far this region is from the initial learning region. However, basing inference on mental space distance can pose challenges if we assume a stable mental space, while the mental representations of physical inputs are dynamically and probabilistically dispersed within it. Recent perceptual theories29,30,34,35 and our current data collectively emphasize that the mental space is far from static. Our findings underscore a distinctive perceptual dynamics in humans when encountering fear contexts. Incorporating these context-specific perceptual dynamics is crucial for formulating accurate mental distances, thereby mitigating the influence of one inferential system (stimulus representation) on another (generalization).
The research interest in understanding how fear learning influences the ability to differentiate between subsequently encountered stimuli and the initially learned stimuli has seen a notable surge in recent years59,60,61,62,63. Yet, the presence of conflicting evidence poses a challenge in drawing definitive conclusions regarding alterations in the identification and discrimination of fear-conditioned stimuli following fear learning, and the subsequent implications in fear generalization behavior. Considering the biological imperative for survival, both directions of the impact of fear context on perceptual discrimination hold significance. Augmenting perceptual discriminability can potentially bolster the likelihood of survival by fortifying the identification of fear-inducing contexts. Conversely, diminishing perceptual discriminability may also enhance the chances of survival by expediting the generalization of fear learning to physically similar contexts. The current findings contribute indirectly to the discourse by highlighting that fear learning undermines the ability to discern initially learned fear contexts59,62,64, primarily influenced by the temporal dynamics of visual perception, while perceptual memory remains relatively stable.
The temporal dynamics observed in the perception of fear-inducing stimuli bear a striking resemblance to the regression effect, also known as the central tendency of judgment. This perceptual bias has been documented in psychophysics literature for decades65,66. From the recent perspective of the Bayesian brain theory, this phenomenon can be understood as a result of the adaptive learning process of the perceptual system29. According to this framework, the brain continually learns and forms prior distributions based on previously encountered physical inputs. As more stimuli are experienced, the mean of this prior distribution gradually shifts toward the average of the perceived quantities of these stimuli. When a new physical input is encountered, the resulting perception is influenced by this prior distribution, effectively drawing the perception toward the mean of previously encountered stimuli. The underlying mechanism of a more pronounced effect on fear-inducing stimuli found in our data (Fig. 3), however, warrants future studies. Theoretically, this effect could be attributed to either increased uncertainty in the sensory processing of fear-inducing stimuli or the formation of a separate prior distribution with narrower uncertainty for these stimuli. The former explanation is somewhat surprising given previous research indicating that fear-inducing stimuli capture attention more readily67,68. In either case, percepts tend to incline more toward the prior distribution, which encapsulates ensemble information of all encountered stimuli. From an evolutionary perspective, such an adaptive tendency could have survival value. The inclination toward prior percepts may enable individuals to quickly recognize contexts similar to dangerous ones as potentially threatening, thereby providing opportunities for avoidance. Future studies should aim to replicate our findings and explore potential explanatory mechanisms for this phenomenon.
In addition to the average patterns, we also observed substantial individual variations in the disparities between the perceptual memory distributions and the latest perceptual distributions of threat and safety stimuli before every memory block. Through the utilization of a computational model of generalization49, we discovered that the incorporation of a memory distribution in the computation of perceptual distance (whether using size estimation or reproduction data) did not alter the generalization behavior compared to use of the most recent perceptual distributions of conditioned stimuli as a memory component. Moreover, through comparisons of various assumptions regarding patterns of fear generalization behavior, we discovered that the majority of participants exhibiting fear transfer in accordance with dynamic and probabilistic distances in the mental space, rather than the physical features of stimuli. In addition, the proportion of participants exhibiting aberrant generalization behavior is negligible.
One potential explanation for observing more variation in perception-memory dynamics than in its actual effect on fear generalization behavior is that while most participants maintain stable perceptual memory of conditioned stimuli during the acquisition stage, the encoding of fear-inducing sensory information shifts alongside perception. This is especially notable given that individuals consistently experience fear-inducing contexts during the post-learning stage of the experiment. The newly encountered fear-inducing experiences are not necessarily linked to the initially fear-associated perceptual memory, but rather to the immediate mental representation of the surrounding environment at the time of these fear experiences. Consequently, this gives rise to a complex interplay between perception, fear learning, and fear generalization. Fear learning modulates perception59,60,61,62,63, which in turn influences fear generalization45,46,47,48,52. The alterations in perception within these fear-laden contexts further impact fear learning, perpetuating a cyclic process. This could potentially offer an alternative explanation for the inconsistent findings regarding the effect of fear learning on stimulus discrimination, as current studies have not fully accounted for the continuous experiences and mutual influences of these different mechanisms.
From a clinical perspective, the behavioral fear generalization gradient increasingly serves as an indicator for anxiety-related disorders, where anxiety symptoms are associated with steeper fear response gradients, implying a stronger generalization tendency as a cognitive mechanism69,70,71. However, clinical implications may be misleading when steeper response gradients are driven by perceptual representation processes rather than the generalization tendency. The significant impact of robust perceptual priors has been observed in various mental disorders, shaping overall perceptual patterns72,73,74. This body of evidence suggests that individuals with specific conditions, such as schizophrenia75, tend to modify their visual processing in response to diverse sensory inputs, adhering to a particular belief about physical reality. Intriguingly, research indicates that psychosis can be induced in healthy participants through the introduction of robust perceptual priors in conditioning experiments76. Moreover, memory bias has been more frequently observed in patients compared to healthy participants77,78,79,80. Given that certain mental illnesses can influence mental representation patterns and vice versa, this could lead to the misattribution of observed behaviors to the disorder. The current evidence, coupled with a wealth of recent research exploring latent mechanisms of fear generalization behaviors45,46,47,48,49,50, necessitates a paradigm shift in the study and treatment of generalization-related clinical disorders. This shift calls for a transition from focusing solely on observed behaviors or symptoms to delving deeper into the diverse mechanisms underlying these outcomes. Such an approach would enable the development of tailored treatment programs based on specific combinations of mechanisms for different symptom presentations. The clinical value of computational modeling is increasingly recognized for its capacity to elucidate the underlying causes of psychiatric symptoms and to stratify patients based on multidimensional symptom profiles81,82. The work of Yu et al.49 and the current research advocate for the widespread adoption of computational modeling to integrate various generalization-behavior generating routes in both theoretical and applied research. This approach not only enhances our understanding of the complex processes underlying fear generalization but also holds promise for more precise and effective interventions in clinical settings. Future research should focus on refining these computational models and validating their predictive power across diverse clinical populations, potentially revolutionizing the diagnosis and treatment of anxiety-related disorders.
Finally, our findings emphasize the need for further investigation into the origins, mechanisms, and circumstances under which a biased perceptual prior might manifest to influence perception. Given that fear generalization behavior has been implicated as a key in anxiety disorders69,70,71, it is reasonable to consider that individuals with anxiety disorders may exhibit a heightened perceptual prior that modulates their sensory processing systems. This supposition is supported by research on other forms of psychopathology72,73,74. Understanding the intricacies of perceptual dynamics in individuals with anxiety disorders, particularly in their perception of fear-inducing stimuli, and discerning the relative contributions of perceptual and other cognitive mechanisms in shaping their maladaptive fear behavior, is of paramount importance.
As a limitation, the conclusions drawn in this study are solely based on self-report behavioral data. However, the alignment between behavioral measures and physiological or neurological indicators within the context of fear remains unclear. Previous research has indicated inconsistencies between these measures, both in the realm of fear learning83,84,85 and perception86. Understanding which response channels better account for the alterations in the underlying mechanisms of observed behavior necessitates the use of modern modeling techniques in cognitive science. These techniques enable the statistical integration of data from different response channels into a cognitive model, facilitating the inference of parameters based on the combined information from all channels87,88. Another advantage of incorporating measurements at both biological and behavioral levels offers a more comprehensive understanding of how individuals respond to the fear-conditioned stimuli in the experiment. The potential influence of fear perception saliency on changes in perception and perceptual memory within the fear context warrants careful consideration. While electrical stimuli are widely used and recognized as potent fear-inducing stimuli in human experimental research89, due to the complexity of fear as an emotional construct, which is not fully understood empirically, it is challenging to capture it accurately through a single measurement90.
Methods
The study was pre-registered on the Open Science Framework (https://osf.io/puyg3). An additional study91 using the same dataset, but primarily focusing on exploring gender effects in fear generalization and related processes, was registered separately (https://osf.io/byq82). This latter study aims to investigate potential gender-specific patterns in fear generalization behavior and whether these patterns stem from gender differences in learning, perception, and perceptual memory. Both pre-registrations were completed prior to data collection. All relevant materials of the current study, including experiment scripts, data, and analysis scripts, are accessible at https://osf.io/8qxu3/. Ethical approval was obtained from KU Leuven’s Social and Societal Ethics Committee (G-2022-5873-R3).
Deviations from pre-registration
The current study deviates from the pre-registration in several important aspects. In particular, the pre-registration plan was followed for the data collection and the data processing. The final reported analysis is the analysis included in the pre-registration plan. The first four analyses, however, were not pre-registered. These exploratory analyses serve a dual purpose: they elucidate specific dynamic patterns in perception and perceptual memory (group patterns analyses), and they facilitate the development of more theoretically grounded variables for both processes (computational modeling for perception).
Participants
The sample size for this study was set at 80 participants. This sample size is expected to be sufficient based on our previous similar study49, which employed the same computational model for generalization with a sample size of 40 participants.
To achieve our target sample size of 80, we initially recruited 100 participants (50% female; mean age = 21 years, SD = 4.01). To ensure data quality, we applied several exclusion criteria. Participants who did not complete the entire experiment or who self-reported not responding seriously were excluded. In addition, we removed from the analysis any memory reproductions that retained the same diameter size as the initial size (either 0.1 or 160 cm). Participants with more than 20% missing data for any measurement during any phase of the experiment were also excluded. These criteria were implemented to maintain the integrity of our data and ensure the reliability of our analyses. The final sample size and any adjustments made due to these exclusions are reported in the Results section. Recruitment was conducted through the participant pool of the KU Leuven Faculty of Psychology and Educational Sciences, and participants received research participation credit or €16 as compensation. Informed consent was provided by participants at the beginning of the experiment. The experiment lasted ~90 min, and all instructions were provided in English.
Experiment
In this study, we employed a differential conditioning paradigm for fear learning and generalization. During fear learning, participants were repeatedly presented with a threat-associated stimulus (CS+) and a safety-associated stimulus (CS−), enabling them to learn the consequences (US) of these stimuli. Following this, in the generalization paradigm, participants were exposed to novel stimuli that bear physical similarities to the learned ones. Their fear responses to these stimuli were then measured.
The stimuli for learning and testing consisted of circles of various sizes, presented as white outlines against a black background. Circle size has been widely utilized in studies involving conditioned fear, spanning both healthy and clinical populations46,49,69,92,93,94. The stimulus set included ten circles labeled S1 through S10, with diameters ranging from 50.80 to 119.42 mm and spaced at intervals of 7.624 mm. During fear learning, the third-smallest circle (S3: 66.048 mm) and the third-biggest circle (S8: 104.168 mm) were presented. One of these circles was associated with a painful shock (CS+), while the other signaled its absence (CS−), with this association counterbalanced across male and female participants. For 24 participants of each gender, S3 served as threat stimulus and S8 as safety stimulus, while in the remaining participants, the configuration was reversed.
To evoke fear responses, participants experienced a 2-ms aversive electrocutaneous stimulus as the unconditioned stimulus (US). This stimulus was administered using a Constant Current Stimulator (DS7) through a pair of Ag/AgCL electrodes (each 8 mm in diameter) placed on the non-dominant wrist, lubricated with K-Y gel. Individual adjustments to the US intensity were made using the Ascending Method of Limits approach95 to achieve a pain rating of 8 on a Visual Analog Scale (VAS) ranging from 0 (no pain) to 10 (worst imaginable pain). Beginning at 2 mA, the intensity increased by 0.2 mA per step, ensuring pain sensations remained tolerable. On average, the selected intensity was 10.99 mA (SD = 5.89).
The experiment comprised four phases following calibration: practice, acquisition, memory, and generalization. Before commencing, participants received comprehensive instructions both orally and in written form, including visual examples of different line sizes (5, 10, 50, 100, and 150 mm). After calibrating the unconditioned stimulus (US) intensity, participants completed six practice trials to familiarize themselves with the task. Each trial displayed conditioned stimuli (CSs) on a computer screen for 12 s, divided into two phases. During the first 7 s, the CS was presented alongside a Visual Analog Scale (VAS) for size estimation, ranging from 0 to 200 mm. After this period, the size estimation VAS disappeared, and an expectancy-VAS appeared for the remaining 5 s. This expectancy-VAS ranged from 0 (‘no shock’) to 100 (‘definitely a shock’). Following the 12-s stimulus presentation, a fixation cross marked the intertrial interval (ITI), which lasted 1 to 3 s randomly. During practice trials, no US was presented. Following the practice phase, the acquisition phase commenced, consisting of 10 CS+ trials and 10 CS− trials. The task structure mirrored the practice phase, with the only difference being that the US followed the CS+ 80% of the time (equivalent to 8 trials).
After the acquisition phase, participants proceeded to the first memory task, where they were asked to recall and recreate threat (CS+) and safety (CS−) stimuli. They were instructed to recreate the circle that most often led to an electric stimulus or the one that least often led to it during phase 1. Participants adjusted the circle size by pressing buttons, incrementing or decrementing in 0.5-mm increments, upon seeing circles with either a very large diameter (160 mm) or a very small diameter (0.1 mm) on the screen. They then estimated the recreated circle’s diameter using a size-VAS for 7 s and indicated their confidence level on a confidence-VAS for 5 s. Following a 1-min break, the generalization phase began, where participants estimated circle sizes and shock expectancy as in previous phases. This phase included CS(s) and an additional set of 8 circles varying in size, with threat stimuli consistently paired with shocks, while safety and other test stimuli were not. This sequence was repeated thrice, with each repetition followed by a 1-min break, memory phase, and generalization phase. After the final memory block, participants completed the State-Trait Anxiety Inventory (STAI) (see Supplementary Fig. 15 for the distribution), and a debriefing session ended the experiment. In total, five memory blocks were administered, each containing recall instructions for 5 threat stimuli and 5 safety stimuli, presented in random order. Similarly, there were five generalization blocks, each comprising 12 threat stimuli, 4 safety stimuli, and 3 instances of each of the other 8 circles, also presented randomly.
Group patterns
To examine the temporal dynamics of perception and perceptual memory of the stimuli presented in the learning stage, a normal distribution model was formulated to estimate block-level parameters, including the overarching mean (μ) and standard deviation (σ) for both threat and safety stimuli. This estimation was performed with a multilevel structure for the size estimation data collected during all stages of the experiment: the fear learning and generalization stages (z = 1) and the size reproduction (z = 2) and estimation data (z = 3) in the memory stage (see also Fig. 2). These parameters were estimated separately for distinct conditions of physical size (S3 or S8, indexed as k ∈ {1, 2}) and whether threat is associated (CS+ or CS−, indexed as l ∈ {1, 2}) and blocks (5 blocks, indexed as m ∈ {1, 2, 3, 4, 5}).
Between each block, the parameters δμ,m and δσ,m were utilized to govern block-level changes in μklm and σklm (we transformed σklm to a logarithmic scale). For any of the three subdata (z = 1 for the fear learning and generalization stages; z = 2 for the size reproduction in the memory stage; z = 3 for the size estimation in the memory stage):
with
and
Higher-level priors (i.e., hyperpriors; see Table 1) are assigned to the parameters δμ,m (with ({mu }_{{delta }_{mu }}) and ({sigma }_{{delta }_{mu }})) and δσ,m (with ({mu }_{{delta }_{sigma }}) and ({sigma }_{{delta }_{sigma }})), which govern the block variations of μ and (ln (sigma )), respectively. These hyperpriors encapsulate information regarding general temporal change patterns rather than capturing specific differences between individual blocks. They serve as a means to incorporate broader knowledge about the overall trends in temporal variations, enhancing the model’s capacity to generalize and adapt to overarching patterns in the data, rather than focusing on isolated block-specific distinctions.
Perceptual dynamics: computational modeling
To model the data, we formulated a computational model rooted in foundational tenets of the Bayesian brain theory to estimate the dynamics of individual perception through the experiment. Specifically, we employed a one-dimensional state space model, which leads to time-dependent perception, based on the Kalman filter96. Notably, a similar model has found application within the realm of human perception studies29. The directed acyclic graph structure97,98 as depicted in Fig. 8a graphically illustrates the connections between different parameters and variables. The relevant data employed in this investigation includes the size estimation data ({{mathsf{Size}}}_{ij}^{{mathsf{All}}}) of all stimuli in both acquisition and generalization stages (i ∈ {1, . . . , 80} refers to the participant, j ∈ {1, . . . , 180} refers to the trial).
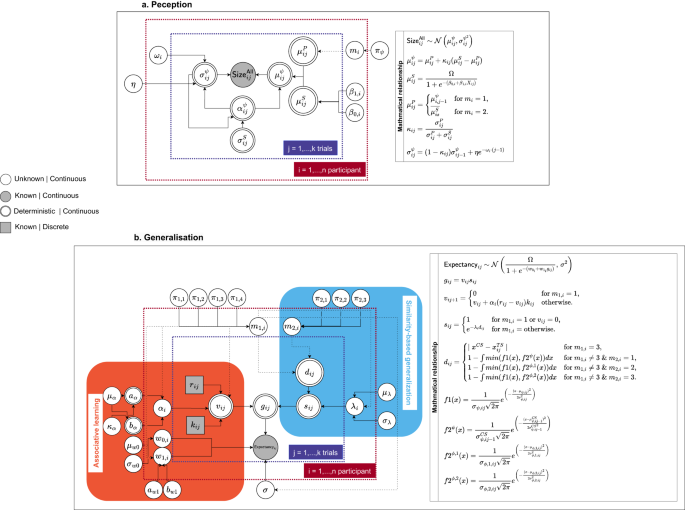
The graphical relationship among variables and parameters in the model for the computational models of perception (a) and generalization (b).
Central to the model is the concept that, at any given temporal instance, two key perceptual sources jointly contribute to shaping the prevailing perception: the sensory likelihood and the perceptual prior. The dominance of either source in shaping perception is contingent upon the relative uncertainty inherent in each source. Moreover, as individuals gain more perceptual experiences, there exists the potential for a gradual reduction in the uncertainty of the perceptual prior, consequently leading it to exert a more pronounced influence on the ongoing perception. In essence, with the current model, the idiosyncratic, inferential and probabilistic nature of perception is underscored, with a continuously evolving interplay between perceptual expectations (prior) and incoming sensory information.
The sensory likelihood in the model encapsulates the process of translating sensory inputs into psychological values, effectively capturing the overarching patterns inherent in the physical-perceptual relationship. A non-linear logistic function with two scaling parameters β0,i and β1,i is implemented to capture the diverse possibilities of this physical-perceptual relationship:
where the superscript S refers to the sensory information. With sensory uncertainty, the sensory translation is formulated as a normal distribution:
Here, the variable Ω denotes the range of the measurement scale. In the context of this study, the size estimation measurement falls within the range of [0, 200], which implies that Ω equals 200. The variable Xij denotes the physical quantity of presented stimulus (50.80 to 119.42 mm, spaced at intervals of 7.624 mm). The parameter ({sigma }_{iq}^{S}) represents sensory uncertainty, where q = 1 corresponds to the threat-associated stimulus, and q = 2 corresponds to other stimuli. Higher sensory uncertainty implies a stronger tendency to prone to perceptual prior, and vice versa. We computed the proportion of sensory uncertainty for the fear-conditioned (({sigma }_{i1}^{S})) and other (({sigma }_{i2}^{S})) stimuli ((frac{{sigma }_{i1}^{S}}{{sigma }_{i2}^{S}+{sigma }_{i1}^{S}})) to investigate whether the threat-associated stimulus elicits varying degrees of reliance on prior information compared to the stimulus without threat. A proportion value exceeding 0.5 indicates that fear-conditioned stimulus elicits a higher susceptibility to the perceptual prior, and conversely.
Regarding the perceptual prior, we tested two assumptions concerning its source. The first assumption posits that the perceptual prior corresponds to the mean of the most recent perceptual distribution, expressed as ({mu }_{ij}^{P}={mu }_{i,j-1}^{psi }) (corresponding to the well-known Bayesian adagio: ‘yesterday’s posterior is today’s prior’, where μψ denotes the mean of the perceptual posterior). The second assumption posits that the perceptual prior is intrinsically linked to the mean of the sensory transformation, establishing ({mu }_{ij}^{P}=overline{{mu }_{is}^{S}}). In this context, the perceptual prior mean is constant across trials j for each individual i, reflecting the averaged sensory transformation across all stimuli s. To discern which assumption garners stronger support from the data, a mixture structure has been integrated within the model, enabling the data to potentially stem from either of the two assumptions:
The probability parameter πψ governs the extent to which each assumption receives support from the data.
Simultaneously considering the perceptual likelihood and prior, the iterative updating process initiates the formation of the current perceptual distribution, amalgamating the internal world belief with the incoming sensory information. Driving the updating mechanism for the perceptual mean is the Kalman gain κij, encapsulating the relative uncertainties linked to the two perceptual sources:
with
At each time point, the current mean of perception ({mu }_{ij}^{psi }) is the sum of the current perceptual prior mean ({mu }_{ij}^{P}) and the weighted difference between the translation of the ongoing sensory input ({mu }_{ij}^{S}) and the current perceptual prior ({mu }_{ij}^{P}). The determination of the weighting parameter, the Kalman gain κij, hinges on the ratio of the uncertainty of the present perceptual prior and the sum of the ongoing sensory translation and perceptual prior. Notably, the Kalman gain κij ranges between 0 and 1, with values exceeding 0.5 implying a stronger influence of the ongoing sensory information on the current perception, while values below 0.5 indicate that the perceptual prior serves as the primary driver for the current perception.
Given the absence of system process noise, the current internal uncertainty, denoted as ({sigma }_{ij}^{psi }), is presumed to decrease with the accumulation of perceptual experiences29, as outlined by the expression ((1-{kappa }_{ij}){sigma }_{i,j-1}^{psi }). However, recognizing the empirical complexities surrounding the notion of the perceptual prior gradually outweighing the perceptual likelihood and considering the unanswered empirical questions about the source of the perceptual prior, we introduced system process noise into the updating process. This step accounts for the possibility that individuals may consistently lean more toward relying on the perceptual likelihood.
Subsequent to the updating process, the model will estimate a perceptual mean ({mu }_{ij}^{psi }) and standard deviation ({sigma }_{ij}^{psi }) at each time point. Consequently, the perception at time j for individual i, denoted as ψij, is assumed to follow a normal distribution characterized by these two parameters:
The model incorporates a multilevel structure that comprehensively integrates individual and group-level information for parameter inference. The individual-level prior and the group-level hyperprior employed in this study are shown in Table 2. In light of the limited understanding of the process under investigation, we employed weakly informative hyperpriors in this study.
Links to fear generalization behavior
For the final investigation, our objective is to explore whether the individual dynamics of perception and perceptual memory influence fear generalization behavior (panel b, Fig. 8). To accomplish this, we modified the previously constructed computational model in generalization49, which dynamically integrates associative learning53 and similarity-based generalization processes6,7.
The relevant data employed in this investigation includes the US expectancy data ({{mathsf{Expectancy}}}_{ij}) (i ∈ {1, . . . , 80} refers to the participant, j ∈ {1, . . . , 180} refers to the trial), the estimated perceptual mean ({mu }_{ij}^{psi }), and standard deviations ({sigma }_{ij}^{psi }) derived from the computational model of perception, and the individial perceptual memory mean ({mu }_{iklm}^{{phi }_{1}}) (k ∈ {1, 2} signifies S3 or S8, l ∈ {1, 2} represents CS+ or CS+, and m ∈ {1, 2, 3, 4, 5} denotes the five blocks) and ({mu }_{iklm}^{{phi }_{2}}) and standard deviation ({sigma }_{im}^{{phi }_{1}}) and ({sigma }_{im}^{{phi }_{2}}) estimated with the size reproduction (ϕ1) and estimation data (ϕ2) in the memory task.
The fundamental assumption of the model is that, at each time point, individuals generalize their previous learning to the next context based on their generalization tendency and either the physical distance or perceptual distance between the newly encountered stimulus and the previously learned context. The model quantifies previous learning through individual learning speed and the disparity between the current expectation and the actual outcome, known as the prediction error.
At the very beginning, with no ongoing learning, individuals are assumed to have no expectations (vij) about the stimulus-outcome relationship (vij = 0). The speed at which individuals update their expectations of the stimulus-outcome relationship is embedded in the learning rate parameter α ∈ [0, 1]. The outcome variable is denoted as rij (rij ∈ [0, 1] for the CS+ and rij ∈ [−1, 0] for the CS−). The prediction error is then calculated as ∣rij − vij∣. Since we assume that learning only occurs during the trials of the conditioned stimuli, another variable kij is used to represent the occurrence of CS(s). When there is a new interaction with the conditioned stimulus, the expectation vij will be updated:
In the context of threat learning, we denoted the predictive strength of threat (i.e., excitatory strength) as ({v}_{ij}^{+}), where ({v}_{ij}^{+}in [0,1]). Conversely, in safety learning, we denoted the predictive strength of threat absence (i.e., inhibitory strength) as ({v}_{ij}^{-}), where ({v}_{ij}^{-}in [-1,0]).
Once an expectation is established (∣vij∣ > 0), it can be transferred to newly encountered contexts with the aid of the generalization rate parameter λi. The generalized associative strength is assumed to exponentially decrease with the increasing stimuli distance. Hence, a higher value of λi indicates less generalization behavior, and vice versa:
In the context of the differential learning paradigm in this work, the parameter gij is constrained within the range of [−1, 1]. This constraint arises from the interaction between excitatory and inhibitory generalized strengths, expressed by the equation ({g}_{ij}={v}_{ij}^{+}{e}^{-{lambda }_{i}{d}_{ij}^{+}}+{g}_{ij}{v}_{ij}^{-}{e}^{-{lambda }_{i}{d}_{ij}^{-}})99.
In Yu et al.49, the model incorporates a mixture structure to identify latent groups based on patterns of generalization behavior. In situations where learning does not occur, individuals are identified as Non-Learners (m1,i = 1), leading to vij consistently being 0. This prevents the generalization process, as there is no acquired associative strength to be extended. If learning occurs (∣vij∣ > 0), yet the generalization tendency is excessively strong due to an extremely small generalization rate λi, individuals are identified as Overgeneralizers (m1,i = 2). In this case, 70% of the learned associative strength persists even when encountering the most distant stimulus. For these two latent groups, the generalized response remains independent of the stimulus distance dij.
In instances where both learning and generalization processes operate normally, the model investigates the degree to which generalized patterns align more with the physical stimulus features (Physical Generalizers, m1,i = 3) or the perceived stimulus features (Perceptual Generalizers, m1,i = 4). For Physical Generalizers, the stimulus distance between the currently encountered stimulus (TS) and the conditioned stimuli (CSs) is determined as follows:
where dij is the physical distance (xCS represents the physical coordinate of the conditioned stimulus (CS), while ({x}_{ij}^{TS}) signifies the physical coordinate of the currently encountered stimulus (TS) on trial j).
Conversely, Perceptual Generalizers function uniquely within the perceptual dimension, introducing an additional mixture component in this study to compare three assumptions regarding perceptual distance. First, the perceptual distance is characterized by the overlapping region between the current perceptual distribution and the most recently encoded CS(s) perceptual distribution (m2,i = 1). Second, the perceptual distance is represented by the overlapping region between the current perceptual distribution and the memory distribution estimated by the size reproduction data in the memory task (m2,i = 2). Third, the perceptual distance is depicted by the overlapping region between the current perceptual distribution and the memory distribution estimated by the size estimation data in the memory task (m2,i = 3):
where f1 is the perceptual distribution and f2 is the perceptual memory distribution. In order to determine the overlapping regions of two distributions, involving the calculation of the integral encompassing the minimum of their respective probability density functions across the entire range, we employed a numerical approximation method using Monte Carlo simulation. This approach involved generating a set of random points within the defined range, enabling the estimation of the proportion of points that fell within the overlapping region. This method allowed us to provide an estimate of the corresponding area without resorting to direct integration.
The final step in the generalization model involves transforming the latent response into the observed response. To achieve this, a sigmoid function is applied to map the latent generalized expectation gij to the consistent behavioral measurement scale of the US expectancy response:
here, in this study, the US expectancy response is measured on a scale ranging from 0 to 100, denoting Ω = 100.
The presumed distribution of the final generalization response follows a normal distribution, where θij serves as the mean:
Similar to the computational model on perception, this model also adopts a multilevel structure to account for information across various layers. In addition, we employed a weakly informative hyperprior to signify our limited understanding of the underlying process, as illustrated in Table 3.
Statistical inference
All statistical inferences for the analysis were conducted using the Gibbs sampling method through JAGS100, employing Markov Chain Monte Carlo (MCMC). The analyses were executed with specific settings: four MCMC chains were run, each comprising 100,000 iterations. To ensure sampling stability and optimize data storage, a burn-in period of 75,000 iterations and a thinning factor of 10 were employed, resulting in 10,000 retained samples per parameter ((frac{100,000-75,000}{10}times 4)).
Convergence of parameter sampling was evaluated through visual inspection for irregular chain patterns and by checking the (hat{R}) value, which was required to be below 1.1, based on Gelman and Rubin diagnostics101,102.
For all post-sampling analyses, the statistical computing language R103 was utilized, along with the R package jagsUI104 to interface with JAGS in R.
Responses