The significance of free light-chain ratio in light-chain monoclonal gammopathy of undetermined significance: a flow cytometry sub-study of the iStopMM screening study
Introduction
Light-chain (LC) monoclonal gammopathy of undetermined significance (MGUS) is a precursor to LC-multiple myeloma (LC-MM), amyloidosis, and related plasma cell disorders (PCD) [1, 2]. It is characterized by abnormal serum free light-chain (FLC) levels without a detected monoclonal immunoglobulin (M protein) of heavy-chain type and the absence of any evidence of MM-related end organ damage [1, 3]. In contrast to other MGUS entities presenting with an M protein, the key diagnostic factor for LC-MGUS—abnormal FLC levels—only indirectly implies underlying monoclonality. Moreover, it does not provide evidence of the developmental stage in B cell differentiation, as in distinguishing between IgM and non-IgM MGUS [4]. In light of recent evidence suggesting that the reference intervals used for the standard definition of LC-MGUS [5] are inaccurate and potentially resulting in a high-rate of false positive diagnoses [6, 7], we recently proposed a revised definition of LC-MGUS which includes novel reference intervals for FLC that are based on results from the Iceland Screens, Treats, or Prevents MM study (iStopMM) and factors in age and renal function [8, 9]. We found the prevalence of LC-MGUS to be 0.27% in individuals aged 40 years and older when applying the revised FLC intervals, compared to a prevalence of 1.54% when applying the standard FLC intervals [9].
Assessing the risk of progression from LC-MGUS to more advanced PCD presents challenges, particularly since FLC measures are the only blood-based disease biomarker. Therefore, current risk models for progression in MGUS, based in part on M protein concentration and isotype, do not apply to LC-MGUS [10]. Smoldering MM (SMM) defines a higher risk precursor state than MGUS [3, 11, 12], which is particularly relevant given the increasing evidence supporting early intervention in high-risk, asymptomatic individuals [13, 14]. However, the definition of LC-SMM [15] has not been well established, partly due to the replacement of urine protein electrophoresis by more sensitive FLC measurements [16]. To address this, we recently described the first screened cohort of LC-SMM and proposed an updated definition consisting of abnormal FLC levels together with >10% PC in the bone marrow (BM) and overcomes the inconvenience and ineffectiveness of using urine measurements of monoclonal proteins [17]. Ultimately, there is a need for studies evaluating prognostic markers specifically for LC MGUS to direct the management of these individuals, including different levels of FLCs [10], immunoparesis [12], and flow cytometry analysis of PC in the BM [18].
Using flow cytometry, clonal PC can be discriminated from their normal counterparts and quantified with high sensitivity. This method has been shown to be reliable and have significant prognostic value when assessing treatment response in MM [19,20,21]. Although not routinely employed in clinical assessment of MM precursors, it has been shown to have diagnostic and prognostic value in this context [18, 22, 23]. Considering the limitations of current diagnostic factors for LC-MGUS, the use of flow cytometry could enhance diagnostic precision and facilitate more refined risk stratification by offering direct evidence of monoclonality.
Here, we used flow cytometry analysis to determine clonal PC presence in BM samples from individuals with LC-MGUS in relation to the standard and revised definitions. Furthermore, this approach enabled us to evaluate the predictive value of FLC ratio for underlying clonal PC and its prognostic implications.
Methods
Participants
Participants were recruited from the iStopMM study, a population-based screening study for MM and its precursors and a randomized trial of follow-up strategies. In total, 80,759 Icelanders born in 1975 or earlier and were alive in late 2016 (54.4% of the eligible population) gave their informed consent. Among these, 75,422 underwent screening by serum protein electrophoresis and FLC assay. Inclusion in the three-armed randomized trial of follow-up strategies was based on the detection of M protein and/or pathological FLC ratio together with elevated involved FLC. Specifically, pathological FLC ratio was defined as deviating from the standard reference range of 0.26–1.65 [5]. Elevated FLC concentration was defined as greater than 38.93 mg/L for kappa-involved FLC and 35.85 mg/L for lambda-involved FLC. These cutoffs in FLC concentrations were derived from the FLC distribution in the first 10,000 screened samples and were employed as study-specific reference values. The randomized trial comprised Arm 1, where participants were not informed of their screening results; Arm 2, where participants received follow-up care according to current guidelines [24]; and Arm 3, which involved a more intensive follow-up protocol, including BM sampling for all participants. Those with evidence of advanced disease at screening, characterized by M protein of 3.0 g/dL or more, or an involved/uninvolved FLC ratio of 100 or higher, were not randomized and received uniform intensive follow-up in the study. All participants in active follow-up were invited to the iStopMM clinical center for assessment and sampling at least annually. This included peripheral blood sampling for FLC and serum protein electrophoresis at every visit, and BM sampling at initial diagnostic work up and at 5-year follow-up for all in Arm 3 and non-low risk MGUS in Arm 2, and annually for those diagnosed with a smoldering disease. BM sampling was also performed when clinically indicated. At every BM sampling, the bone marrow plasma cell (BMPC) count was evaluated in both aspirate smear and trephine biopsy, with the higher BMPC count of the two methods used to guide follow-up. BM samples were collected for flow cytometry analysis of PC in a conveniency sample of participants called in to the iStopMM clinic for clinical assessment that included BM sampling. This included both individuals with MGUS that were randomized for active follow-up and those with diagnoses of more advanced PCD, which were prioritized for flow cytometry sampling. Serum creatinine measures were used to calculate estimated glomerular filtration rate (eGFR) using the Chronic Kidney Disease Epidemiology Collaboration (CKD-EPI) equation [25]. The design of the iStopMM study has been described in more detail elsewhere [26].
Ethics approval and consent to participate
The study was approved by the Icelandic National Bioethics Committee (no. 16–022, 26 April 2016) and by the Icelandic Data Protection Agency. All participants provided signed informed consent in accordance with the Declaration of Helsinki.
Study design
The study was conducted in two phases. The first phase included individuals who tested positive for LC monoclonal gammopathy (MG) by screening and had BM sample collected for flow cytometry analysis of PC. The flow cytometry analysis was used to determine the presence or absence of clonal PC and their detection status was correlated with clinical features and evaluated for concordance with the revised definition of LC-MGUS [8, 9]. Additionally, the detection status of clonal PC was correlated with the FLC ratio in paired samples, aimed to establish an optimal FLC ratio threshold to effectively differentiate between individuals with and without underlying clonal PC population in the BM. Due to the high rate of clonal PC detection in samples from individuals with lambda-involved FLC ratio, which limited the ability to establish a clear relationship between the two variables for those samples, this threshold was confined to individuals with kappa-involved FLC ratio.
The second phase focused on the clinical implication of the established FLC ratio threshold and was limited to individuals with LC-MGUS who were actively monitored for progressive disease as part of the iStopMM randomized trial of follow-up strategies (Arms 2 and 3). This phase included two analyses that stratified individuals according to the FLC ratio threshold at screening: First, a longitudinal assessment of FLC ratio evolvement as an indicator of progressive disease; and second, assessing the incidence of more advanced PCD during follow-up. The overall design of the study is presented in Fig. 1.
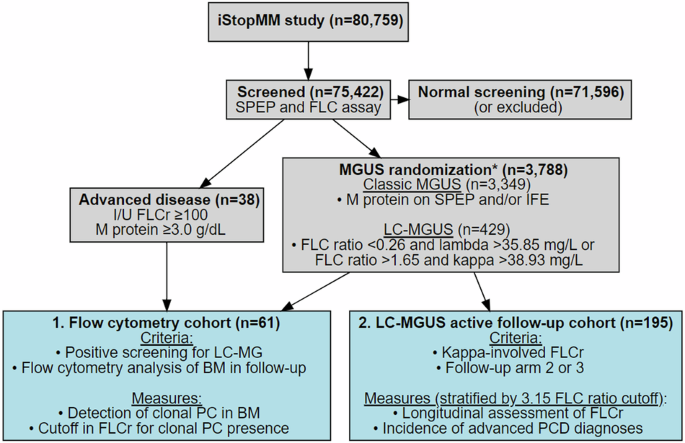
The gray boxes outline screening for monoclonal gammopathies in the iStopMM study, and the blue boxes define the cohorts used in different analyses and are numbered in order of results. *Five individuals were excluded from randomized follow-up (four due to previously diagnosed lymphoproliferative disorders that were not known at the time of randomization, and one who withdrew consent). SPEP serum protein electrophoresis, FLC(r) free light-chain (ratio), I/U involved/uninvolved, MGUS monoclonal gammopathy of undetermined significance, LC light-chain, MG monoclonal gammopathy, PC plasma cell, BM bone marrow, PCD plasma cell disorder.
Immunophenotypic studies
EDTA-anticoagulated BM aspirated samples, collected at a target volume of 2–4 mL, were stained with the EuroFlow next-generation flow cytometry MM-minimal residual disease (MRD) panel [20], using antibody kits (Cytognos S.L., Salamanca, Spain, cat: CYT-MM-MRD8) together with the EuroFlow recommended drop-in antibodies CD138-BV421 (BD Biosciences, San Jose, CA, USA cat: 562935) and CD27-BV510 (BioLegend Inc., CA, USA, cat: 302835) [20]. Samples were processed within 24 h of collection according to EuroFlow standard operating procedures for sample preparation and staining (available at www.euroflow.org) [27], and acquired on a single FACSCanto II flow cytometer (BD Biosciences). The Infinicyt™ software (Cytognos) was used for flow cytometry data analysis. Clonal PC were identified by their unique aberrant immunophenotype together with light-chain restriction, based on previously established immunophenotypic criteria [20, 28, 29]. The limit of detection (LOD) was defined as the detection of ≥20 clonal PC, with the LOD for each sample calculated as 20 divided by the total number of nucleated cells analyzed.
Statistical methods
The Wilcoxon ranked-sum test and the Kruskal-Wallis test were employed to assess the statistical significance of differences observed for quantitative variables between two and more than two groups, respectively.
Pearson correlation coefficient was employed to evaluate the relationship between FLC ratio and the ratio of kappa to lambda PC in paired BM samples. Log10-transformed was applied to normalize the distribution of both variables. For individuals with kappa-involved FLC ratios, logistic regression was used to assess the association between FLC ratio and clonal PC presence in BM. Additionally, receiver operating characteristic (ROC) curve analysis was used to assess the predictive ability of FLC ratio for clonal PC presence and to determine optimal cutoff value for FLC ratio, maximizing sensitivity. All individuals meeting either the standard [5] or revised [8, 9] definition of LC-MGUS were identified from the total screened iStopMM participants (N = 75,422) to evaluate the proportion of individuals with FLC ratio above and below the observed optimal cutoff for clonal PC presence within the two diagnostic criteria.
Two analyses were conducted to evaluate the clinical significance of the FLC ratio threshold, associated with clonal PC presence in the BM. These analyses were limited to individuals with positive screening for LC-MGUS, had kappa-involved FLC ratio, and were randomized for active follow-up within the iStopMM study. In the first analysis, a linear mixed-effects model was used to assess the evolution of FLC ratio, separately for those with FLC ratio >1.65 to 3.15 and those with FLC ratio >3.15 at screening. The models assessed the log2-transformed fold-change in FLC ratio in repeated samples relative to the screening sample, which facilitated interpretation of results as proportional changes. The models, adjusted for age at screening, sex, and eGFR at screening, included a random effect for individual variation, with data censored at MM treatment initiation or loss to follow-up. The second analysis assessed the incidence of PC and lymphoproliferative disorder diagnoses in the same FLC ratio stratified groups, with diagnoses recorded at the last clinical assessment.
The R software was used for all statistical analyses and data visualization, including packages pROC, lmerTest, ggplot2, and DiagrammeR [30,31,32,33,34].
Results
In total, BM samples from 61 individuals with positive screening for LC-MG were analyzed by flow cytometry for detection of clonal PC. The median age was 67 years (range: 43–89 years), 43 (70.5%) were males, and the median eGFR was 72.3 mL/min/1.73 m2 (IQR: 60.5–84.8 mL/min/1.73 m2). There were 42 (68.9%) who had kappa-involved FLC ratio, with median of 7.57 (IQR: 2.85–29.0), and 19 (31.1%) had lambda-involved FLC ratio, with median of 0.0560 (IQR: 0.0253–0.107). The diagnosis distribution at the time of flow cytometry was 28 LC-MGUS, 24 LC-SMM, 8 LC-MM, and 1 solitary bone plasmacytoma with minimal marrow involvement (SPM). BM samples were collected for flow cytometry at a median of 10 months (range: 2–79 months) post screening, with a median achieved LOD of 2.8 × 10⁻⁶ (range: 1.3–9.5 × 10⁻⁶) (Table 1).
In total, 195 individuals with kappa-involved LC-MGUS were actively monitored for progression as part of the iStopMM randomized trial of follow-up strategies, including 1042 FLC measurements. The median age was 71 years (range: 43–92 years) and 118 (60.5%) were male. The median FLC ratio was 2.07 (IQR: 1.77–4.71) and the median eGFR was 63.0 mL/min/1.73 m2 (IQR: 36.3–82.2 mL/min/1.73 m2). Overall, the median follow-up period from screening to last sampling visit was 55 months (range: 4–84 months) (Table 1).
Detection of a clonal plasma cell population in bone marrow samples from individuals with light-chain monoclonal gammopathies using multiparameter flow cytometry
Overall, clonal PC were found in BM samples from 48/61 (78.7%) individuals with LC-MG. Clonal PC were detected in 15/28 (53.6%) samples from individuals with LC-MGUS, including 12/24 (50.0%) with kappa-involved FLC and 3/4 (75.0%) with lambda-involved FLC. Clonal PC were detected in all samples (33/33; 100%) from individuals where the clinical assessment at the time of flow cytometry indicated a more advanced PCD than LC-MGUS (24 LC-SMM, 8 LC-MM and one with SPM). The median percentage of total PC was significantly higher (0.52% vs 0.19%; p < 0.001) in LC-MGUS individuals with a detected clonal PC population compared to those without. Furthermore, the median percentage of total PC and clonal PC (both as relative to nucleated cells and PC) increased progressively from LC-MGUS to LC-SMM, and to LC-MM (p < 0.001 for all comparisons) (Table 2).
Of the 28 individuals with LC-MGUS, 17 (60.7%) met the revised LC-MGUS criteria at screening. The overall concordance between the revised criteria and clonal PC detection was 85.7% (24/28), with clonal PC found in 82.4% (14/17) of the samples from individuals meeting the revised criteria and in 9.1% (1/11) of samples from those who did not. The individual where clonal PC were detected and did not meet the revised criteria had abnormal FLC ratio but normal free kappa levels as per the revised criteria (diagnostic factors: FLC ratio = 3.35; free kappa = 52.5 mg/L; age < 70; and eGFR ≥ 60 mL/min/1.73 m2).
All but one clonal PC population detected predominantly lacked CD19 expression. In the single LC-MGUS individual were clonal PC expressed CD19, they coexisted with a large (37% of nucleated cells) kappa-restricted (98.0% of mature B cells) mature B cell population and was subsequently diagnosed with unspecified B cell lymphoma.
The association between free light-chain ratio and presence of clonal plasma cells in bone marrow of individuals with light-chain monoclonal gammopathy
For the 61 individuals with positive screening for LC-MG evaluated for clonal PC presence by flow cytometry, FLC levels were measured in paired serum samples. The median involved/uninvolved FLC ratio increased progressively with more advanced MG diagnosis at the time of flow cytometry from 3.46 (range: 1.29–41.5; n = 28) in LC-MGUS, to 24.6 (range: 2.87–70.8; n = 24) in LC-SMM, to 163 (range: 47.2–1278) in LC-MM (p < 0.001), and was 13.3 for the single SPM individual. Of the 28 individuals with LC-MGUS, 24 had kappa-involved FLC ratio which was observed to be significantly greater for those individuals with clonal PC detected in paired BM samples, with median FLC ratio of 4.52 (range: 2.78–41.5; n = 12), compared to the median FLC ratio of 2.13 (range: 1.49–4.96; n = 12) for those where clonal PC were not detected (p < 0.001). The single LC-MGUS case with lambda-involved FLC ratio where clonal PC were not detected had less skewed FLC ratio of 0.774, compared to a median FLC ratio of 0.21 (range: 0.04–0.24; n = 3) in those with detected clonal PC (Table 2). Across the total of paired serum and BM samples, a high degree of correlation was observed between the FLC ratio and the ratio of kappa to lambda PC (Pearson R = 0.95, p < 0.001) (Fig. 2).
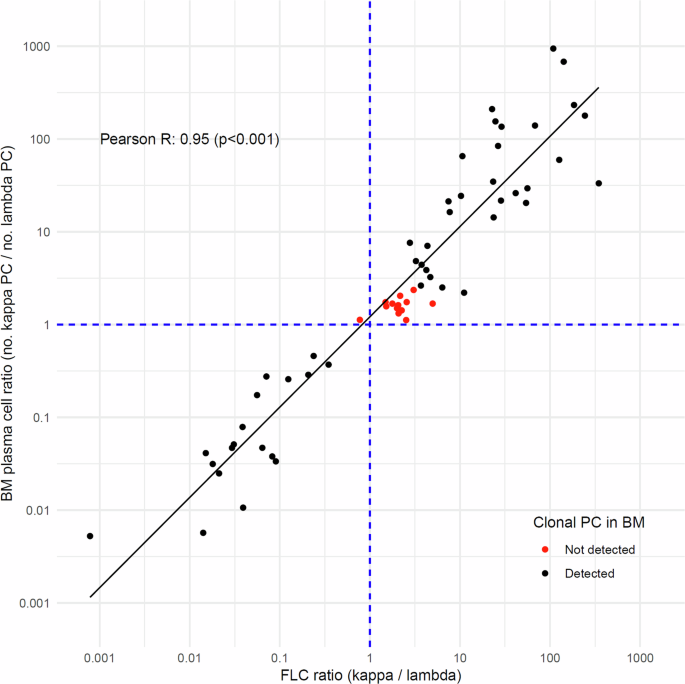
The figure displays the relationship between the log10-transformed values of serum FLC ratio (x-axis) and the kappa-to-lambda plasma cell ratio in corresponding BM samples (y-axis) (n = 61). Individual samples are represented by points, with black indicating the presence and red indicating the absence of clonal PC detection in BM samples. A linear regression line demonstrates the trend in the data. The dashed blue lines at x = 1 and y = 1 serve as reference lines. The Pearson correlation coefficient and p-value are included in the plot.
The predictive ability of FLC ratio for a presence of clonal PC population in BM was evaluated for 42 paired serum and BM samples from individuals with kappa-involved FLC only. FLC ratio was found to be significantly predictive of clonal PC in the linear regression model (Odds ratio=5.75 (per unit of FLC ratio); p < 0.05; n = 42). This observation was further supported by ROC curve analysis (area under the curve = 0.98; n = 42), identifying FLC ratio of 3.15 as the optimal cutoff with sensitivity of 96.7% and specificity of 91.7%. When applied to the total screened iStopMM cohort, 1748/1899 (92.0%) of individuals with kappa-involved LC-MGUS according to the standard criteria and 22/127 (17.3%) with kappa-involved LC-MGUS according to the revised criteria had FLC ratio ≤3.15 at screening.
Clinical significance of>1.65 to<3.15 free-light chain ratio: Longitudinal assessment of light-chain MGUS individuals
At screening, individuals with an FLC ratio between >1.65 and 3.15 (n = 124) were significantly older than those with an FLC > 3.15 (n = 71), with a median age of 74 years vs 69 years (p < 0.01). They also had lower median eGFR (48.5 vs 79.6 mL/min/1.73 m2; p < 0.001), with lower proportion of individuals with preserved kidney function (eGFR ≥60 mL/min/1.73 m2) (40.3% vs 78.9%; p < 0.001) (Table 3).
For the 124 participants with FLC ratio between >1.65 and 3.15 at screening, no significant change in FLC ratio was observed over time (yearly estimate: 0.011; SE = 0.0058; p = 0.059). Conversely, for the 71 participants with FLC ratio >3.15, a significant increase in FLC ratio was detected over time (yearly estimate: 0.069; SE = 0.012; p < 0.001) (Fig. 3).
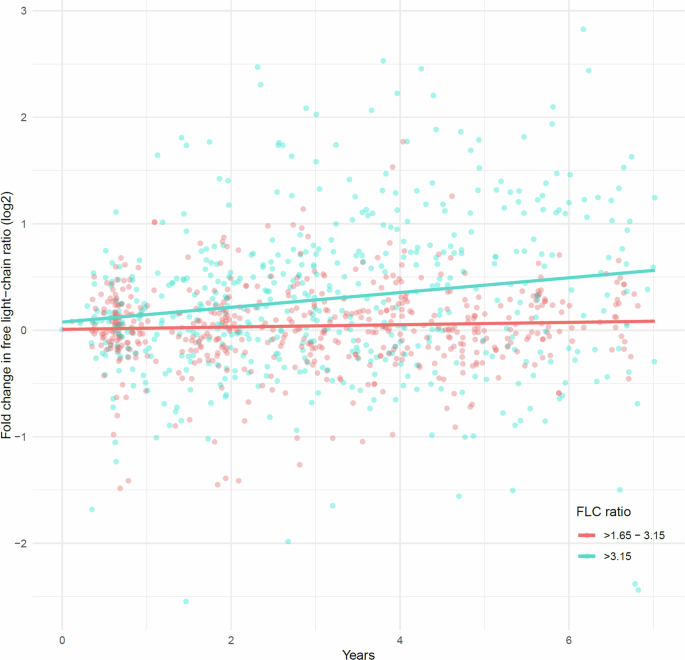
The figure depicts the log2-transformed fold-change in FLC ratio over time for repeated samples relative to the initial screening. This log transformation allows for proportional representation of changes centered at zero. Stratification is based on the FLC ratio cutoff of 3.15 at screening, with red dot representing 531 repeated samples from 124 individuals with an FLC ratio >1.65 to 3.15, and blue dots 511 repeated samples from 71 individuals with an FLC ratio >3.15. The corresponding lines indicate the effect on fold-change in FLC ratio, fitted separately for each group using a linear mixed-effects model, accounting for individual-level variation, and adjusted for age, sex, and eGFR. For the >1.65 to 3.15 (red line) group, the time effect estimate (years) was 0.011 (p = 0.056), and for the >3.15 (blue line) the estimate was 0.069 (p < 0.001). The median time from screening to the last sample was 54 months and 62 months, with a median of 4 and 6 repeated samples per individual, respectively.
During follow-up, none of the 124 individuals with FLC ratio >1.65 to 3.15 progressed to MM and none were diagnosed with a more advanced PCD than LC-MGUS. In contrast, 4/71 (5.6%) of individuals with FLC ratio >3.15 progressed to MM at median of 33 months (range: 17–45 months) after screening. Additionally, 16/71 (22.5%) were diagnosed with a more advanced precursor (15 with LC-SMM and 1 with smoldering Waldenström macroglobulinemia) during follow-up. Overall, 4 individuals were diagnosed with lymphoproliferative disorders, two with chronic lymphocytic leukemia, and single diagnoses of B cell and T cell lymphomas (Table 3).
Discussion
In this study, based on screening 75,422 individuals for MG in the iStopMM study, we utilized flow cytometry to assess clonal PC presence in BM samples from participants with LC-MG. We found that LC-MGUS, when defined by standard criteria with FLC ratio in the range of >1.65 to 3.15, was associated with absence of clonal PC. Furthermore, individuals within this specific FLC ratio range maintained stable FLC ratio levels over time and none was diagnosed with more advanced PCD during median follow-up of over 4.5 years. These findings highlight the significance of FLC ratio as marker for PC monoclonality and indicate that adjusting the kappa-involved FLC ratio threshold could lead to overall decrease in diagnoses that are not clinically relevant, focusing monitoring efforts to those at increased risk of developing active malignancy.
Through sensitive next-generation flow cytometry analysis, we observed a notable absence of clonal PC in 46.4% of LC-MGUS individuals, in contrast to the consistent detection of clonal PC in individuals presenting with clinical features associated with more advanced disease, including LC-SMM, LC-MM, and SPM. The immunophenotypic profiles of these clonal PC populations was predominantly characterized by lack of CD19 expression, which is consistent with prior findings in non-IgM MG [35, 36]. Interestingly, in one case, flow cytometry analysis revealed a clonal PC population expressing CD19 and which coexisted with an expanded light-chain restricted mature B cell population. This individual was subsequently diagnosed with B cell lymphoma, potentially indicating a rare instance of lymphoplasmacytic lymphoma with LC involvement [37]. Previous studies have identified LC-MGUS as a precursor to LC-MM and AL amyloidosis [1, 2]. However, the identification of other non-PC related lymphoproliferative diseases in our study, suggests that, although primarily associated with the presence of clonal PC as seen in MM [1, 38], abnormal FLC levels may reflect clonal expansion of antibody secreting cells at different stages in B cell development associated with broader B cell lymphoproliferative disorders [37, 39,40,41,42], likely representing a subset within the LC-MGUS diagnostic criteria.
Our analysis revealed that the FLC ratio is a robust indicator of clonal PC presence specifically for individuals with kappa-involvement. We identified that a FLC ratio threshold of 3.15 effectively distinguished clonal PC presence with high sensitivity and specificity. The ability of FLC ratio to reflect the PC compartment in BM is further indicated by the high correlation with the ratio of kappa to lambda PC across all evaluated samples. Applying the threshold to the total screened iStopMM cohort revealed that 92.0% of participants who met the standard criteria for kappa-involved LC-MGUS had an FLC ratio within the FLC ratio range of >1.65 to 3.15, found to be associated with the absence of clonal PC. These observations are in line with growing evidence which challenges the accuracy of the standard FLC reference intervals for diagnosis of LC-MGUS, suggesting that they lead to overdiagnosis of LC-MGUS with kappa-involved FLC ratio [6,7,8,9]. Our recently proposed revised FLC intervals [8, 9], aimed to increase the diagnostic accuracy for LC-MGUS, was found to be in high concordance with clonal PC presence. Moreover, only a minimal fraction (7.4%) of those meeting the revised definition for kappa-involved LC-MGUS had FLC ratio ≤3.15, suggesting its relevance in distinguishing true underlying monoclonal PCD. These results suggest that clonal PC are absent in large proportion of kappa-involved LC-MGUS individuals when defined by FLC ratio >1.65 and that diagnostic accuracy is improved by adaptation of the revised FLC reference intervals, which seem to isolate higher proportion of individuals with true underlying malignancy related to PC monoclonality.
We assessed the clinical significance of FLC ratio 3.15 threshold among LC-MGUS actively monitored for progressive disease as part of the iStopMM randomized trial of follow-up strategies. Those with FLC ratio >1.65 to 3.15 at screening maintained a stable FLC ratio over time, used as indicator of progressive disease, and none progressed to a more advanced PCD (including light-chain amyloidosis), during a follow-up period over 4 years. In contrast, individuals with >3.15 demonstrated a significant increase in FLC ratio over time, together with a relatively high incidence of advanced PCD precursor diagnoses, including 4/71 (5.6%) individuals progressing to LC-MM during follow-up. Of note, individuals identified as intermediate-risk or high-risk SMM within the iStopMM study are offered MM treatment as part of an early intervention treatment trial (ClinicalTrials.gov identifier: NCT03815279) which may limit the incidence of MM in this cohort. These findings imply that LC-MGUS diagnosed with an FLC ratio >1.65 to 3.15, likely represents condition with minimal clinical significance, questioning the necessity of monitoring disease progression for this subgroup. However, longer follow-up is essential to determine long-term implications in relation to these findings.
The primary strength of this study lies in the large cohort of individuals with LC-MG identified through a population-based screening in the iStopMM study. This included analysis of BM samples, utilizing a sensitive and standardized flow cytometry assay, providing valuable insights into PC monoclonality in relation to diagnostic factors in LC-MG. Additionally, the thorough follow-up within a clinical trial framework, which included regular sampling and clinical assessments, provided robust evaluation of the clinical relevance of the FLC ratio threshold observed.
The insights of the study are somewhat constrained by the overrepresentation of individuals with kappa-involved FLC ratio in the iStopMM study, based on standard pathological FLC ratio reference values [9]. Additionally, with the high detection of clonal PC in BM samples from individuals with lambda-involved FLC ratio (18 of 19 samples), a relationship between FLC ratio and clonal PC presence could not be established for this group. Several factors might have affected the detection of clonal PC: BM sample quality and hemodilution, uneven distribution of PC in the BM, and conventional limitations of the flow cytometry assay, such as the potential lack of phenotypical aberrancy in clonal PC not detected by the markers used. Furthermore, the dataset was not sufficiently large to thoroughly investigate the influence of age and kidney function on the relationship between FLC ratio and the presence of clonal PC. We observed that individuals without detected clonal PC were more likely to have increased age and reduced kidney function, which are associated with a more skewed kappa-involved FLC ratio. Despite this, the proposed cutoff of >3.15 was identified as highly sensitive in predicting clonal PC. This is consistent with the revised normal FLC reference ranges, as the proposed cutoff is either above or within the upper end of these ranges for individuals with impaired kidney function (e.g., eGFR <30 mL/min/1.73 m2: 0.54–3.30) or advanced age (≥ 70 years: 0.45–2.59) [8, 9], supporting its applicability in these populations.
In summary, this study leveraged flow cytometry analysis to assess the presence of clonal PC in BM from individuals with LC-MGUS, establishing a correlation with the FLC ratio. We found that LC-MGUS with FLC ratio in the range of >1.65 to 3.15 was associated with an absence of clonal PC and non-progressive disease. These insights challenge the accuracy of the standard FLC ratio intervals, suggesting that they lead to overdiagnosis of kappa-involved LC-MGUS. Consequently, our findings advocate adopting the more stringent kappa-involved FLC ratio threshold of >3.15 as an indication of underlying PC monoclonality, for more accurate identification of individuals at increased risk of developing symptomatic PCD.


Responses