The significant impact of hot isostatic pressing on the corrosion behavior of Ti-6Al-4V alloy prepared by electron beam powder bed fusion

Introduction
Additive manufacturing (AM) is a technology that can rapidly process the shape of complex workpieces with the aid of computer. At the same time, the benefits such as high flexibility, short production time, small material loss and zero mold cost can be used for fabricating biomedical devices. Ti-6Al-4V is the most widely used in the biomedical field. Extensive studies have shown that AM Ti-6Al-4V alloy exhibits excellent mechanical properties and biocompatibility1,2,3,4,5.
It is well known6,7,8,9,10,11,12 that metallic materials would corrode during their service in corrosive environment, and therefore, corrosion resistance is a primary consideration in the selection of a material. In view of the different microstructures obtained by rapid solidification during AM process, the AM-fabricated titanium alloy component demonstrates different corrosion performance from the conventionally produced components. Therefore, extensive attention has been given to the influence of microstructure on the corrosion behavior of AM components. For example, Seo et al. 13 investigated the corrosion properties of Ti-6Al-4V alloy fabricated by directed energy deposition (DED), and their results indicate that pitting is mainly determined by acicular α‘ martensite in the alloy. Dai et al. 14 studied the influence of heat treatment on the corrosion behavior of Ti-6Al-4V samples prepared by laser powder bed fusion (L-PBF) and found that the corrosion rate decreases with the decrease of heat treatment temperature, and the passivation performance decreased resulting from the increase in grain size. Yang et al. 15 reported that the corrosion resistance of L-PBF-produced Ti-6Al-4V alloy significantly improved after appropriate heat treatment (e.g., heat treatment at 750 °C for 2 h) because of the decomposition of martensite into a fine lamellar mixture of α and β phase. Chandramohan et al. 16 also reported the improved corrosion and wear resistance of L-PBF manufactured Ti-6Al-4V alloy after heat treatment than prior heat treatment. It was believed that heat treatment exerted a more impact than the printing direction in determining wear resistance and corrosion resistance. Gong et al. 17 reported that the corrosion resistance of Ti-6Al-4V alloys fabricated by EB-PBF in 1 mol/L hydrochloric acid solution increased in the sequence of 45° < 90° < 55° < 0° (column axis deviating from the build direction), which was attributed to the higher content of β-phase and its better corrosion resistance. The corrosion occurred at grain boundaries, and grain orientation of the EB-PBF sample did not play a dominant role in influencing its corrosion resistance. In addition, defects induced by high thermal gradient and rapid cooling rate in AM process, i.e., pores, lack of fusion (LOF), cracks, and inclusions18,19, may also influence the corrosion performance of AM components. Although significant endeavors have been made to study the effect of microstructure on the corrosion performance of AM titanium alloy components, the majority of studies investigated the effect of a certain microstructural characteristic on corrosion performance. The correlation between the effects of various characteristics, such as porosity, phase composition, grain orientation, and so on, on the corrosion performance still remains less understood.
To improve their fatigue properties for long-term applications, AM titanium alloys are usually subjected to post-processing treatments. Amongst them, hot isostatic pressing (HIP) refers to the process of sintering and densification of the sample by applying an isotropic pressure (up to ~200 MPa in most cases) to the sample in a closed vessel, while applying high temperature (>0.7 melting point). The application of HIP can close internal pore defects, accompanied by coarsening the morphology of AM titanium alloys. Since the microstructure of metals is an important factor affecting their corrosion resistance18,20, the hole closure and lamellar coarsening caused by HIP are likely to impact the corrosion performance. To sum up, it is essential to investigate the effect of HIP treatment on the corrosion performance of additively manufactured titanium alloys for engineering applications. In this work, the influence of HIP treatment on the electrochemical behavior of Ti-6Al-4V alloy prepared by EB-PBF in artificial saliva solution was studied. The passivation mechanism of as-fabricated and HIPed EB-PBF Ti-6Al-4V alloy was elucidated in terms of the microstructure, composition, semiconductor properties, defect diffusion ability, formation mechanism of passive film.
Results
Microstructure
The XRD patterns of the studied EB-PBF Ti-6Al-4V samples are shown in Fig. 1. The most characteristic peaks correspond to the α-phase and a small amount of β-phase. And it can be seen that the A0 and B0 samples have a higher content of β-phase than the A90 and B90 samples and HIP treatment led to an increase in β-phase content in B0 and B90 samples. In this work, the B90 sample was HIPed at a higher temperature (~940 oC) closed to β-α transition temperature and a pressure of 120 MPa. The high pressure may decrease the β-α transition temperature21 and high temperature provides the sufficient diffusion process for phase transformation, which may enhance the β phase formation in HIPed samples22,23.

XRD patterns of as-fabricated and HIPed EB-PBF Ti-6Al-4V samples.
Fig. 2 shows the metallographic structure of the studied Ti-6Al-4V samples. The A0 and A90 samples are dominated by equiaxed and columnar grains, respectively. Lamellar α-phase and β-phase with small size between adjacent α-phase layers are observed in the A0 and A90 samples, and no α‘-phase is noted. After HIP treatment, the α-phase in B0 and B90 samples significantly coarsens, which is mainly due to the high heat treatment temperature (940 ± 20 °C) and low cooling rate after the heat treatment19.
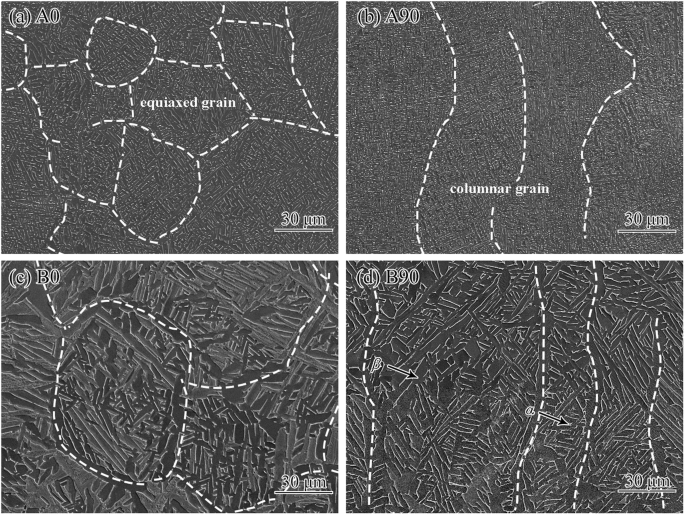
The metallographic structure of the as-fabricated (a, b) and HIPed (c, d) EB-PBF Ti-6Al-4V samples.
As shown by CT analysis in Fig. 3, a large number of pore defects are detected in the as-fabricated samples, and the A90 sample has slightly greater porosity than A0 sample. HIP treatment significantly decreases the number and size of pore defects in B0 and B90 samples (Fig. 3 and Table 1).
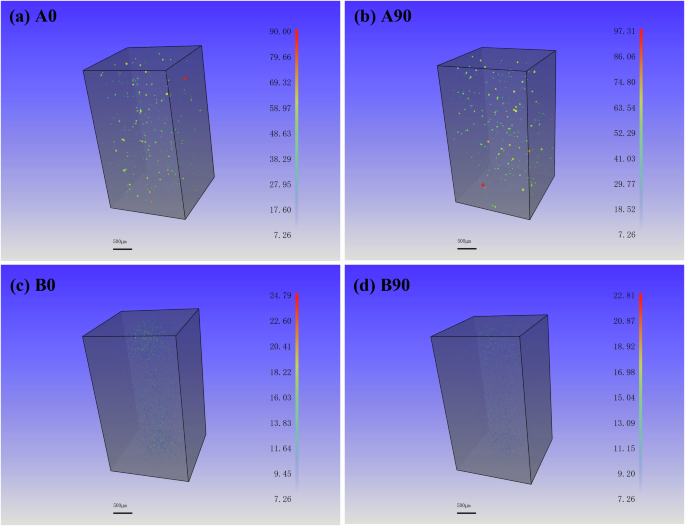
a A0, b A90, c B0 and d B90.
The texture characteristics were analyzed using EBSD. In the process of data collection, it can be seen that the content of β-Ti increases after HIP by analyzing the content of α-Ti and β-Ti. The inverse pole figures (IPFs) of the studied samples are shown in Fig. 4. As seen from this figure, the grain orientation of A0 and B0 is most (0001), while the A90 and B90 samples have columnar crystals approximately parallel to the processing direction. After HIP treatment, more grains oriented close to the (0001) plane are observed in the B0 and B90 samples, but the columnar grains are significantly reduced.
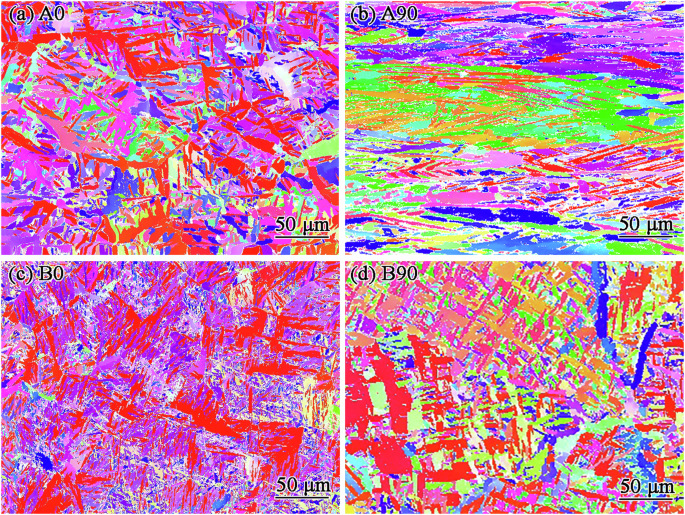
a A0, b A90, c B0 and d B90.
The α-phase polar figures of the studied samples are shown in Fig. 5, and it is clear that the A0 and A90 samples have strongest texture in the (0001) crystal plane orientation. After HIP treatment, the texture strength of B0 and B90 sample is enhanced but the nature of texture remains unchanged (Table 2). The data collection results of α-Ti and β-Ti in the studied samples also indicated that the content of β phase increases by about 40% after HIP treatment.
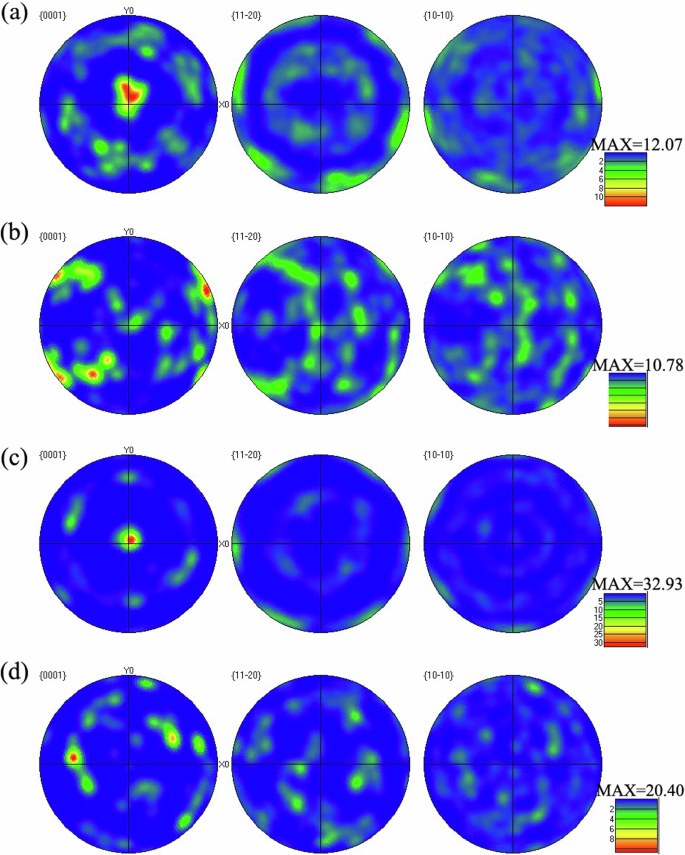
a A0, b A90, c B0 and d B90.
Passive film formation
The formation of passive film was studied by monitoring the current density at constant potential as a function of time. Fig. 6 shows the log (current) – log (time) plots of Ti-6Al-4V samples at potentials of 0.6 to 1.0 VSCE. The trend of all curves was similar. The current density slowly decreases with time and eventually reaches a stable value, which means the passivation film grows and becomes compact on the sample surface. Sometimes, the passive film may dissolve. In a diffusion-controlled process24, a dense inner oxide layer and a loose outer oxide layer can be formed on the EB-PBF Ti-6Al-4V alloy surface.
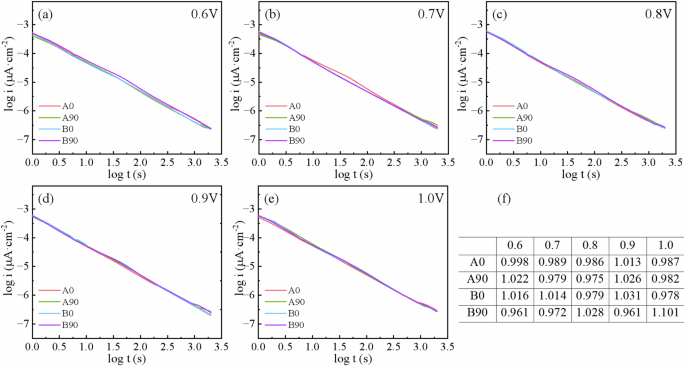
a–e Double-log plots of current-time, f the fitted slope of the plot.
The growth kinetic equation of the passive film can be obtained from the MacDonald model as follows25:
where i is the current density, t is the passivation time, and A and n are constants. The value of the slope n of the curve in Fig. 6a–e indicates the mass of the passive film. When the slope approaches −1, it indicates the formation of a dense protective passive film on the surface of the sample [26]. The slope of the curve was fitted for all the samples and summarized in Fig. 6f. The results show that at each applied potential, the fitted current density is very close, that is, a quasi-stable oxide film is formed on the sample surface at the applied potential. In addition, the density of the passive film on the surface of the as-fabricated sample is slightly higher, as the slope of the curves of the studied samples is closer to −1. So, the performance of the passive film on the surface of A0 and B0 samples is superior to that of A90 and B90 samples.
Semiconductor properties of passive film
Since the damage of the passive film mainly depends on the point defect, the point defect model (PDM)26 is adopted in this work to describe the process of the growth and breakdown of the passive film, which can also explain the influence of the electrostatic field on the migration of the point defect. According to the PDM model, vacancy density and vacancy diffusion coefficient DO are the two key parameters affecting the electrochemical properties and corrosion resistance of passive films, and since vacancies are point defects responsible for ion transport, the DO controls the growth kinetics of passive films. A typical linear region with a positive slope on the M-S plots indicates that the passive film of the studied sample is a n-type semiconductor, i.e., the oxygen vacancy is the existing form of the electron donor.
The electrical properties of the passive film were analyzed by the Mott-Schottky (M-S) method and the vacancy density was deduced. Fig. 7 shows the M-S curves in the ASS at 37 °C and 0.6 to 1.0 VSCE for studied EB-PBF Ti-6Al-4V samples, respectively. Based on M-S theory27:
where C is the capacitance of the passive film/electrolyte interface, CH is the capacitance of the Helmholtz layer, ε is the compositional complexity of the passive film(the main component of the passive film on the sample surface is TiO2, and the ε is taken to be 6028), ε0 is the vacuum dielectric constant, e is the electronic charge, ND is the donor density in the passive film, E is the film-forming potential, EFB is the flat-band potential, k is the Boltzmann constant and T is the absolute temperature. For n-type semiconductors, the donor concentration in the passive film can be calculated from the slope of the M-S plot. The ND values of passive films at different film-forming potentials for the studied EB-PBF Ti-6Al-4V samples are listed in Table 3. The results show that ND of all the samples decreases with the increase of E, which indicates that the corrosion resistance of the sample will increase with the decrease of the conductivity of the passivated film.
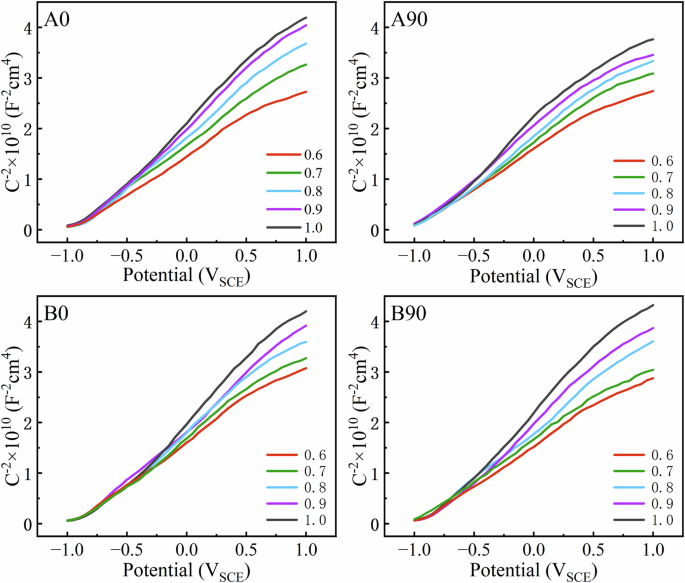
a A0, b A90, and c B0, d B90.
Semiconductor properties of passive film
From the measured parameters in the M-S equation, the ND can be calculated, and based on this, the oxygen vacancy diffusion coefficient (DO) of the passivation film on the sample surface can be deduced, as follows29:
where ({omega}_{2}=frac{{i}_{{rm{p}}}{RT}}{4{rm{e}}F{varepsilon}_{{rm{L}}}{D}_{{rm{O}}}},) thus ({D}_{{rm{O}}}=frac{{i}_{{rm{p}}}{RT}}{4{rm{e}}F{varepsilon}_{{rm{L}}}{omega}_{2}})where R is the gas constant (8.314 J∙mo−1), F is the Faraday constant (96485 C∙mol−1), ω1, ω2 and b are constants determined by the relationship between ND and E. Fig. 8a, b shows the ND of the studied EB-PBF Ti-6Al-4V samples in ASS, and the ω2 values can be directly obtained from the Eq. 3. The calculated values of the studied samples are shown in the figure. The average electric field strength εL can be calculated from the relationship between the steady-state thickness Lss and E, as follows:
where α is the polarizability of the solution/passive film (α = 0.530), B is a constant. Lss is the thickness of the passivation film which is estimated from EIS measurements. Since electrochemical impedance produces almost pure capacitive behavior at frequencies above 1 kHz31, the Lss value can be obtained from the equation:
where ε, ε0 and A are constants. Thus, the LSS of the passive film can be deduced by the capacitance C. Fig. 8c, d) shows the thickness of passive film of the studied samples at different film-forming potentials. In general, there is no significant difference in the thickness of passive film on the surface of the A0 and A90 samples, and the thickness increases with the increase in potential. HIP treatment slightly decreases the thickness of the passive film. The value of εL obtained from the slope of the fitted line is summarized in Table 4. It is seen from the table that the higher value of εL, the thinner is the passive film on the surface. The quasi-steady-state current-density ip can be obtained from the i-t curves. Based on ip, εL and ω2 obtained above, DO at different films forming potentials can be calculated, and the results are shown in Table 3. In general, DO is related to the growth and breakdown of passive film, while the higher the DO, the higher the breakdown sensitivity rate of the passive film31. Obviously, the DO value of the passive film on the surface of the HIP samples is higher, which leads to faster growth of the passive film on its surface and easier breakdown.
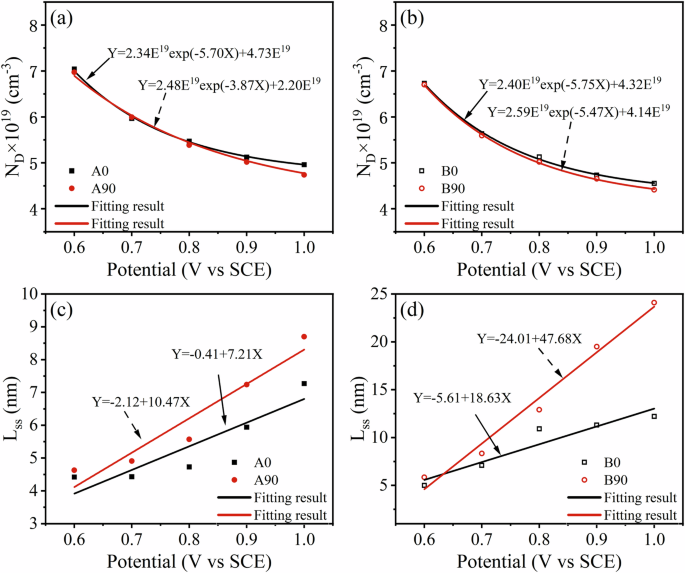
a, b Donor densities and c, d thickness.
Sine the oxygen vacancies and cation interstitials need to pass through the passive film to circulation and transport to achieve the growth and destruction of the passive film. Therefore, the film growth kinetics can be expressed by the following formula32:
where Ω is the molar volume per cation, NA is the Avogadro’s number, and J is the vacancy flux. According to Fick’s first law, the concentration gradient and the potential gradient can affect the diffusion rate of charged particles in an electric field, which is given by:
where JC and JP are the fluxes due to the concentration gradient and the potential gradient, respectively. Considering that the test electrolytes are in a similar steady state, JC is treated as a constant, i.e., J is mainly determined by the JP, and is given by29,32:
where qi is the charge of the species (qi = 2e), K is defined as (K,=frac{{F}_{varepsilon }}{{RT}}), and ε is the dielectric constant of the passive film. Since qi, F, R, and T are constants, the value of Jp is determined only by the ND, the DO, and the ε. Based on the above analysis, Jp was calculated from Eq. 8 and the results are listed in Table 3. Since the growth rate after the formation of the passive film is determined by the flux of oxygen vacancies, the higher diffusion flux would lead to a faster growth rate of the passive film, which in turn leads to a limited time for the atoms/ions to diffuse to the “right” location and more defects in the passivating film are created. In summary, the growth rate of the passive film on the surface of the sample is increased by HIP. However, since the passive film on the surface of the as-fabricated sample is denser and the corrosion rate is lower, the corrosion resistance of the as-fabricated sample is better.
XPS analysis of passive film
The passive film on the sample surface was characterized by XPS. Fig. 9 shows the spectra corresponding to Ti 2p, Al 2p, and V 2p ionization at 0, 2, 6, 10, 16, 22, and 28 nm depths for EB-PBF Ti-6Al-4V samples, and there is no significant difference in the composition of the passive film for the four samples. The XPS spectra at 0 nm clearly show that the outermost surface of the passive film of the four samples mainly contained ideal oxides (TiO2 and Al2O3). With the sputtering time increases, the peak positions of Ti 2p and Al 2p spectra shift toward lower binding energies, which indicates the presence of a reduced valence state of the sub-oxides. At the sputtering depth of 10 nm, a peak corresponding to titanium metal (Ti°) with a value of 454.1 eV was detected in the A90 and B90 samples, but not by A0 and B0. The majority of aluminum in the passive film is in the form of alumina (Al3+) until the depth of 16 nm, where Al atoms appear. However, no peaks associated with oxides appeared in the V 2 d spectra. This is due to the fact that the -ΔGΘ values of the three metal elements follow the order: Al > Ti > V. As a result, the formation of V oxides is less likely at low oxygen content. In summary, the surface passive film on the studied four samples is a mixed oxide, consisting mainly of TiO2 and Al2O3 as well as some sub-oxides TiOx and AlOy (0 ≤ x ≤ 2, 0 ≤ y ≤ 1.5). Moreover, according to the XPS depth analysis, the film thickness of A0 and B0 surfaces is greater than 10 nm, and that of A90 and B90 is slightly less than 10 nm.
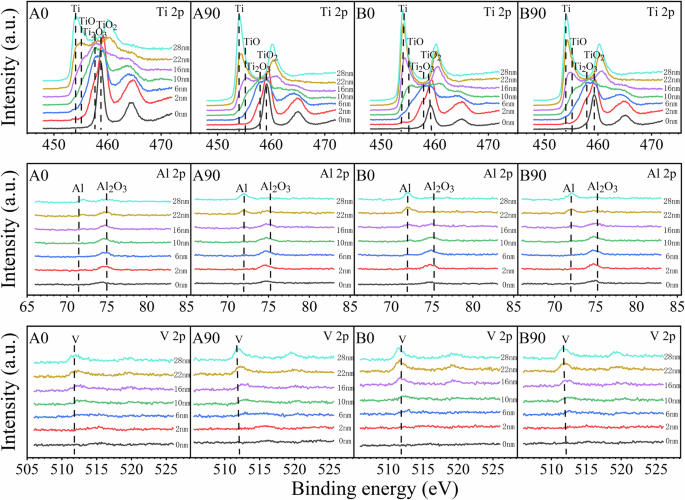
XPS spectrum for A0, A90, B0, and B90 samples at different sputtering depths (0,2,6,10,16,22,28nm) after 1800s of passivation at 0.6 VSCE in artificial saliva solution at 37 °C.
Since the surface passive film of Ti-6Al-4V sample prepared from EB-PBF is mainly composed of Ti oxide, the Ti 2p3/2 spectra of 0 nm, 2 nm, 6 nm, and 10 nm were quantitatively analyzed on the basis of the peaks of fitted XPS spectrum to derive the components in Fig. 10. It can be seen that the outermost layer is composed of TiO2. As the sputtering depth is increased to 2 nm, the spectral peak of Ti 2p is decomposed into two peaks corresponding to TiO2 and Ti2O3, respectively. Moreover, after HIP, the content of TiO2 lowers slightly and the content of Ti2O3 increases. With the increase in sputtering time, the fraction of TiO2 and Ti2O3 in the oxide film decreases and the TiO content increases, whereas Ti atoms appear in the A90 and B90 samples at the sputtering depth of 10 nm.
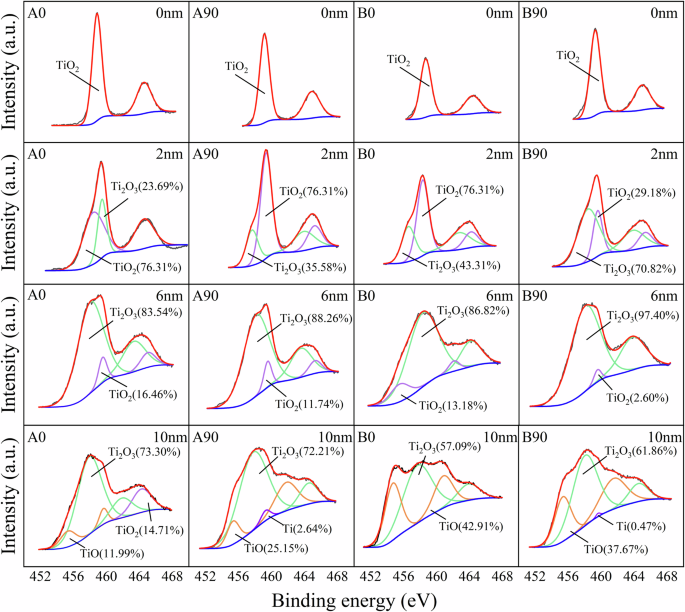
XPS spectrum of Ti 2p3/2 for as-fabricated state (A0.A90) and hot isostatic pressure state (B0,B90) at sputtering depth of 0 nm, 2 nm, 6 nm, and 10 nm of passive film, which were promoted potentiostatically at 0.6 VSCE for 1800s in artificial saliva solution at 37 °C.
Based on the above results, it is concluded that compared to A90 and B90 samples, A0 and B0 samples have a thicker passive film on their surface. After HIP treatment, the thickness of the passive film changes slightly, but the content of high valence oxides in the passive film decreases. TiO2 in the passive film can effectively improve the crystallization characteristics of the passive film33, thereby improving the protective properties of the passive film. It can be deduced that after HIP treatment, the corrosion resistance of the passive film formed on the surface of the sample decreases, which is consistent with the results obtained from M-S measurements after constant potential polarization in the previous section.
Discussion
Based on the electrostatic potential polarization and XPS results, combined with the PDM model, Fig. 11 shows the formation and destruction of the passive film of the Ti-6Al-4V samples prepared by EB-PBF in ASS solution. In Fig. 11, the various defect symbols in the process are represented separately according to the Kröger-Vink notation6,34: TiTi and AlTi are titanium ions and aluminum ions in the passive film, VO, VTM and VAM are the oxygen vacancy, titanium ions and aluminum ions in the passive film, Oo is the oxygen ions on the anionic sites of the passive film, VTi is the vacancy in the sample, ({{rm{Ti}}}_{({aq})}) and ({{rm{Al}}}_{({rm{aq}})}) are the titanium ions and aluminum ions in solution.
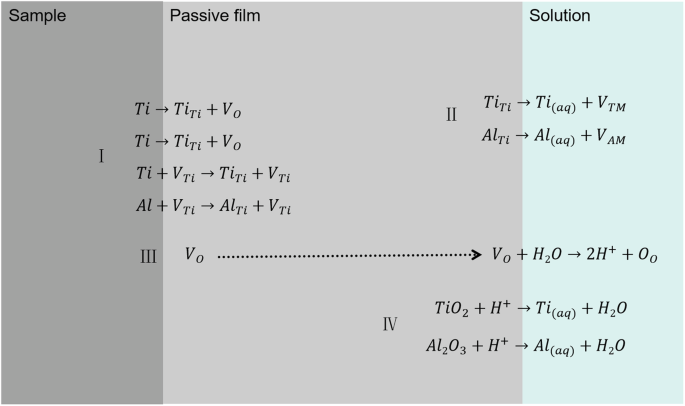
Schematic illustration of the formation and dissolution of passive film formed on Ti-6Al-4V samples prepared by EB-PBF in ASS solution in terms of point defect model.
Four main reactions occur during corrosion of titanium alloys in corrosive solutions in the following order:
-
(I)
Ti/Al atoms in the sample enter the passive film due to passivation and oxygen uptake reactions and become TiTi/AlTi. At the same time Ti/Al atoms enter the passive film by exchanging with ({{rm{V}}}_{{rm{Ti}}}^{cdot })/VTi and produce TiTi/AlTi in the passive film. Both reactions occur at the metal/passive film interface.
-
(II)
TiTi or AlTi in the outer layer of the passive film enters the solution as Ti(aq) and Al(aq) because of thermal motion. At the same time, VTi is generated at the original position of TiTi or AlTi.
-
(III)
As the thickness of passive film increases, oxygen at the metal/film interface is reduced, which leads to incomplete oxidation of the metal ions. As a result, a large amount of VO is generated within the passive film and migrates to the film/solution interface to react with water to form H+ and OO.
-
(IV)
TiO2 and Al2O3 in the outer layer of the film react with H+ in solution to generate Ti(aq) and Al(aq) and water.
Amongst the above listed reactions, reaction (I) represents the formation of the passive film, reaction (IV) shows the dissolution of the passive film, and reactions (II) and (III) involve the movement of ions across boundaries during passivation. Similar process of passive film formation on titanium and titanium alloys is reported in the literature6,35.
Since the formation of the passive film is a diffusion-controlled process36, and the diffusion of VO is obviously faster than VM6, a large number of VM aggregated at the metal/passive film interface, which further accelerated the formation of the passive film (I). In addition, since the charge of Al3+ in the passive film is smaller than that of Ti4+, oxygen vacancies are inevitably generated in the passive film to maintain local electrical neutrality37. Thus, Al2O3 within the passive film also indicates a continuous transition of Al3+ and electron vacancy pairs of metallic Al at the metal/passive film interface (I). This results in an increase of the concentration gradient of VO and, thus, the oxygen diffusion coefficient. Therefore, the pristine state samples generally have high oxygen diffusion coefficients at different potentials (Table 3). It is suggested that the high content of TiO2 in metallic titanium passive film has significant crystallinity, which improves the protective properties of the passive film38. In addition, Al has a higher affinity compared with Ti, and Al3+ will stay in the reduced TiO2 at the adjacent site and combine with one or two Ti3+ at the adjacent site, so Al3+ ions will replace Ti lattice39,40, and is the underlying reason for the some penetration of Al2O3 in the TiO2 matrix.
In this work, the corrosion behavior of as-fabricated and HIPed Ti-6Al-4V samples prepared by EB-PBF was explored. Due to the high chemical activity of Ti41, Ti-6Al-4V samples prepared by EB-PBF show typical passivation in ASS solution. Since the passive film formed on all the studied samples shows similar chemical and phase compositions, it implies that the samples have similar electrochemical processes during corrosion. Therefore, the quality of the passive film on the surface of the samples plays a major role in their corrosion resistance. The quasi-steady-state current density is related to ion migration in the passive film, and is affected by the JC and the JP during diffusion of oxygen vacancies42. It is known that the concentration of oxygen vacancies is close to the parts of Ti3+ and Ti2+ in passive film6. Since the concentration of oxygen vacancies in the passive film is close to the sum of the concentrations of Ti3+ and Ti2+, the value of JC can be evaluated from the concentration content of Ti3+ and Ti2+ at different depths. According to the principle of electrically neutral principle, a Ti3+and Ti2+ ion can generate (or stabilize) one and two VO at a location43. At identical depths and the same angle, the number of parts of Ti3+ and Ti2+ of the as-fabricated samples is not significantly different from the HIPed samples, so the JC difference between the as-fabricated and the HIPed samples is not obvious. Thus, JP dominates ion migration in the passive film, and the value of Jp is directly proportional to the ND and the DO. In this work, A0 and A90 have a large ND and a smaller DO (Table 3), and from Eq. 8, it is deduced that the as-fabricated sample possesses a smaller JP. That is, the current density required to form and maintain the passive film on the surface of the as-fabricated sample is smaller, which also indicates lower passive film dissolution rate. The experimental data is consistent with the above calculation results and the as-fabricated samples have a low quasi-steady-state current density in electrostatic potential polarization tests and a low passive current density in potentiodynamic polarization tests. In general, the quasi-steady-state current can be regarded as the ratio of the applied potential to the resistance on the passivation film, so that lower current densities tend to correspond to larger resistances6. As a result, a thinner, more compact, and larger resistance passive film was formed on the surface of the as-fabricated samples compared to the HIP samples. Thus, the corrosion resistance of the EB-PBF samples is reduced after HIP treatment. After HIP, the α-phase of EB-PBF sample is coarsened, the content of β-phase increases (Fig. 1), the size and number of the internal holes of the samples decrease (Fig. 2), and the type of the texture remains unchanged but the strength of the texture at the (0001) plane increases (Fig. 4). All these variations may influence the corrosion performance of the studied samples. The internal relationship of these factors on the corrosion performance of HIPed samples is discussed as follows:
Pore defects
As we all know, the passive film at the defect is weak, and crack initiation will occur preferentially, which leads to a decrease in the corrosion resistance of the sample44,45. In this work, after HIP treatment, the internal defects of the samples are reduced and the size becomes smaller (Table 1), but their corrosion resistance is not significantly improved by the elimination of these defects. The HIPed sample shows a lower corrosion resistance than the as-fabricated sample. Therefore, the change in pores defects by HIP treatment is not the main factor that influences the corrosion performance of HIP samples.
β-phase
In the Ti-6Al-4V alloy, the α-phase and β-phase can produce an electric potential difference in the corrosion medium due to their different composition7. When electrochemical corrosion occurs, the α-phase at the α/β-phase interface is preferentially dissolved, and the passive film formed on the β-phase is more stable than that formed on the α-phase. Meanwhile, the higher density of β grain boundaries can effectively improve the stability of the passive film46. However, when the fraction of β-phase is low and the distribution is discontinuous, it can also play an important role in reducing the corrosion resistance as a cathode, and the corrosion is more likely to occur at the grain boundaries17. In this work, A0 and B0 samples contain a higher β-phase content (Fig. 1), demonstrating superior corrosion resistance compared with A90 and B90 samples. After HIP treatment, the B0 and B90 samples have higher β-phase content than A0 and A90 samples, respectively. However, they do not show better corrosion resistance (Fig. 1). This suggests that other factors instead of β-phase may play a dominant role in influencing the corrosion properties of HIPed sample.
Texture
It was reported that the dissolution activation energy of dense surfaces is higher than that of loose surfaces47, which requires higher activation energy to dissolve and is, therefore, more resistant to corrosion. Some studies reported that the dense substrate in the bulk material does have a lower activation energy, but this is not true for the surface of the material. Corrosion rate should be more focused on surface energy. Ren et al. 48 found that the (0001) plane of CP-Ti is more corrosion resistant than the ((10bar{1}0)) and ((11bar{2}0)) planes. Fu et al. 49 calculated the surface energy of HCP-metals and found that for titanium, the surface energy increases in order of (011), (010), (011) and (110) planes. Hoseini et al. 50 confirmed that texture is the main reason for controlling the corrosion properties of commercial pure titanium. Amirnejad et al. 51 found that the effect of grain orientation on corrosion performance is still applicable to the rolled Ti-6Al-4V alloy, and the surface along the parallel rolling direction has better corrosion resistance. The lower the surface energy, the more stable the surface state and the better the corrosion resistance of the material. Since the surface energy of (0001) plane is lower than that of ((10bar{1}0)) and ((11bar{2}0)) planes, in this work, A0 and B0 samples with more (0001) crystal faces have better corrosion resistance. Therefore, the A0 and B0 samples demonstrate better corrosion resistance. After HIP, the texture strength of the two samples at the (0001) plane increases, but the corrosion resistance decreases. Therefore, the texture has a great influence on the corrosion performance, but it is not a main factor for reduced corrosion resistance of the HIP samples.
Morphology of α-phase
Previous studies indicated that the corrosion resistance of AM titanium alloy components is closely related to the morphology of the constituent phase. The corrosion resistance of equiaxed grains is slightly greater than columnar grains, and the columnar grain boundaries preferentially dissolve compared to the equiaxed grain boundaries52. In addition, the majority of reported results indicated that grain refinement may improve the corrosion resistance of titanium alloys. This is because of the high grain boundary density by grain refinement, which increases the nucleation rate of the passive film and the growth rate of the ideal oxide TiO2. The higher donor density and oxygen diffusion coefficient lead to the superior quality of the passive film on the surface of fine-grained titanium alloy, thus hindering the dissolution of the film52,53,54. In this work, the A0 and B0 samples display equiaxed grains, and the A90 and B90 samples have columnar grains. Therefore, the A0 and B0 samples are more resistant to corrosion than the A90 and B90 samples. After HIP treatment, the grain size increases significantly (Fig. 1), so that the as-fabricated samples with fine α-lamellar has better corrosion resistance than the HIPed samples. Based on the above results, it is concluded that the morphology of α-and β-phase is the dominant factor for the decrease in the corrosion resistance of the HIPed sample.
The above analyses show that, although the texture, pore defects, phase composition, and morphology all influence the corrosion performance of EB-PBF Ti-6Al-4V alloy samples, the morphology has more influence than other factors. The solidification process of AM is complicated, which leads to the unique microstructure and defect characteristics of the component. On analyzing the corrosion performance of AM components, only considering a certain factor is considered may lead to incorrect or even contradictory results. For example, Dai et al. 14 investigated Ti-6Al-4V prepared by L-PBF and found that the corrosion current density and corrosion rate increased with the increase of heat treatment temperature, but the corrosion resistance decreased. However, Hemmasian et al. 55 concluded that the L-PBF Ti-6Al-4V alloy, after similar heat treatment, demonstrates comparable corrosion resistance to the commercial grade. They also found that the L-PBF-prepared samples have high pitting density, which decreases as increasing the heat treatment temperature. Therefore, in order to accurately analyze the corrosion resistance of AM titanium alloy, the discussed factors should be considered comprehensively to analyze their cumulative effect on the corrosion performance of AM titanium alloy.
In conclusion, the formation and properties of the passive film on EB-PBF Ti-6Al-4V alloy surface were investigated to understand the corrosion mechanism. The conclusions are drawn as follows:
-
(i)
After HIP treatment, the α-phase of the EB-PBF Ti-6Al-4V sample was coarsened, and the β-phase content was increased, while the size and number of pores in the alloy were decreased. The proportion of grains with (0001) plane increased significantly, but the texture type remained unchanged.
-
(ii)
The surface passive film of as-fabricated Ti-6Al-4V samples prepared by EB-PBF mainly consisted of ideal oxides (TiO2 and Al2O3), and some sub-oxides TiOx and AlOy (0 ≤ x ≤ 2, 0 ≤ y ≤ 1.5). After HIP treatment, the TiO2 content decreased, and the growth rate of the surface passive film increased, resulting in an increase in the internal defect density of passive films.
-
(iii)
After HIP treatment, the coarsening of α-grain decreased the growth of passive film and content of TiO2 because of lower grain boundary density, which led to inferior quality of the passive film on the sample surface and decreased the corrosion performance of the EB-PBF processed alloy. Compared with the variation of texture, pores, and phase content by HIP treatment, the coarsening of α-grains seems to play a dominant role in determining corrosion performance.
Methods
Materials
The EB-PBF Ti-6Al-4V samples with dimensions of 12 × 12 × 12 mm3 blocks were fabricated by ArcamA1 system (Sweden). The EB-PBF preparation was carried out in vacuum at 10−4 mbar with a voltage of 60 kV, an electron beam size of 200 μm, and helium as the regulating gas control. For each layer, the powder bed was scanned 11 times using a beam with a current of 30 mA and a scan speed of 1500 mm s−1 and heated up to 730 °C before melting. The 3D model was designed by Magics 17.0 software (Materialize, Leuven, Belgium), and then the melt scanning to print the component layer by layer. Table 5 shows the chemical compositions of as-fabricated EB-PBF samples. The rectangular-shaped plates with the size of 10 mm × 10 mm × 1 mm were cut by wire from the block along parallel (90o) and perpendicular (0o) to the build direction for the electrochemical measurements, as shown in Fig. 12. Some of the plates were HIPed using a QIH-15 hot isostatic pressure furnace at a temperature of 940 ± 20 °C and pressure of 120 MPa for 3 h. The plates were divided into two groups, the as-fabricated samples were denoted as A0 and A90, and the HIPed samples were denoted as B0 and B90.
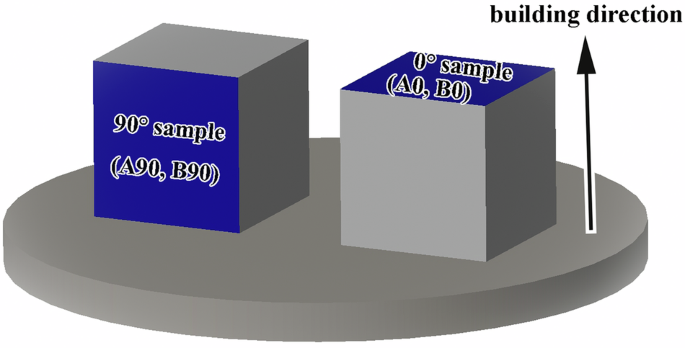
Schematic diagram of the printing direction and sampling position of electrochemical corrosion test for Ti-6Al-4V alloy with different stacking orientations prepared by EB-PBF.
Microstructural characterization
The phase constitutions were characterized through X-ray diffraction (XRD, D/max 2400 diffractometer, Japan) using a Cu-Kα radiation source with an accelerating voltage of 40 KV and a current of 250 mA. The XRD analyses were carried out in the 2θ range from 30° to 80° using the Jade 5.0 software to analyze the phase composition, respectively, according to the corresponding JCPDS Nos.44-1294 and 44-1288. The microstructures were investigated using a scanning electron microscope (SEM, Japan, JSM-6301F). The samples for SEM analysis were mechanically polished, ultrasonically cleaned sequentially in acetone, ethanol, and distilled water, and then etched in a solution consisting of 8 vol.% HF, 15 vol.% HNO3, and 77 vol.% H2O. A computed tomography (CT) scan was performed to detect the internal porosity and the maximum pore size of the samples. The samples for electron backscatter diffraction (EBSD) analysis were further electrolytically polished after mechanical polishing with an electrolytic polishing solution composed of 6 vol.% HClO4, 35 vol.% n-butanol, and 59 vol.% MeOH. Then, the EBSD analysis was performed by Zeiss field emission SEM equipped with HKL – EBSD attachment, and the data were analyzed by the Channel 5 software. The pore volume fraction was analyzed using a 3D X-ray microscope (Xradia 515 Versa, Zeiss) operated at 150 kV and a power of 10 W, which achieved a voxel size of 2 µm across a field of view of 5 mm.
Electrochemical measurements
The EB-PBF samples of dimensions 10 mm × 10 mm × 1 mm were connected to a Cu wire by conductive glue and sealed with epoxy resin. An area of 10 × 10 mm2 was left as the working electrode surface. The surface was polished to 2000 grits with silicon carbide paper, followed by ultrasonically cleaning in ethanol and drying in air. The potentiostat (EG & G Princeton Applied Research, model 2273, USA) was used to perform the electrochemical measurements of a three-electrode system, which the Ti-6Al-4V sample, Pt foil and saturated calomel electrode (SCE) corresponding to the working, counter electrode and reference electrode, respectively. The test electrolyte was artificial saliva solution (ASS) with the specific chemical composition shown in Table 6, and the experimental temperature was maintained at 37 ± 1 °C.
In this work, electrochemical impedance spectroscopy (EIS) was used to analyze the structural characteristics of the electrochemical system, potentiodynamic polarization (PD) was used to understand the kinetic characteristics of the electrochemical reaction, and potentiostatic polarization (PS) and Mott-Schottky method (MS) was adopted to study the semiconductor characteristics of the passivated film on the sample surface. The working electrode was immersed in ASS for 2 h before each test to approach the stabilized potential. After obtaining stable open circuit potential (OCP) values, EIS measurements were performed at 10 mV AC amplitude in the frequency range of 105 Hz to 10−2 Hz. The EIS results were analyzed using ZsimpWin software. The PD was performed between −0.5 V and 2.5 V (vs. OCP) with a scan rate of 0.5 mV s−1. On this basis, PS tests were performed at 0.6, 0.7, 0.8, 0.9, and 1.0 VSCE potentials. The cathodic pre-polarization was performed at −1.0 VSCE for 600 s to remove the oxide formed in the air. For each passivation potential, the electrostatic potential passivation process at the sample surface was for the 2000s, and i-t curves were obtained. After PS treatment, EIS was re-measured, and Mott-Schottky curve was measured at a rate of 10 mV/s and a frequency of 1 kHz immediately after the end of EIS. To ensure the accuracy of the data, at least four parallel experiments were performed for each set of experiments in this work.
Surface characterization
X-ray photoelectron spectroscopy (XPS) analyses were performed using ESCALAB 250 (ThermoVG). Al Ka X-rays were used as the source at 2 kV and 2 μA (hv = 1486.6 eV). The surface was etched from 0 to 280 s with Ar+ ions. The XPSPEAK4.1 software was used for peak fitting XPS spectra were tuned by combining the C1s standard peak with an energy of 284.6 eV.


Responses