Thermodynamic perspectives into DNA stability and information encoding in the human genome

Introduction
The discovery of the DNA double helix by Watson and Crick1 revolutionized molecular biology and was rooted in Chargaff’s observations of nucleotide symmetry2. Chargaff’s First Parity Rule states that adenine (A) equals thymine (T), and cytosine (C) equals guanine (G) in dsDNA, while the Second Parity Rule3,4,5 extends this symmetry within each strand. This principle has been generalized to k-mers (DNA sequences of length k) and their reverse complements (RC-pairs)6,7, though it does not apply to other permutations.
Symmetries in dsDNA have been studied in various contexts, including transposable elements8, probiotic bacteria9, and metaphors to Noether’s theorem10. Explanations for extended Chargaff’s second parity rule range from biological to statistical hypotheses6,11,12,13,14,15,16.
Our previous work showed that the double-helix structure, analyzed through a maximum entropy framework, naturally explains all observed symmetries, forming the basis of the Generalized Chargaff’s Theory (GCT)17 (see Methods). This suggests that DNA itself, as a medium, is fundamental for transmitting biological information, aligning with Landauer’s intuition that “information is physical”18.
In this line, here we propose that the perpetuation of species relies on two major factors at the DNA level: (i) the encoding of information which is essential for the survival and adaptation of the organism to its environment; (ii) the preservation of the dsDNA stability to maintain the information integrity. These two factors must operate on a time scale spanning multiple generations and individuals. This time scale, τ, is significantly larger than the time scales of molecular dsDNA activities, such as replication, transcription, translation, regulation, repair, recombination, and many others. While molecular proofreading and DNA repair mechanisms influence mutation rates on shorter time scales (often on the order of N generations, where N is the effective population size), our approach considers the cumulative effect of these processes over much longer evolutionary periods, leading to emergent patterns in genome-wide k-mer distributions.
We hypothesize that, while dsDNA operates out of equilibrium on shorter time scales, it approaches a stationary state near equilibrium over evolutionary time scales, maintaining both its informational content and structural stability. Averaging over different environments and conformations on this evolutionary time scale (τ) yields an effective energy that is predominantly local. This is because interactions with other molecules and distant regions of DNA are averaged out, leaving local interactions as persistent and dominant contributors (panel a) in Fig. 1).

a Thermodynamic perspective adopted in this study. Activities at shorter molecular (organism) time scales, where dsDNA operates out of equilibrium, are averaged over an “evolutionary” time scale (τ). Local interactions dominate the effective energy landscape as distant and molecular effects are averaged out, leaving persistent local effects. b A graphical representation of the three different models with increasing size of the local interaction term I(.) The dotted lines indicate the considered local interaction span. I(.) can be a complex function that considers the interaction among all bases in the strand and complementary strand, including the 5′-3′ bonding direction.
If our hypothesis holds, we expect to observe the following experimental evidence: (i) emergence of the generalized Chargaff’s second parity rule even only considering local interactions, leading to a Markov model representation of dsDNA sequence probabilities; (ii) rapid convergence to the observed Chargaff’s second parity rule with increasing k-mer lengths k; (iii) a local balance between k-mer frequencies and mutation rates; (iv) regions where k-mer distributions deviate from equilibrium, potentially indicating increased informational content encoded in the dsDNA message at the expense of the effective energy. We found that these hypotheses align well with experimental observations. Furthermore, we estimated the effective energy of heptamers, revealing an energetic cost associated with encoding information. Heptamers were chosen because they represent the longest sequences for which statistical analysis is feasible7 and are also the longest segments used to derive mutation probabilities19.
The “effective energy” for each segment was calculated by marginalizing all possible sequence contexts, chromosomal configurations, and interactions. This approach contrasts with traditional methods that measure polymerization or melting free energy for DNA segments in solution20,21,22. However, we observed a significant correlation between our effective energy estimates based on chromosomes for k-mers of size two and the polymerization free energy values derived in solution20 (see Results). This correlation suggests that local interactions play a pivotal role, even in complex and crowded environments. These findings provide further support for the concepts explored in this paper.
Results
Local effective energy explains extended Chargaff’s symmetries
Previous studies have highlighted the relevance of effective energy, with local interactions playing the dominant role in generating segment symmetries23,24. Here, we explore whether these local interactions alone are sufficient to account for Chargaff’s symmetries, even in the absence of long-range effects.
The derivation of the effective energy(hat{H}(X)) for a dsDNA sequence ((X,bar{X})), where (bar{X}) is the reverse complement of X, involves two steps:
(i) marginalization of the probability P(X, C, E) over environmental conditions E and spatial configurations C:
(ii) averaging the energy interactions over an evolutionary time scale τ. This time scale spans multiple generations and far exceeds the shorter time scales of molecular activities such as replication, transcription, and repair. We adopt a thermodynamic perspective which implies that the “effective energy” corresponds to the time average, 〈H(X, C, E)〉τ, of the total energy H(X, C, E) of a dsDNA sequence ((X,hat{X})), over a time interval τ, significantly larger than the time scales of molecular dsDNA activities over which both C and E vary significantly. We speculate that although dsDNA operates out of equilibrium on shorter time scales, it approaches equilibrium over this extended time frame, maintaining both its stability and informational content. Thus, as a good approximation P(X, C, E) is given by the Boltzmann distribution ({P}_{{{mathrm{Boltz}}}}(X,C,E)propto exp {-beta H(X,C,E)}) where 1/β = kBT. Similarly (P(X)propto exp {-beta hat{H}(X)}) which combined with Eq. (1) lead to:
Since (H(X,C,E)=H(bar{X},C,E)), it follows that (hat{H}(X)=hat{H}(bar{X})).
The key idea is that interactions with distant molecules and regions average out over τ, while local interactions persist. This approximation simplifies the effective energy as:
where ({hat{H}}_{k}(X)) is computed based on nearest-neighbor interactions of order k (Fig. 1). The energy form, denoted as ({hat{H}}_{k}(X)), includes contributions from k consecutive bases:
where Ik(xi, …, xi+k) accounts for up to (k + 1)-body interactions.
This local interaction model allows the probability of a sequence X to be expressed as a Markov model of order k:
where the conditional probabilities P(xi+k∣xi, …, xi+k−1) can be learned directly from data (for the proof see Methods “Modeling DNA sequences with a k-1 order Markov model based on local interactions of size k”).
Experimental evaluation of the Markov order
To investigate the effectiveness of various energy interaction models, we conducted a comparative analysis between randomly generated chromosome sequences and their natural counterparts, focusing on two human chromosomes: the AT-rich chromosome 1, one of the longest, and the GC-rich chromosome 22, one of the shortest. The selection was made according to the human chromosome k-mer distribution (see Methods).
Due to the considerable sequence lengths of chromosomes 1 and 22 (249 million and 50 million base pairs, respectively), the statistical distributions of segments in the ten generated sequences for each model were consistent, demonstrating indistinguishability for k-mer sizes up to 7–10. For this reason, we cannot report error bars in the Pearson correlation plots, as the distributions remained unchanged across different sequences for each model.
We calculated Pearson correlations for both complementary pairs (C-pairs) and reverse complementary pairs (RC-pairs) over a range of k-mer lengths, adhering to a conservative threshold limit7. This limit signifies the maximum k-mer length that allows for statistically meaningful evaluation. Our objective was to discern any discrepancies between the actual chromosomes and those simulated by Markov models by examining the correlation differences between RC-pairs and C-pairs. In our case, the k-mer length limit is about 7 and 10 for chromosomes 22 and 1, respectively. Both chromosomes exhibited similar trends in model performance (illustrated in Fig. 2). The Markov Model of order 0, which solely accounts for base-pair frequencies, failed to discern differences between reverse complement pairs (RC-pairs) and complement pairs (C-pairs), thereby proving unable to replicate experimental observations. This finding highlights the relevance of considering neighboring nucleotides of nucleotides17,19,25,26, and emphasizes the inadequacy of models based exclusively on single-nucleotide information and those that neglect the directional nature of DNA sequencing11,27,28.
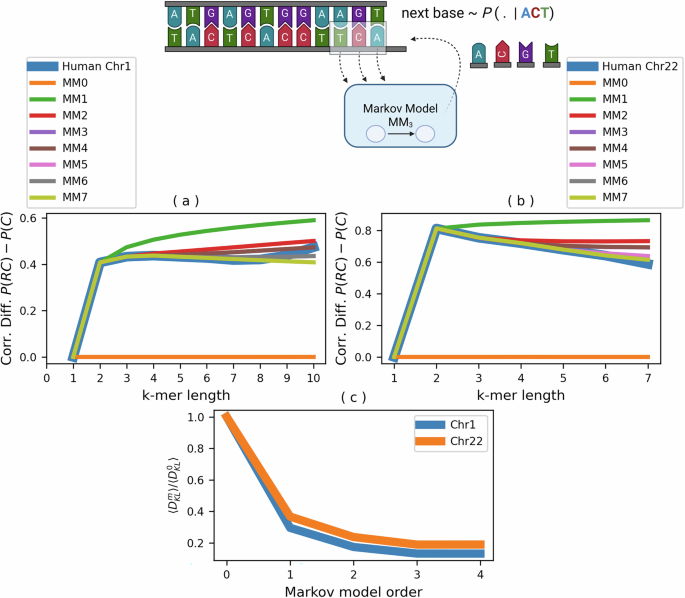
Panels (a, b) display the Pearson correlation differences for k-mer lengths between reverse complement (RC) and complement (C) pairs in chromosomes 1 and 22, respectively. MM0 shows a clear inability to match RC and C sequence patterns, while higher orders like MM1 improve alignment with observed k-mer distributions. Statistical closeness to actual data increases with model order, confirmed by Kolmogorov–Smirnov tests at 5% (MM1) and 1% (MM2−7) significance levels. Panel c presents relative Kullback–Leibler divergence between model predictions and actual k-mer frequencies in chromosomes 1 and 22, plotted against model orders on the x-axis.
A significant improvement aligning with experimental data was observed with the introduction of the first-order Markov model (MM1, energy form H1), which managed to capture the general shape of the data despite deviations at longer k-mer lengths (Fig. 2). By incorporating the first nearest-neighbor interactions, it is possible to recover all the statistically computable GCT symmetries. Enhancements in model fidelity were observed with increasing Markov order, with the second-order model (MM2) closely mimicking experimental trends and capturing genomic correlations (as depicted in Fig. 2a, b).
To quantify the alignment of Markov model predictions with actual distributions, we calculated the mean Kullback–Leibler divergence for k-mer frequencies between human chromosome 1 and 22 and those predicted by Markov models of varying orders m ∈ {0, 1, 2, 3 , 4}), as shown in section “Methods”.
In Fig. 2c, we report the relative decrement as (langle {D}_{KL}^{m}rangle /langle {D}_{KL}^{0}rangle ) to better visualize both chromosomes in the same plot, where we assume that theoretically, it should approach 0 as the order of the Markov process, m, increases. The outcomes, depicted in Fig. 2c, demonstrate rapid convergence, indicating that even simple Markov models with limited local interactions can accurately represent the k-mer distribution within chromosomes. This fast convergence of the ({D}_{KL}^{m}) suggests that local interaction predominately influences the effective-energy landscape, at least for the evaluated genomic symmetries.
Human genome and mutational equilibrium
While dsDNA functions out of equilibrium on shorter time scales, according to our hypothesis, the preservation of information and dsDNA stability operates on an evolutionary time scale, τ, spanning multiple generations and individuals. This time scale can extend beyond the one commonly used in population genetics.
This conjecture is evaluated on the human genome using experimental datasets from the hg38 assembly for heptamer frequency, and the preprocessed data taken from Aggarwala and Voight in 2016 paper19 for the mutation probabilities. Their study demonstrated similar mutation probabilities across three ethnically and geographically diverse populations (African, Asian, and European), providing a robust framework for assessing the proximity of human DNA to a state of equilibrium, by focusing on whether the principle of detailed balance is maintained. Furthermore, the mutation rates for heptamers identified in their study have been recently corroborated by another study using a different data29, where the Pearson correlation coefficient between the mutation probabilities of the two datasets exceeded 0.98. Experimental evidence of closeness to equilibrium is evaluated by examining detailed balance conditions between mutation rate ratios and the corresponding heptamer frequency ratios. Specifically, we compare the following quantities:
The substitution frequencies P(wa → wb) are taken from ref. 19, where the authors computed them using individuals from the 1000 Genomes Project. Substitution frequencies, such as P(wb → wa), reflect comparisons among different individuals, capturing the variability of substitutions across populations. In contrast, the k-mer frequencies P(wa) are computed directly from the reference genome, representing the static sequence composition without accounting for inter-individual variation.
The results, presented in Fig. 3a, show a very high and significant correlation across all examined populations, with Pearson correlation coefficients ranging from 0.82 to 0.87.
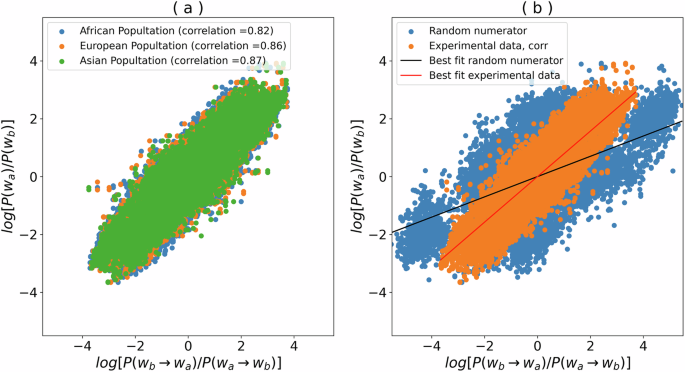
a Mutation probability ratio log[P(wa → wa)/P(wa → wb)] are from ref. 19, and Human genome heptamer frequency ratio log[P(wb)/P(wa)]) are computed on the hg38 assembly. The mutation probabilities have been computed using three different populations, such as “African”, “Asian”, and “European”. b The observed correlation for the European population (orange dots) is contrasted with that obtained by random perturbation. Blue dots represent the correlation for a numerator containing a randomly selected base k in “ACGT”, different from a and b, such as, such as log[P(wb → wk)/P(wa → wb)].
To further benchmark the observation that mutation rates and k-mer frequencies in the human genome appear to be near equilibrium, we examined the correlation between mutation probability ratios and heptamer frequencies after perturbing the frequency distributions.
For each pair of heptamers sharing the same context (wa and wb), we plotted the original log ratio log[P(wa)/P(wb)] on the y-axis, while perturbing the value on the x-axis by randomly selecting one of the two bases, different from a and b. In more detail, instead of assigning to x the value of log[P(wb → wa)/P(wa → wb)], we assigned a random value log[P(wb → wk)/P(wa → wb)], where k is in “ACGT” and distinct from both a and b (represented as blue dots in Fig. 3b). As illustrated in Fig. 3b, deviation from the detailed balance equation, evidenced by selecting a random numerator base (blue dots), leads to a reduced correlation and an altered fit, contributing to the hypothesis that human DNA closely approximates equilibrium in terms of heptamer frequency and mutation probability.
Additionally, we analyzed cases where the mutation rate ratios deviate significantly from the heptamer frequency ratios (∣deviation∣ >2kBT7D1units). The heptamers showing the greatest deviations correspond to the rarest mutations in the genome (for example, the most common mutation, C > T, is underrepresented here) and are located in regions that are high GC-rich (more than three times the expected value). These deviations are statistically more challenging to analyze due to the limited availability of reliable data for such cases, especially for substitution rates evaluated among different individuals19. Consequently, both positive and negative deviations may be partially attributed to poorer statistical support.
It is important to note that many concurring mechanisms contribute to shaping genome distribution, including mutational biases, repair processes, and weak non-specific DNA binding, as suggested by ref. 30. However, at the k-mer level, they act as base substitutions. In line with our previous findings17, genome-shaping actions fulfilling the Generalized Chargaff Rule require less effective energy. This implies that evolutionary processes may favor patterns that follow this rule when possible, incorporating a variety of potential mechanisms. Of course, disentangling the contributions of different effects is very challenging.
Correlation between effective energy and experimental DNA dimerization-free energy
Several studies have been conducted to measure the dimerization and melting of double-stranded DNA20,21,22. One of the most relevant approaches is to evaluate the dimerization-free energy using the nearest-neighbor model20. We compared our marginalized “effective” energy values with those obtained using the DNA dimerization model established by ref. 20. A significant correlation (Fig. 4) exists between the two sets of energy values. This result supports the idea that physical interactions in DNA play a crucial role in shaping its thermodynamic properties. Specifically, the correlation between the two sets of values (both based on nearest-neighbor interactions) suggests that the most significant DNA interactions are predominantly local, further supporting the results obtained above.
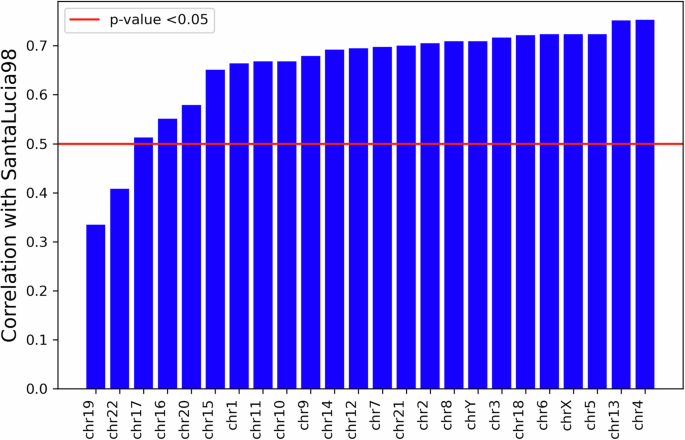
The effective energy is obtained from the log-frequency of k-mers of size two for various human chromosomes. The horizontal line indicates the significance threshold for the correlation at 0.05. Bars extending above the line are considered significant.
Interestingly, this correlation holds across many chromosomes without trends related to chromosome length or percentage of coding regions. The correlation shows exceptions in chromosomes 19 and 22, where the free energy measured for DNA in solution differs from that obtained by marginalizing over all contexts and conformations, and may indicate a more pronounced influence of the environment on these two chromosomes.
The energy cost of coding
We quantified the cost of information maintenance and encoding into the DNA molecule using the sequences of chromosomes 1 and 22 sequences. We scored the heptamer effective energy computing the inverse of the k-mer frequency obtaining a shifted value ES(w, c) for each heptamer w and chromosome c (see Eq. (9) and Fig. 5 for the relation between ES(w, c) and ϵc(w)). The details of ES(w, c) are reported in Methods section.
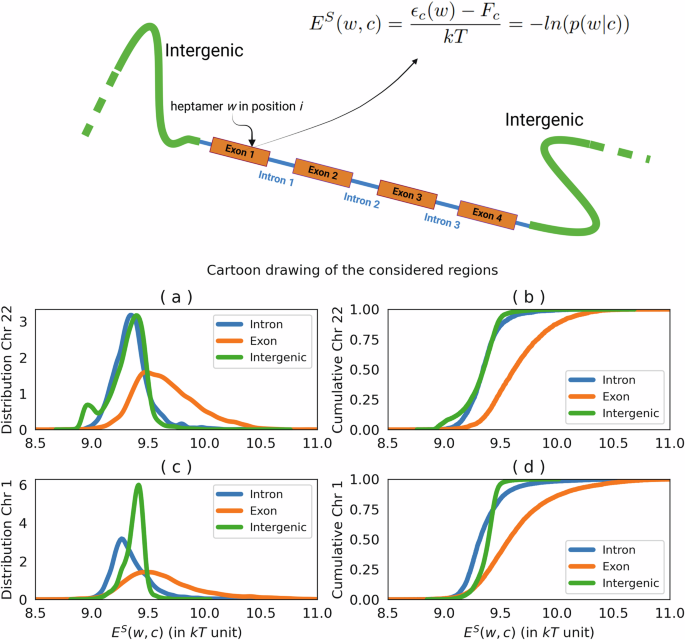
Figure compares coding (exon) and noncoding (intron, and intergenic) regions in panels a, b (chromosome 22), and c, d (chromosome 1), respectively. For both chromosomes, the average effective energy difference between intron—exon and intergenic—exon regions is about 0.3 in kT unit, (with a standard deviation of 0.1 kT), indicating similar energetic profiles across these genomic areas. The Kolmogorov–Smirnov test yields a p value close to zero for comparisons between coding (exon) and noncoding (intron or intergenic) regions, signifying a statistically significant difference in their distributions. This finding underscores the distinct molecular characteristics of these genomic regions.
It is worth noting that our division of the genome into coding and noncoding regions is quite crude and only partially accounts for the complexity of the human genome. Many regulatory codes reside in non-gene-coding regions, and noncoding regions contain a significant proportion of repetitive sequences, which could markedly deviate in k-mer statistics from the rest of the genome. However, our primary aim is to identify whether any signals can be observed even with this broad categorization of coding and noncoding regions, as a first approximation in this study.
The results reported in Fig. 5 show a distribution of effective energy that shifts towards higher values in coding regions when compared to intron and intergenic regions. From the distribution values, we estimated the energy cost of coding of about one-tenth of kT (0.3 ± 0.1kT) per base pair, for both chromosomes.
If the coding regions are pushed slightly outside the equilibrium, we can expect that the imbalance can be seen in the mutation directions, which means more probable mutations from high to lower energy k-mer in the coding regions (see top Fig. 6).
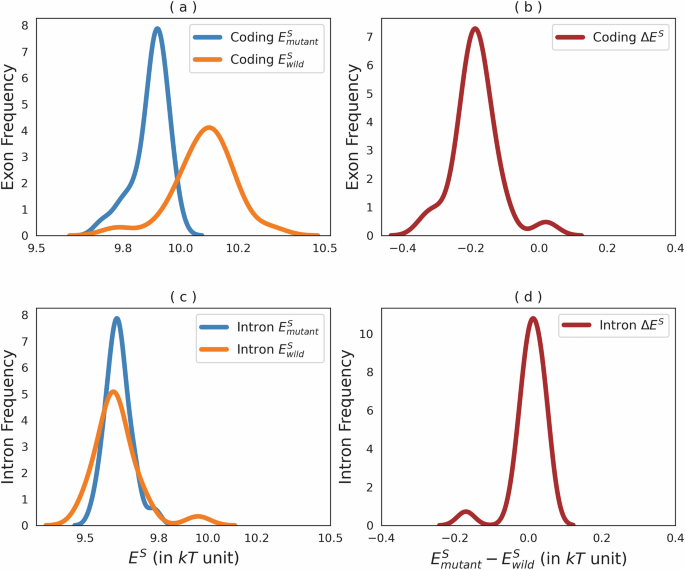
a, b Detail effective energy for wild-type (wild) and mutated (mutant) bases in coding regions, and c, d for intron regions, both with averaged differences across chromosomes. Kolmogorov–Smirnov tests confirm significant differences in energy distributions between wild-type and mutated sequences in coding regions (p value <10−8), but not in intron regions (p value >0.05).
We confirmed this hypothesis by exploiting the ClinVar dataset31, which contains annotated mutations. Panels a and b of Fig. 6 illustrate the effective energy distribution of the wildtype and mutated bases within coding regions, along with their relative differences averaged over chromosomes. Conversely, panels c and d present similar distributions for intron regions.
This analysis of mutation data from the ClinVar database highlights a pronounced tendency for mutations within coding regions to favor alterations in k-mer compositions, favoring transitions toward lower energy states. This pattern is consistent with detailed balance and equilibrium principles in double-stranded DNA (dsDNA), suggesting that mutations in coding regions are preferentially driven towards energetically advantageous configurations.
While the energetic cost, computed here (0.3 ± 0.1kT), is significantly lower than that of hydrogen bonds in DNA, ranging from 2 to 10kT32,33, and is negligible compared to the free energy cost of basic cellular mechanisms34, it is clear that the coding cost influences mutation probability in the coding regions and may have other, yet unidentified, effects on cellular and organismal functions.
Since ClinVar provides classifications for “benign” and “pathogenic” mutations, we analyzed the effective energy of both mutant and wild-type variants based on these categories, as reported in the ClinVar dataset. While we acknowledge that these annotations are not perfect and may change over time, we are taking an average perspective. Therefore, we expect that the results can also reflect future, more accurate annotations. Specifically, we investigated the influence of genetic mutations within coding regions on the effective energy of associated heptamers, emphasizing the distinctions between benign and pathogenic variants. The results are presented in Fig. 7. Panel a compares the effective energy levels between wild-type genetic variants and their mutated forms. These are categorized based on their effects as annotated in the ClinVar database, distinguishing between benign variants, which are not linked to adverse health conditions, and pathogenic variants, implicated in disease causation. Panel b details the specific differences in effective energy changes between mutations classified as benign and those deemed pathogenic.
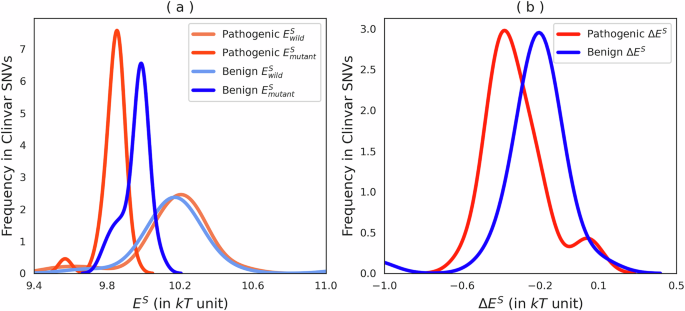
a Depicts the effective energy of wild-type versus mutant variants in coding regions, categorized by effect type (according to ClinVar annotations): Benign and Pathogenic. b Illustrates the differences in effective energy between mutations for Benign and Pathogenic variants. The effective energy distributions for wild-type Benign and Pathogenic variants are not significantly different (Kolmogorov–Smirnov p value >0.6). In contrast, the distributions of effective energies for mutated variants differ significantly, with the Pathogenic variants tending to be more stabilizing (Kolmogorov–Smirnov p value <10−4).
Our statistical analysis utilized the Kolmogorov–Smirnov test, revealing that the distributions of effective energy between wild-type benign and pathogenic variants are statistically similar (Kolmogorov–Smirnov p value >0.6), indicating comparable energy profiles in their non-mutated states. Conversely, mutations introduce significant alterations in energy dynamics; pathogenic mutations tend to substantially stabilize the effective energy of heptamers (Kolmogorov–Smirnov p value <10−4), as depicted in Fig. 7.
These findings suggest that deleterious mutations in coding regions generally enhance the stabilization of the effective energy of heptamers, proposing a potential mechanism through which these mutations exert their pathogenic effects. By increasing the stability of heptamers, pathogenic mutations may inadvertently favor conformations that promote disease states, possibly degrading the information content.
It is important to note that although the distinction in effective energy between pathogenic and benign mutations is statistically significant, applying this signal to individual mutations is challenging. The significant signal we observe is derived from a set of mutations, which may not necessarily translate directly to the behavior of single mutations in a clinical context.
Discussion
This study explored the fundamental relationship between the genetic information encoded within DNA and the thermodynamic costs associated with its storage and maintenance. From the inception of Generalized Chargaff’s Theory (GCT) to the empirical validation of detailed balance in the human genome, we underscored the profound interplay between genetic information and physical laws.
Our investigation into the local effective energy dynamics explains the observed Chargaff symmetries, revealing how local dsDNA interactions sculpt the probability distribution of DNA sequences. The effective energy per chromosome we computed for first-order interaction correlates with the free energy measured in solution for the duplex DNA20, further supporting our finding on the relevance of local interactions.
Crucially, our work sheds light on the energetic demands of encoding genetic information, uncovering a higher energy cost in coding regions compared to intronic or intergenic areas. While we recognize that the division between the coding and noncoding regions is a simplification and that there may be more subtle differences, our main aim was to explore whether signals emerge even with this broad categorization. We observed that, on average, coding regions tend to exhibit higher effective energy, although it is possible that other regions may exhibit behaviors similar to coding regions. This differential energy requirement underscores the thermodynamic implications of maintaining and processing genetic information. This concept resonates with the notion of molecular Darwinism24, which posits that evolutionary pressures can partly derive from optimizing biophysical properties such as relative stability and rates and the classic perspective of being driven by phenotypical adaptive advantages (natural selection).
Recent studies have shown that the rates at which mutations occur are not random but are influenced by the surrounding genomic environment19,25,29. In the context of the genome, this concept implies that the energetic favorability of certain mutations could be influenced by the inherent properties of the chromosomal regions in which they occur. These chromosome-specific mutation rates underline a critical aspect of genomic diversity and evolution, highlighting how mutations can have differential impacts across the genome.
Three main questions emerge from our findings. First, do intron and intergenic regions act as buffers for effective energy, thereby aiding eukaryotes in genome stabilization? Second, considering that the major contribution to effective energy originates from interactions between 2 and 4 bases, is it conceivable that the stability provided by local energy dynamics at the scale of a codon could be partially responsible for the universal adoption of the triplet codon size in life’s genetic encoding? Third, can the changes in effective energy due to DNA mutations be extended to include clinical impact?
Although these questions currently remain unanswered, we hope our study will not only pave the way toward solutions but also stimulate further inquiries in this research field.
Methods
Data extraction
Human chromosomes were taken from the NCBI database (https://www.ncbi.nlm.nih.gov/genome/) using genome assembly GRCh38 (hg38).
Human genome has different k-mer distributions across the chromosomes. Figure 8 shows the heptamer case, where two major clusters arise.
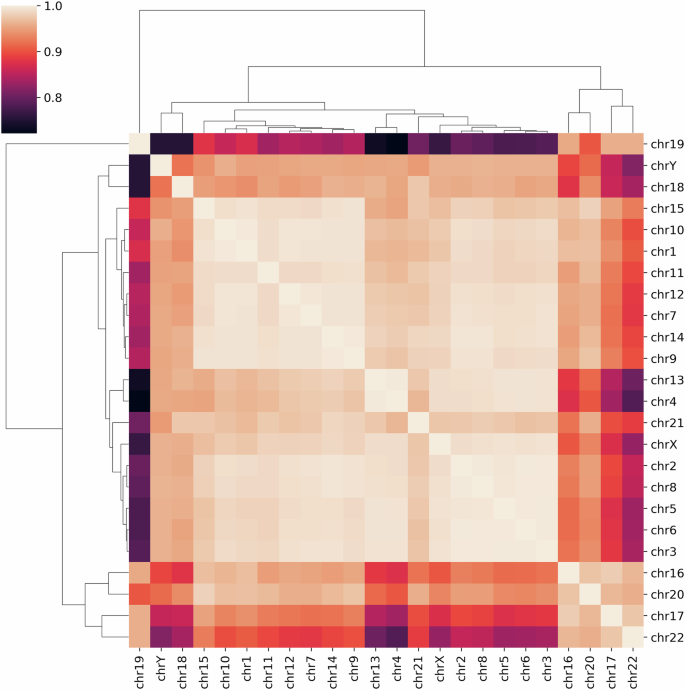
They are categorized based on their Pearson correlation coefficients in relation to heptamer frequency across different chromosomes. The visualization distinguishes two principal clusters, which also show a correlation with differences in AT and GC content, as well as chromosome size. The smaller, GC-rich chromosomes (specifically chromosomes 16, 17, 19, 20, and 22) are grouped together on the right side of the map.
The mutation probabilities of the heptamers were obtained from the supplementary material of the paper by Aggarwala and Voight (2016)19.
The information about coding, intron, and intergenic regions for chromosomes 1 and 22 was retrieved from the RefSeq database on the UCSC Genome Browser35. We extracted annotations for coding regions, specifically exons and introns. The remainder of the genome is considered “intergenic,” although it may contain a significant number of false negative assignments.
To evaluate the detailed balance, we used the preprocessed data taken from Aggarwala and Voight in 2016 paper19. They introduced an approach to understanding genetic variation by calculating the mutation probabilities within a defined context of six bases, effectively encapsulating heptamers, they unveiled the context-dependent nature of mutation probabilities. Their study demonstrated a strong similarity in mutation probabilities across three ethnically and geographically diverse populations: African, Asian, and European. Furthermore, the mutation rates for heptamers identified in their study have been recently corroborated by another study using a different data29, where the Pearson correlation coefficient between the mutation probabilities of the two datasets exceeded 0.98.
From ClinVar31, we obtained information about annotated mutations related to “Benign,” “Pathogenic,” and their types (missense, stop-codon, synonymous, etc.). From ClinVar, we extracted all the mutations that pertain to coding regions and those in the intron regions. Then, we extracted the corresponding heptamers from the relative chromosome positions, and we computed the effective energy according to Eq. (9) for the wild-type heptamers and for the mutated ones (and their difference). Finally, we averaged the chromosome values.
Chromosome generation using Markov models
Markov models, ranging from order 0 (considering only base frequencies without sequential context) to order 6, were employed to model these chromosomes, denoted as MMk with the associated energy represented by ({hat{H}}_{k}) (Fig. 1). For each model, we estimated transition probabilities from the chromosomes 1 and 22 and subsequently generated ten random sequences per model. The generation process began with a random seed of length k, extending to full chromosome lengths via sampling from model-specific transition probabilities. The random sequence generation process proceeds as follows:
-
1.
Begin with a random sequence of k bases: sk = x1. . . xk.
-
2.
Generate a sequence sk+1 = skb = x1. . . xkb by sampling the k + 1-st base, b, according to the Markov model b ~ P(xk+1∣sk).
-
3.
Repeat these steps iteratively until a sequence of N bases is obtained.
For each sequence generated from a Markov model (denoted as MMm), and for each k-mer length k, we calculated the Pearson correlation for RC-pairs, represented as rc(MMm, k), and for C-pairs, denoted as c(MMm, k). These were then contrasted with the correlations observed in the actual chromosome, labeled as rc(Chr, k) for RC-pairs and c(Chr, k) for C-pairs.
To highlight and visually represent the discrepancies, we focused on the differences in correlations as a function of the k-mer length, formulated as DC(x, k) = rc(x, k) − c(x, k). This difference (DC) highlights the distance between frequency C and RC pairs, reducing the overlap in the plot among the curves for the different MMk models. This calculation was applied to both the observed chromosome (where x = Chr) and each evaluated Markov model (where x = MMm). Ultimately, we visualized the differences in Pearson correlation, DC(x, k), across varying k-mer lengths k, thereby underscoring the deviations between the Markov model simulations and the actual chromosome sequences.
Kullback–Leibler divergence computation
To quantify the alignment of Markov model predictions with actual distributions, we calculated the mean Kullback–Leibler divergence for k-mer frequencies between human chromosome 1 and 22 and those predicted by Markov models of varying orders m ∈ {0, 1, 2, 3, 4}), as shown in the following equation:
where ({P}_{obs}^{(i)}) and ({P}_{M{M}_{m}}^{(i)}) are the probability distribution of the k-mers of length i for the observed and random-generated DNA sequences using the Markov model MMm, and L is 10 or 7 for chromosome 1 and 22, respectively. ({D}_{KL}({P}_{obs}^{(i)}| | {P}_{{H}_{m}}^{(i)})) is computed for specific k-mer length sets Wk (sets of sizes ∣Wk∣ = 4i) as
Computation of k-mer effective energy
From each chromosome c, we computed the k-mer frequencies to obtain the estimation of the probability of the k-mer in that chromosome (p(w∣c)). Then, extracted the corresponding heptamers from the relative chromosome positions of interest and computed the effective energy according to the following equation:
for all the k-mer used. This allowed for the calculation of effective energy across different genomic regions, in particular, the coding (exons) and the noncoding (intron and intergenic) regions, for chromosomes 1 and 22. For each position i in the DNA sequence (chromosomes 1 or 22), we extracted the corresponding heptamer sequence wi, and then we evaluated its shifted effective energy as ES(wi, c). Then, ES(wi, c) is assigned to the class in which the position i has been labeled, such as: exon, intron or intergenic.
To compute the difference between the wild-type and mutant effective energy, ΔES = ES(wa, c) − ES(wb, c), in a chromosome c, we first calculated the energy for the reference k-mer (ES(wa, c)) and then for the k-mer with the central position substituted (a → b, ES(wb, c)). The difference value ΔES were recorded and averaged for each chromosome.
Chargaff’s symmetries from MaxEnt and double-helix constraints
Following the conventions established in ref. 17, we define a DNA sequence of length N in the string X = x1. . . xN, where xi is one of the possible four nucleotides {A,C,G,T}. We define two functions of a DNA sequence X: the reverse Xr = xNxN−1. . . x1, and the complement ({X}^{c}={x}_{1}^{c}{x}_{2}^{c}…{x}_{N}^{c}), where ({x}_{i}^{c}) represent the Watson-Crick base complement (such as Ac = T and Cc = G). Finally the reverse complement of a sequence X is defined as (bar{X}={({X}^{r})}^{c}={({X}^{c})}^{r}={x}_{N}^{c}{x}_{N-1}^{c}…{x}_{1}^{c}={bar{x}}_{N}{bar{x}}_{N-1}…{bar{x}}_{1}). The last equality comes from the fact that the reverse complement of a nucleotide is just its complement. In the case of a k-mer, we used also the shorthand notations, w = x1. . xk, and wa = x1. . xi−1axi+1. . xk/2, indicating in this latter case a k-mer with a specific context w but with the central position occupied by the base a.
When we consider a dsDNA, the two paired DNA strands X and (bar{X}) interact with an energy (hat{H}(X)), which is symmetric under the exchange of X with (bar{X}), i.e., (hat{H}(X)=hat{H}(bar{X}))), and its strength depends on the specific DNA sequence X. This property follows from the equality (H(X,C,E)=H(bar{X},C,E)). We then can define the average energy as
where P(X) is the probability of occurrence of the DNA strand X and the sum is over all possible DNA sequences. The equilibrium distribution is obtained by maximizing the entropy (S=-{sum }_{X}P(X)ln (P(X))) with the constraints that the average of (hat{H}), Eq. (10) is fixed and ∑XP(X) = 1, one obtains
where the constant Z is the partition function
Furthermore, from the symmetry of the interaction energy, we showed in ref. 17 that the expected number of a w k-mer is equal to its reverse complement, or (n(w)left.rightrangle =langle n(bar{w})rangle ). Actually, considering a sequence X containing the k-mer w (X = XLwXR) by summing over all possible “left” (({X}_{L}in {{{mathcal{C}}}}_{L})) and “right” (({X}_{R}in {{{mathcal{C}}}}_{R})) contexts of the k-mer w, we can define its probability as:
where the effective energy ϵ(w) (in kT unit) is:
The last equality comes from the double-strand symmetry ((hat{H}(X)=hat{H}(bar{X}))), which implies that
This result explains all the Chargaff’s sequence symmetries found in dsDNA in purely thermodynamic terms, without advocating any specific evolutionary models or biological reasons17.
Modeling DNA sequences with a k-1 order Markov model based on local interactions of size k
Here we show that the energy in the form presented in Eq. (4) containing the local interaction term of size k + 1 (Ik(xi. . . xi+k)) leads to the probability of a sequence X formally given by a Markov model of order k, such as
To show that the Energy leads to a probability of the sequence described by a kth−order Markov model, we start by defining:
With the definitions of the above summation, we can compute the probability of a k-mer of size k in position i when the local interaction range is k + 1 as:
For the first position i = 1 and defining the summation over zero elements as ({z}_{0}^{L}(.)={z}_{0}^{R}(.)=1), we have:
When a k-mer of the same size as the local interaction term I is considered, the corresponding probability is:
Using equation (18) and equation (20) it is possible to specify the form of the conditional probability used for a kth-order Markov model as:
By computing the following product:
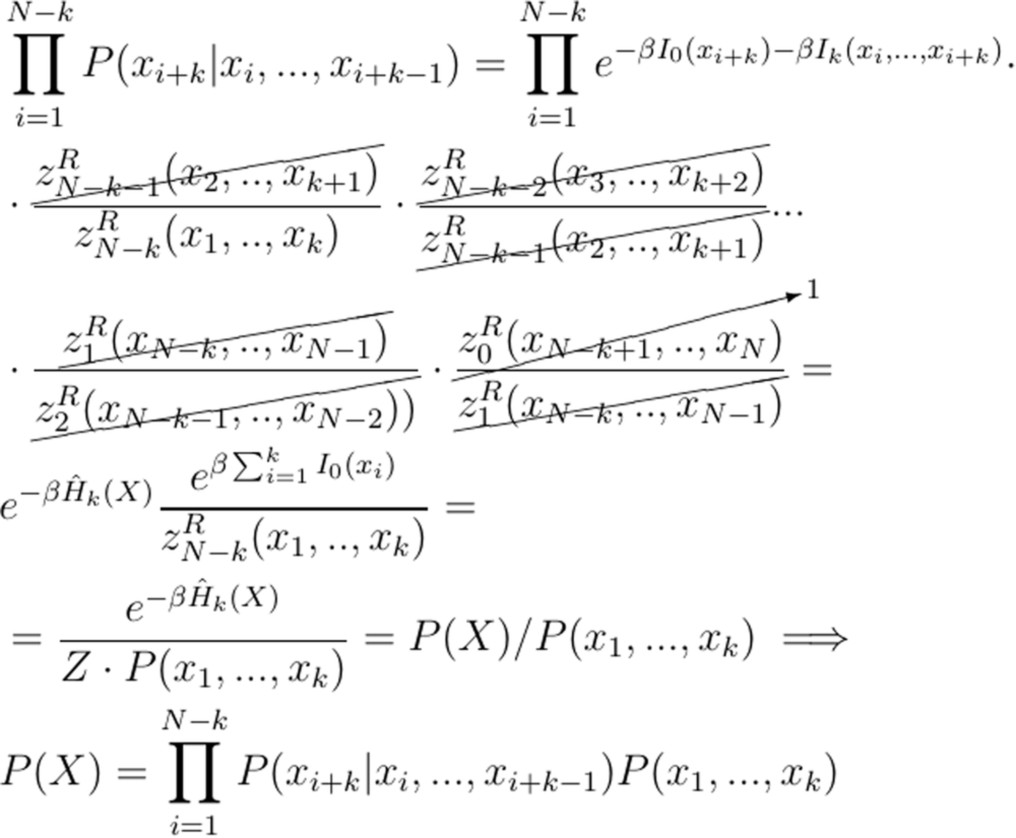
where all zR(.) terms cancel except ({z}_{N-k}^{R}({x}_{1},…,{x}_{k})), and ({z}_{0}^{R}({x}_{N-k+1},..,{x}_{N})=1) by definition. The last substitution before the implication sign comes from equation (19).
With Eq. (22) we show that a local interaction of size k + 1 leads to probability of a sequence X described by a Markov model of order k.


Responses