Three-dimensional imaging of topologically protected strings in a multiferroic nanocrystal
Introduction
Multiferroic materials are single-phase materials where two or more ferroic properties including ferromagnetism, ferroelectricity, ferroelasticity or ferrotoroidicity co-exist1,2,3,4,5. Hexagonal manganites (h-RMnO3), where R ∈ {Y, Dy, Er, (or a small rare-earth ion)}, are multiferroic materials where ferroelectric ordering arises due to tilting of MnO5 bipyramids and buckling of R3+ ions along the c-axis direction, i.e. improper geometric ferroelectricity (Fig. 1a). Tilting occurs collectively either toward or away from a central R3+ ion positioned at either of three distinct lattice sites (α, β or γ) leading to six symmetry-equivalent trimerisation states (Fig. 1b). The potential energy surface that describes the ferroelectric phase transition therefore has a Mexican-hat-like topology (Fig. 1c) where the radial distance from the central peak represents the magnitude of MnO5 bipyramid tilting and the six equivalent minima in the Z6-symmetry brim represent the symmetry-equivalent trimerisation ground states. This potential has similar symmetry to the ‘ϕ4’ potential that describes the formation of the Higgs boson6,7,8 as well as one-dimensional topological defects such as the cosmic strings, proposed to have formed in the early universe9. As a result, hexagonal manganites can host the crystallographic equivalent of cosmic strings in the form of topologically protected vortex strings at the intersection of ferroelectric domains (Fig. 1d). When coupled with the Zurek mechanism, which is used to estimate the defect number density (n) as a function of the rate of quenching across the ferroelectric phase transition, the Kibble-Zurek mechanism (KZM) is able to describe a phase transition in any system with the required symmetry properties9,10. The KZM is therefore generally applicable in such cases and determines the defect number density, n as:
where ξ0 is the zero-temperature correlation length, τ0 = ξ0/c is the zero-temperature time, c is the speed at which information is transferred in the system, τq is the quench time, D, d are the dimensions of the space and defect respectively and ν, z are critical exponents that are determined by the universality class of the system11,12,13. For a particular material and universality class, scaling of the defect number density n is therefore determined solely by the quenching rate. Varying the rate of cooling through a ferroelectric phase transition becomes equivalent to varying the rate of early universe expansion13,14,15,16,17. To date, however, non-destructive three-dimensional imaging of 1D topological defects in materials has proven challenging.

a Illustration of the crystal structure of h-DyMnO3 in the paraelectric phase, shown with 4 × 1 unit cells. A single unit cell is highlighted by the shaded green region. b Crystal structure of the centrosymmetric paraelectric phase of h-DyMnO3 projected normal to the c-axis. Arrows indicate the resulting displacement of oxygen ions due to tilting of MnO5 polyhedra during the trimerisation transition into the low temperature ferroelectric phase. Tilting occurs collectively either toward (+) or away (−) from one of the central dysprosium ions (α, β or γ) leading to six symmetry-equivalent trimerisation states corresponding to the six equivalent minima of the Mexican-hat-like potential energy surface (c). Each minimum in c corresponds to the ferroelectric phase, while the high symmetry paraelectric phase is represented by the central peak. d Illustration of three-dimensional topological domains forming a vortex (front)—antivortex (back) pair connected by a topologically protected string.
Bragg coherent diffraction imaging (BCDI) is a particularly powerful tool for the study of multiferroics at the nanoscale as it is able to reveal the ferroelectric domain structure in three dimensions18,19,20. BCDI is performed by illuminating a nanoscale crystal in the Bragg reflection geometry with a spatially coherent x-ray source, so that the coherence length exceeds the dimensions of the nanocrystal. The resulting scattered light from the nanocrystal interferes in the far-field, producing a three-dimensional reciprocal-space diffraction pattern21,22,23,24. The diffracted intensity is measured using a photon counting area detector which is optimally positioned to resolve the finest fringes of the diffraction pattern. The third dimension of the diffraction pattern is obtained by rotating the crystal through the Bragg condition while maintaining a largely fixed incident angle (a rocking-curve measurement).
Iterative phase reconstruction methods are then used to recover the complex three-dimensional electron density and phase information present within the x-rays that is acquired when coherently scattered from the nanocrystal22,25. The displacement of ions throughout the bulk is directly related to the recovered phase and can be used to obtain strain information according to the relation ϕ = Q ⋅ u, where u is the atomic displacement from the equilibrium lattice position24,26. Diffraction patterns from multiple Bragg reflections of a single nanocrystal are combined to recover the full displacement field and its spatial derivative which is the strain tensor field 25,27.
Here we utilise BCDI to directly image in three-dimensions topologically protected strings in a single hexagonal manganite nanocrystal.
Results
Multiple Bragg peak experiment
Nanocrystals of hexagonal dysprosium manganite (h-DyMnO3) were prepared from bulk melt-grown h-DyMnO3 as described in the “Methods” section28,29. Laboratory based x-ray diffraction experiments were used to verify the correct hexagonal crystallographic phase was obtained with lattice parameters a = b = 6.18 Å and c = 11.4 Å30. The ferroelectric domain structure in h-DyMnO3 is formed upon cooling the high symmetry paraelectric phase (P63/mmc) through the critical temperature (Tc) of ~1200 K to the lower symmetry ferroelectric phase (P63cm). In this case, quenching was performed at a cooling rate of ~1000 K per second.
BCDI experiments were performed in air on beamline I16 of the Diamond Light Source synchrotron facility using 9 keV x-rays and a quad Merlin detector31 where each pixel measured 55 μm × 55 μm. The sample-to-detector distance during measurements was fixed at 1.31 m. The full beam x-ray flux at the sample was 3 × 10¹³ photons s−1. Samples containing mono-dispersed h-DyMnO3 nanocrystals were mounted at the eucentric point of the 6-axis kappa diffractometer. The beam size was reduced down to 50 × 50 μm2 using front-end slits. A single specular Bragg reflection corresponding to the G(110) reciprocal lattice plane from a single h-DyMnO3 nanocrystal was located and its three-dimensional diffraction pattern recorded. Additionally, the (111) Bragg reflection from the same nanocrystal was found by first rotating the experimental geometry (Q-vector) through the cone of all possible points where Q ⋅ Q(110) = G(111) ⋅ G(110). Subsequently, the (112) Bragg reflection from the same nanocrystal was found by defining an orientation matrix using the location of the previous two reflections. Each diffraction speckle pattern was subsequently coordinate transformed into Cartesian coordinates and sampled onto a regular grid in preparation for concurrent phase retrieval.
BCDI concurrent phase retrieval
Phase reconstruction of the real-space electron density and displacement field u(r) was performed concurrently20,25,32,33,34 using the Interactive Phase Retrieval Suite35 for all three Bragg reflections of a single nanocrystal. Concurrent phase retrieval was previously shown to provide stronger convergence and high reproducibility than independent phase retrieval due to inherent redundancy in the concurrent approach25. Phase reconstruction consisted of repeated cycles of 5000 iterations of Fienup’s Hybrid Input-Output algorithm with a masked diffraction pattern followed by 100 iterations of the Error Reduction (ER) algorithm36. In each case, a support (solvent) was employed that was created using a manual version of the shrink-wrap method27,37. Phase retrieval attempts were repeated at least three times with a revised shrink-wrapped support from the previous attempt until no appreciable changes were observed in the support morphology between reconstruction attempts.
BCDI of ferroelectric phase vortices
Figure 2 shows the reconstructed real-space electron density map of the single h-DyMnO3 nanocrystal for each of the three Bragg reflections. In addition, the phase information at the corresponding location is mapped onto the surface. Considerable variation in the phase information across the surface is observed in each reflection with the (111) reflection clearly showing striped phase patterns across the surface. Each reconstruction shows consistency in the morphology of the nanocrystals confirming good agreement in the reconstruction process. The morphology is shown at a 95% isosurface with nominal dimensions of 1.22 μm in width and 2.07 μm in height. Real-space electron density maps without phase information mapped onto the surface are shown in the Supplementary Materials. The resolution for each reconstruction was estimated using the Phase Retrieval Transfer Function38 and was determined to be 35.2 nm, 46.7 nm and 20.8 nm for the (110), (111) and (112) Bragg reflections respectively (Fig. S6 of Supplementary Material).
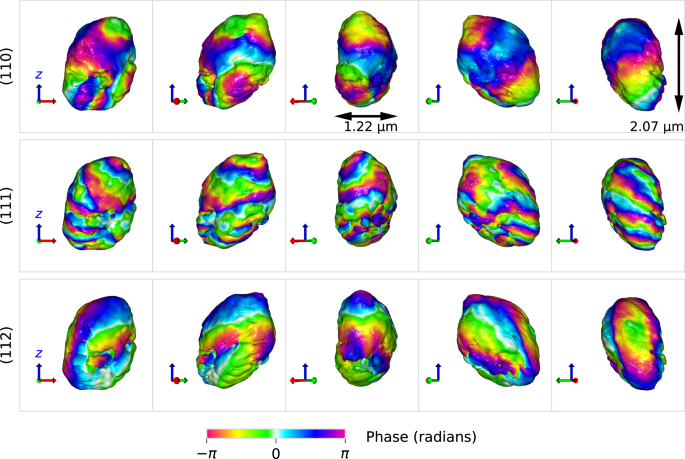
Concurrent BCDI reconstruction of the morphology of a single h-DyMnO3 nanocrystal showing phase information mapped onto the surface of the crystals. Each of the 5 frames per row, from left to right, differs by a rotation of 72 degrees normal to the vertical z-axis direction as defined in the image. Multiple stripe phase patterns are visible predominantly in the (111) reflection of the nanocrystal.
Figure 3 shows slices through the reconstructed electron density map of the (111) reflection normal to the x-axis (a), y-axis (b) and z-axis (c) respectively. Slices are shown at five 100 nm intervals for each orientation. Equivalent plots for the (110) and (112) reflections are found in the Supplementary Material. Stripe domain structure (a) and a number of ferroelectric vortex patterns (b and c) are visible throughout the nanocrystal volume, primarily in the (111) reflection phase information. Vortex cores appear with a preferred winding direction for the phase information that surrounds the defect, in the plane of view. In Fig. 3b this corresponds to a positive increase in phase for anti-clockwise winding direction. From the observation of vortex cores with a preferred winding direction, we can infer that the topologically protected strings within the nanocrystal are not winding back to one another as this would produce vortex cores with opposite winding direction—which are not observed. Vortex cores are nominally separated by 93 nm (see ‘Topologically Protected Strings’), with separations up to 120 nm observed, as shown. Phase paths connecting pairs of vortex cores are also observed, most clearly in Fig. 3c.

Slices through the (111) reflection of the reconstructed h-DyMnO3 nanocrystal shown for three orthogonal projections. The x, −y and −z unit vector points out of the image plane in the row labelled a, b and c respectively. Slices are taken at 100 nm intervals directed normal to the image plane. Numerous vortex structures are visible in the phase information and appear with a preferred winding direction. Central image on row b labels two vortex cores separated by 120 nm.
Figure 4 shows the strain tensor information ε which is the spatial derivative of the displacement field, defined as ({{{boldsymbol{varepsilon }}}}=(1/2){nabla {{{bf{u}}}}+{left(nabla {{{bf{u}}}}right)}^{T}}). Cross-sections through each of the six independent strain tensor components normal to the x-axis direction are shown in each column where each slice is taken at locations shown in Fig. 3. Cross-sections normal to the y-axis direction and z-axis direction are shown in the Supplementary Material. Strain information with patches of tensile and compressive strain are visible in all components except the εzz component which is largely strain free in contrast. A likely cause of this effect relates to the uniformity of displacements along the c-axis direction, for which there is a significant component in the z-axis direction. Crucially surface effects such as oxygen depletion, which would appear as strain layers near to the surface, are not observed in the strain tensor information suggesting that h-DyMnO3 nanocrystals were synthesised with sufficiently high phase purity for such effects not to be visible at the resolution of this measurement.
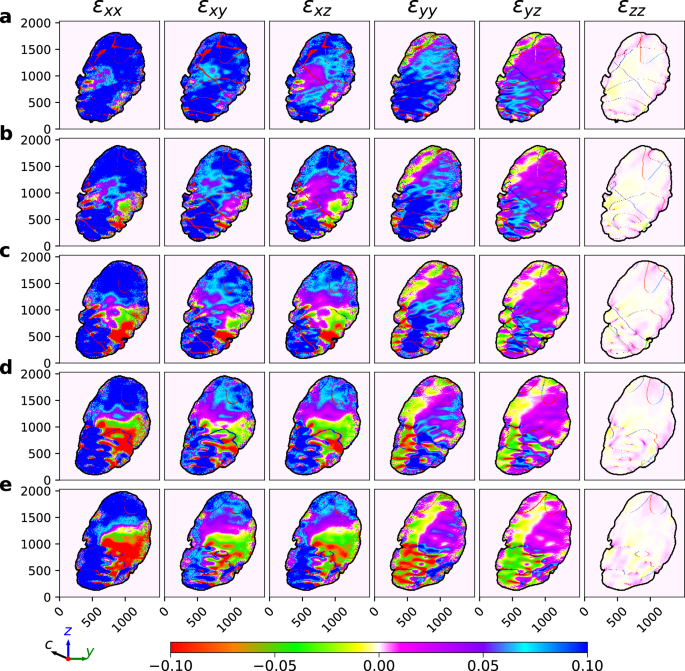
Strain tensor components of the reconstructed h-DyMnO3 nanocrystal. Six independent components of the strain tensor are shown in each column. a–e Cross-sectional planes respectively taken at the same locations shown in Fig. 3. Axes have units of nanometres.
Topologically protected strings
Figure 5 shows topologically protected strings defined as the path for each vortex core in the phase map information for the (111) reflection electron density map of Fig. 3. The (111) reflection was chosen as the strings were more clearly observed in the phase information when compared to phase information in the (110) and (112) reflection density maps. The accompanying Supplementary Video shows a three-dimensional animation of the topologically protected strings to facilitate with visualisation. Slices through the reconstructed h-DyMnO3 nanocrystal phase information maps are shown in Fig. 5a, d along with the coincidence points of the strings with phase vortex cores. Strings pass through the h-DyMnO3 nanocrystal unperturbed by the surface and in some places appear to fold back on themselves to form loops. In order to determine the density of topologically protected strings within the nanocrystal we defined the Path Distribution Function (PthDF), g(r), which describes the distribution of minimum distances between pairs of strings within the nanocrystal volume. This is analogous to the Pair Distribution Function39,40,41 with the exception that it operates on one-dimensional paths as opposed to zero-dimensional points. The PthDF is defined as:
where γi(t) are the coordinates of a point on the multiferroic string trajectory with index i and density ρi(t), while ({{{mathcal{N}}}}) are the set of all points within the nanocrystal volume. Figure 5g shows the resulting PthDF for multiferroic strings in the (111) phase map. It shows a clear preference for strings to separate by ~93 nm. The corresponding area density of strings, (n), is estimated from the preferred string separation and found to agree with those previously reported for the same cooling rate in bulk samples13,42. From this we can infer that there are likely no fundamental changes in domain structure between our nanoscale structure and bulk samples.

Three-dimensional images of topologically protected string defined as the path of each vortex core for the (111) reflection throughout the reconstructed h-DyMnO3 nanocrystal. a Slice through the reconstructed h-DyMnO3 nanocrystal showing coincidence points of strings with vortex cores. b Strings shown with identical orientation as shown in (a). c Reoriented view of strings. d Alternative view of a slice through the reconstructed h-DyMnO3 nanocrystal showing coincidence points of topological strings with vortex cores. e Strings shown with identical orientation as shown in (d). f Reoriented view of topological strings. g Path Distribution Function (PthDF), g(r), which describes the distribution of distances between pairs of strings, independent of orientation. Error bars are twice the standard deviation.
Discussion
Earlier studies aimed at revealing three-dimensional domains, domain walls and multiferroic strings have employed destructive means such as sequential Focussed Ion Beam cutting of cross-sections of bulk multiferroic materials. Subsequent imaging of these slices was performed using either Scanning Electron Microscopy (SEM), piezoresponse force microscopy (PFM) or conductive atomic force microscopy (cAFM). The resulting images were used to successfully reveal domain and domain wall contrast13,43. SEM, PFM and cAFM measurements however were unable to reveal the winding direction of the vortex structure, which is readily observed when using Bragg CDI. While the robust nature of topologically protected structure lends itself to destructive mapping and imaging techniques, such measurements have the disadvantage of lacking repeatability. Bragg CDI however offers non-destructive imaging where measurements can be repeated on the same sample provided the dimensions of the material are below the coherence volume of the coherent x-ray probe44. When this isn’t the case, alternative and more challenging approaches such as Bragg ptychography can in principle provide equivalent information45. Hexagonal manganite multiferroics often contain dense elements such as dysprosium that can produce dynamical scattering effects. While in principle this may influence the BCDI phase reconstruction process, dynamical scattering effects are often found to be less significant than refraction and absorption effects and therefore generally do not warrant further consideration46,47,48.
Bragg CDI also provides strain information and has revealed in this study that strings, which are lines of the paraelectric phase trapped in the ferroelectric structure, induce tensile and compressive strain of up to 0.1 along commensurate paths, with magnitude exceeding that of strain within the broader domain regions. Future BCDI studies on multiferroic strings where the effect of strain is studied dynamically, via progressive deformation49, could provide further insight into the role of strain in the formation of multiferroic strings.
In summary, we have demonstrated three-dimensional imaging of predicted one-dimensional topologically protected strings in a single nanocrystal of multiferroic hexagonal manganite h-DyMnO3. The density of the strings matches that inferred from surface measurements of bulk samples prepared at similar quenching rates. In addition, phase map information reveals that phase vortex structures, whose core locations define the path of each string, appear with a preferred winding direction and separation.
Our findings indicate the promise of lens-less imaging techniques such as Bragg CDI for the study of three-dimensional structure and properties of topologically protected defects in materials. Possible other areas of application include monopoles, strings and textures in liquid crystals, dislocations in metals and polar skyrmions in ferroelectrics. We hope that the results presented here inspire further work in these directions.
Methods
Synthesis and quenching of DyMnO3 nanocrystals
Bulk DyMnO3 usually crystallises into a perovskite structure. However, when the composition
is melted and crystallised under argon, some oxygen is released resulting in an oxygen-deficient composition DyMnO3−δ (1 > > δ > 0) which adopts a hexagonal YMnO3 type structure28,29. This structure is denoted as h-DyMnO3.
Bulk melt-grown h-DyMnO3 single crystals were mechanically ground in to a fine nanocrystalline powder and transferred to a ceramic boat for annealing. The annealing was carried out under vacuum at 1000 °C for 10 min. After the annealing period was complete, in-vacuum manipulation was used to swiftly translate the ceramic boat into the room temperature portion of the vacuum furnace thus inducing rapid quenching, at ~1000 K/s, of the annealed nanocrystals. The h-DyMnO3 nanocrystal powder was subsequently dispersed in isopropanol and sonicated for 15 min to ensure uniform dispersion. Following sedimentation of the heavier nanocrystals, the supernatant solution from the upper layer was carefully pipetted and drop-casted on to a cleaned Silicon (100) substrate to form a thin layer of mono-dispersed h-DyMnO3 nanocrystals.
Responses