Time course observation of cross-sectional shape of iPS cell colony using ultrasound spectroscopic imaging
Results
Spectroscopic colony imaging
We successfully obtained the ultrasound waveforms of hiPSC colonies every 20 min for longer than 24 h using the originally developed system as shown in Fig. 1 (details are shown in the Methods). The echoes from the cell surface and the culture surface appear on the detected waveform separately, which indicates that the colony height can be calculated from the time difference between the two echoes (Fig. 2a–c). However, when the colony diameter exceeds ~300 µm, the echo from the cell surface does not appear near the edge of the colony, indicating lower cell height there. Therefore, we construct the spectroscopic images by the procedure shown in Fig. 2d and in the Methods to determine the cell height at such a thin region using the interference conditions. Interestingly, fringe patterns appear near the edge of the colony when the colony diameter exceeds ~300 µm (Fig. 3 and Supplementary Movie 1). To confirm that they are formed by the interference of the two echoes, we choose a pair of constructive/destructive interference conditions at different frequencies at the same height. For example, the constructive condition at 100 MHz and the destructive condition at 150 MHz occur at the same height when (m=1) in Eqs. 1 and 2 (see the “Methods” section), and these two areas should overlap in their merged image. Figure 4a clearly demonstrates this phenomenon, proving that the fringe patterns are formed by the interference of the two echoes. Based on this consideration, the height distribution on a cross-section of the colony is analyzed to investigate the change in the cross-sectional shape during cell culturing. The height of the position at which the two echoes are separately detected is calculated from the time difference between them, and it is determined by the interference conditions when the two echoes overlap (Fig. 4b). These procedures require the sound velocity in the cell, and we used a fixed value of 1550 m/s because previous measurements show the sound velocity between 1500 and 1600 m/s16,17,18. We confirmed the validity of this value by evaluating the height of a well-grown colony calculated from the time difference between the echo from the cell surface and that from the culture surface at a different position where no cell existed using the known sound velocity of the culture medium (1530 m/s). It agreed with the cell height calculated from the time difference at the same position with the assumed sound velocity in the cell within a 10% error.
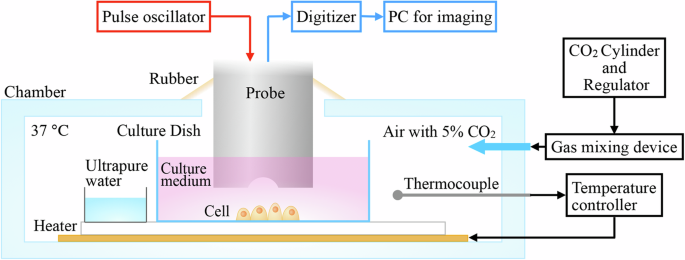
Schematic of the high-frequency focused ultrasound system developed here for long-time acoustic imaging of live cells.
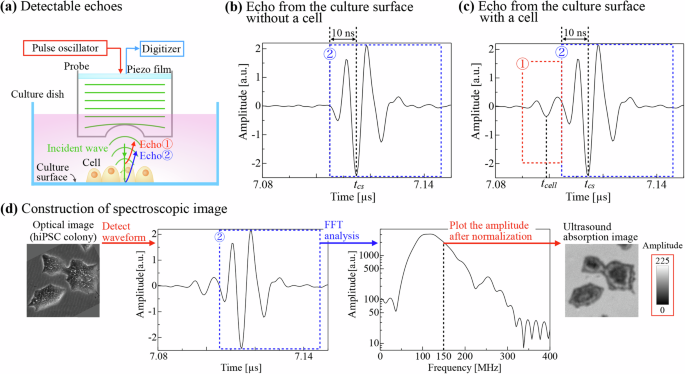
a Schematic of echoes from the cell surface and the culture surface. ① and ② show echoes from the cell surface and the culture surface, respectively. b Representative detected waveform over culture surface where the cell is absent. c Representative detected waveform over a cell containing two echoes, showing ({t}_{{rm{cell}}}) and ({t}_{{rm{cs}}}). d Explanation for the reconstruction of the spectroscopic acoustic image of hiPSC colony at 150 MHz. (Note that the frequency distribution is shifted toward the low-frequency side in Fig. 2d because of the high ultrasonic attenuation at high frequencies in the culture medium).
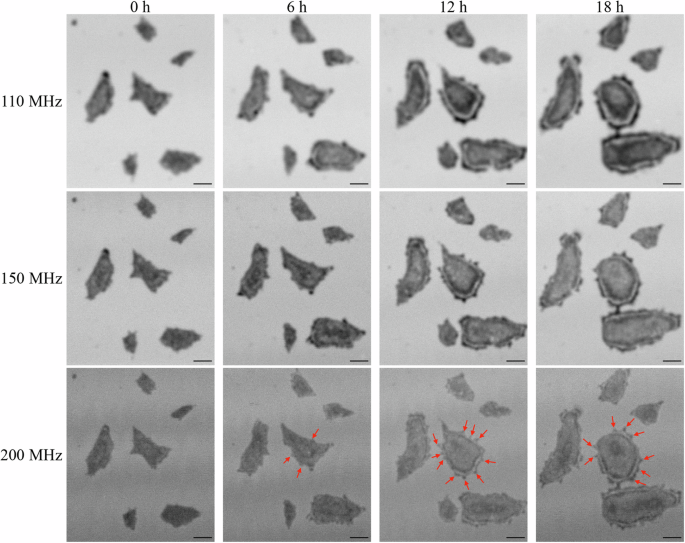
Spectroscopic acoustic images (110, 150, and 200 MHz) of hiPSC colonies every 6 h. Red arrows in images at 200 MHz indicate protrusions which are supposed to be filopodia. The scale bars indicate 100 μm.
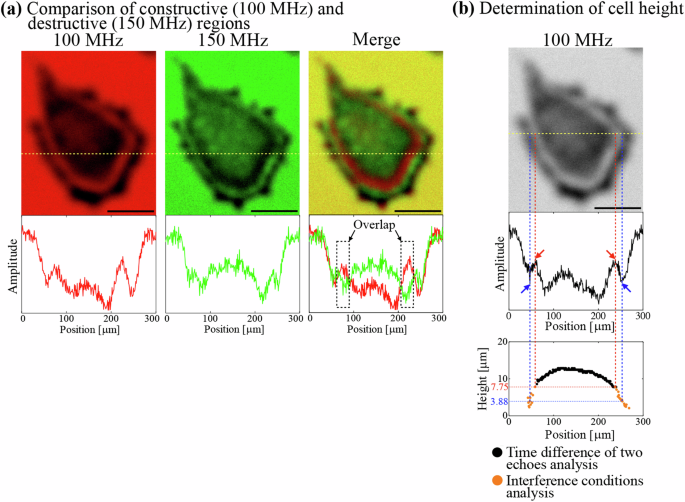
a Upper images show colored acoustic images of a hiPSC colony (12 h) at 100 MHz (red), 150 MHz (green), and their merged image. Lower diagrams show the corresponding amplitude distributions along the dashed lines in the upper images. The scale bars indicate 100 μm. b The upper is the acoustic image at 100 MHz of the hiPSC colony. The scale bar indicates 100 μm. The middle shows the amplitude distribution along the dashed line in the upper image. The red and blue arrows indicate the construction and destruction points, respectively. The lower diagram shows the height distribution determined by the time difference (black) and the interference (orange) methods.
We investigate the amplitude distributions in a cross-section at various frequencies (from 80 to 200 MHz at every 10 MHz) and determine their constructive and destructive points from the highest and lowest amplitudes around the interference area. We then calculate their heights using Eqs. (1) and (2) to reconstruct the height distribution around the interference area (orange plots in Fig. 4b).
Figure 5 and Supplementary Movie 2 show the time-course variation of the cross-sectional shape of the colony. The difference in height between the center and the edge of the colony is small at 0 h (Fig. 5a). (The time when the first image was obtained is set to 0 h.) The cell height near the center of the colony increases for the next 2 h (Fig. 5b), while the edge height and the in-plane area remain nearly unchanged. However, both the edge and the center of the colony become lower after that (Fig. 5c), and then, the cross-sectional shape approaches a dome shape, and the fringe pattern appears. After the dome shape is established, its shape near the edge is maintained (Fig. 5d, e).
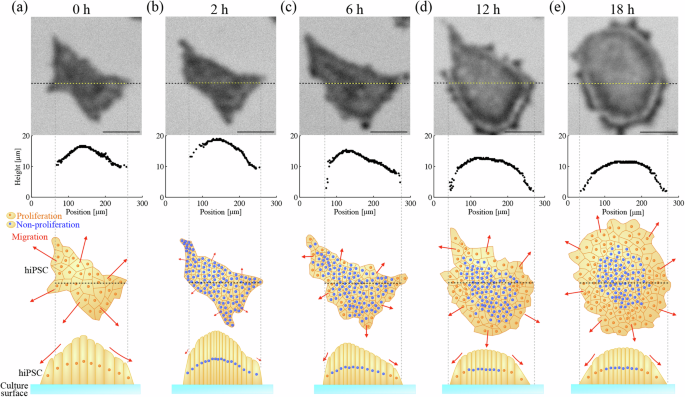
The time-course of cross-sectional height distribution of hiPSC colony at a 0 h, b 2 h, c 6 h, d 12 h, and e 18 h. The upper images are the acoustic images of the iPSC colony at 150 MHz. The horizontal dashed lines show the analyzed cross-section. Illustrations show conceptual diagrams for cell arrangement as the colony grows from a projected view (upper) and a cross-sectional view (lower). The color of the nucleus shows a proliferating or non-proliferating state. The length of the red arrows describes the cell motility. The scale bars indicate 100 μm.
Colony imaging with HA
The three-dimensional morphology of the hiPSC colony is mainly characterized by mechanical interactions between cells and between cell and substrate. HA has been used to temporarily disrupt the cell–cell adhesion mediated by E-cadherin19,20,21. Here, we obtain the spectroscopic acoustic images of the hiPSC colony exposed to HA and investigate the time-course cross-sectional shape shown in Fig. 6a and Supplementary Movie 3 (the HA solution was added to the culture medium after the first acoustic image as 0 h is obtained). The fringe patterns do not appear on the spectroscopic acoustic images even when the colony diameter exceeds ~300 µm, and the echoes from the cell surface and the culture surface are detected separately at both the center and the edge of the colony. The in-plane area acceleratingly increases from ~3 h, accompanied by lowering the colony. Thereafter, the height distribution fluctuates. The edge of the colony fails to show a gentle slope, making the colony shape nearly flattened (Supplementary Movie 4).
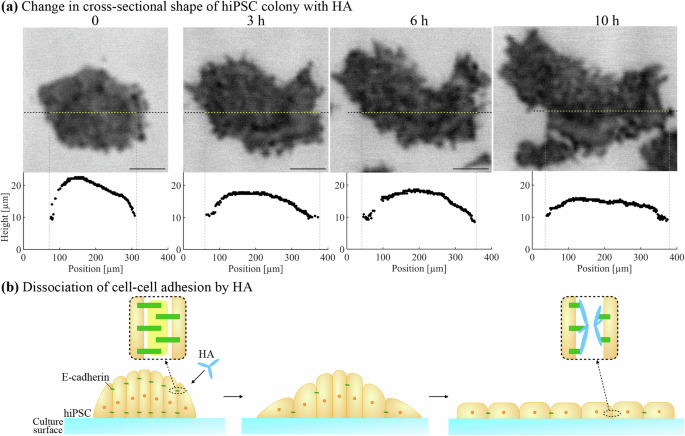
a The time-course cross-sectional height distribution of hiPSC colony with HA. The upper images are the acoustic images of hiPSC colony at 150 MHz and the dashed lines show the analyzed cross-section. The scale bars indicate 100 μm. b Schematics of colony cross-section changes after HA exposure.
Discussion
The three-dimensional morphology of the hiPSC colony has been demonstrated to affect various cell functions, indicating that the real-time measurement of the morphological change is highly important10,22,23. However, to the best of our knowledge, there has been no research observing the cross-sectional shape of a colony in culture for longer than 24 h. Here, we originally developed the spectroscopic SAM system which is applicable to cells in culture, and investigated the change in the cross-sectional shape of the hiPSC colony during its growth for a long time. For this, we kept the incubator chamber at 37 °C and filled it with humid air of 5% CO2 (Fig. 1). We placed the probe in the chamber to minimize the incubation space to reduce the risk of contamination of the sample. The previous research reported that when the focal distance of the acoustic lens is as short as ~0.1 mm, cells are damaged and detached from the substrate because of the shear stress during scanning15. We, therefore, use the acoustic lens whose focal distance is about 2 mm in the culture medium. hiPSCs are known to be sensitive to mechanical stress24, but their proliferation rate was less affected by our observation compared to the cells cultured normally. Also, the monitoring of the human mesenchymal stem cells we reported previously25 showed no apparent change in the proliferation rate. Furthermore, we monitored the temperature change at the focal point by placing a thin thermocouple there, but no temperature increase of more than 0.1 °C was observed after 15 min of irradiation. Therefore, we expect that our observation will cause little or no damage to the cells.
We then obtain the ultrasound waveforms and construct the spectroscopic images of hiPSC colonies for 24 h using the developed system (Fig. 2). From the fringe patterns observed near the edge of the colony (Fig. 3 and Supplementary Movie 1), we analyze the height distribution (Fig. 4) and obtain the time-course variation of the cross-sectional shape of the colony (Fig. 5 and Supplementary Movie 2). Previously, the frequency-domain analysis has been applied for simultaneously determining the thickness and sound velocity of a tissue attached to a flat solid in the interference region between echoes from the tissue surface and the solid surface26. However, we chose not to adopt this approach for two reasons. First, the frequency-domain analysis requires a high-quality reference waveform in the region where no cells are present, which is used for normalizing the waveform at the cell region. However, cultivation of iPSC on the dish requires a coating of an appropriate protein layer (laminin-511 E8 fragments in this study), which shows a thickness variation, making it difficult to use the echo in the absence of cells as a reference. Supplementary Fig. 1, for example, shows the dish echoes in the cell-absent regions; the standard deviation of the traveling time indicates a thickness error of about 1.4 µm. Therefore, it is better to determine the thickness using the time difference between the two echoes at the same point (({t}_{{rm{cs}}}-{t}_{{rm{cell}}})). Second, the wave distortion due to the dispersion characteristics in the cell is negligible. As shown in Supplementary Fig. 2, the amplitude spectrum of the echo at a cell-present region is nearly identical to those of echoes at cell-absent regions, indicating the validity of determining the thickness from the time difference (({t}_{{rm{cs}}}-{t}_{{rm{cell}}})). This is because the ultrasound-propagation distance inside the cell is significantly small compared to that of the culture medium. Previous studies used only a single frequency for the cell-height measurement15,27,28,29, and the following two issues have been raised in them. First, it was difficult to identify the order of interference, because a series of constructive and destructive rings appeared. Second, the minimum detectable value was limited to a quarter of the used frequency. On the other hand, we applied the spectroscopic analysis to obtain the cell height using various frequencies, which makes it easier to determine the order of interference and also allows us to improve the resolution of the height distribution measurement.
We estimate the error in the colony height analyzed by the time difference from two echoes to be 0.19 µm from the standard deviations of seven independent measurements at the same position for 47 different points. The error of the colony height in the thin region analyzed by the interference condition will be principally caused by the ambiguity of the frequency distribution used and the error in determining the light and dark points. As for the former, as shown in Supplementary Fig. 3, slight differences in the acoustic properties due to position affect its spectral distribution. However, considering that the variation in the peak frequency was less than 5%, its effect on the height measurement is also expected to be less than 5%. In the latter, the determination of dark and light areas was performed by the least-squares method, and the uncertainty of the central axis (evaluated by the Jacobian matrix) was about 1 μm. From the slope of the height near the edges, this would cause an error in the height estimation of about 0.5–1 µm. Ultimately, the thickness error from our method is estimated to be less than 1 μm.
The growth process of the colony has been studied by the in-plane two-dimensional observation methods30,31 and numerical stimulations32,33 which indicated the importance of the balance between cell migration and cell proliferation. However, because there was no label-free tool to monitor the three-dimensional morphology non-invasively for a long time, it has been difficult to understand their relationship more deeply. It is indicated that at the beginning of the colony formation, the cell density inside the colony is nearly uniform because the migration rate matches the proliferation rate30,31. As the colony growth proceeds, the cell migration fails to keep up with the cell proliferation, and the cell density increase by the proliferation becomes dominant rather than its decrease by the area expansion due to the migration30,32. When the cell density in the colony reaches its maximum, the colony growth is governed by cell migration; the cells near the edge move toward the outside of the colony to make space for cell division32,33. Here, we discuss the time-course cross-sectional shape of the hiPSC obtained in this study in terms of cell migration and proliferation, following the explanation above. The cross-sectional shape at 0 h shows a smaller difference (~5 µm) in height between the center and the edge (Fig. 5a), and we expect nearly uniform cell density in the colony. For the next 2 h, the cell height around the center increases while the colony projected area is almost unchanged (Fig. 5b), which means that the cell proliferation is more significant than the cell migration, resulting in the increase in the cell density. However, from 2 h to 6 h, the colony height becomes significantly lower, especially near the edge. From this period, protrusions are frequently observed at the outline of the colony as indicated by red arrows in Fig. 3, which are considered to be filopodia that extend as the cells migrate34. This indicates that the cell density reaches the maximum during this period, and the cell migration is accelerated near the edge. After 6 h, the cross-sectional shape approaches the dome shape (Fig. 5c): It is interesting that the maximum height near the center and the shape of the dome are maintained while the projected area increases (Fig. 5d, e and Supplementary Movie 2). It is suggested that a well-grown colony has two regions, consisting of non-proliferating stationary cells near the center of the colony and proliferating cells near the edge19,31,32. Our observation is then attributed to an excellent valance between cell migration and cell proliferation kept for a very long time (> ~ 10 h) after the dome shape is established. The constant cell height near the center can be thus achieved by the non-proliferating stationary cells.
Finally, we discuss the height distribution of the hiPSC colony exposed to HA. Typically, hiPSCs form a tightly packed colony due to E-cadherin-mediated adhesion, and the cells in the colony are pulled by migrating cells and pushed by dividing cells8,9, resulting in the round cross-sectional shape (Fig. 5). Especially, lower height area appeared near the edge of the well-grown colony due to the traction force from the neighbor cells.
On the other hand, the HA exposure reduces the interaction of cells with their neighbors, resulting in their uniform dispersion in the colony19. Thus, the cross-sectional shape becomes flattened, and the fringes near the edge of the colony do not appear as shown in Fig. 6 and Supplementary Movies 3 and 4. Furthermore, the previous study has shown that the disruption of the cell–cell adhesion by HA promotes the migratory behavior of each cell and increases the proliferation rate due to sufficient space for cell division19. In our experiment, the center of the colony becomes significantly lower for the first 3 h after the HA exposure, and the in-plane area constantly increased, indicating a higher migration rate. The fluctuation of the colony height before becoming flattened suggests the unconstrained cell movement.
In the present study, we non-invasively achieve the measurement of the change in the cross-sectional shape of the hiPSC colony using ultrasounds. It has been well recognized that ultrasound is capable of measuring three-dimensional shapes of various structures, including cells16,17,18. However, no study has achieved a long-time monitoring of their dynamic changes in live cells. A confocal microscopy, for example, can give three-dimensional information, but because it is applicable to dead cells and needs labels, it will not be comparable to the shape obtained by our SAM for live cells without labels.
Our result reveals that the cell-height change depends on the stage of the colony growth and the position in the colony. It is reported that cells in the colony exhibit the position-dependent cell function22,23,35. For instance, Rosowski et al. reported that cells at the edge of the colony differentiate faster than those in the center of the colony22, and Kim et al. showed that cells at the edge of the colony are specialized in protein expression35. The position-dependent cell characteristics arising from the cell–cell adhesion in hiPSC colony are known to result in heterogeneity in the cell fate36. Moreover, previous studies have reported that when cells near the center of the colony are subjected to excessive compressive stress, a deviation from the undifferentiated state is induced, preceded by a local increase in height near the colony center19,37. Such a local increase in the colony height has been previously evaluated using confocal microscopy by interrupting cell culturing. However, because our method can detect such events without interrupting cell culturing, it allows us to prevent deviation from the undifferentiated state in advance, thus contributing to the practical bioengineering process. In addition, the height distribution of the colony can provide us with the colony volume. It is reported that the cell volume impacts signaling events that regulate proliferation, migration, differentiation, and apoptosis38,39. Various techniques have been applied to measure the cell volume10,11,12. For example, Hessler et al. studied the volume decrease during apoptosis for 3 h using the AFM11. However, there is no research studying the cell-volume change for a live cell non-invasively for longer than 24 h. Therefore, it is useful to know the three-dimensional information about the cell morphology to explore the relationship between the time and position-dependent morphology and the cell function. As our ultrasound system developed here non-invasively provides the height distribution as well as the in-plane two-dimensional shape, it is expected to play an important role in improving understanding of the relationship between the cell morphology and the cell functions by combining the optical microscopy observations.
Methods
Construction of a focused ultrasound system for live cells
A culture environment is created in the chamber to apply the ultrasound system for live cells (Fig. 1) as shown in our previous study25. The gap between the chamber and the acoustic probe is covered by a rubber sheet, which seals the chamber as the probe moves. The temperature is kept at 37 °C by a feedback heater controller with the thermocouple signal. Air with 5% CO2 is flowed into the chamber by a gas mixing device. A dish filled with ultrapure water is placed in the chamber to prevent evaporation of the culture medium.
Waveform acquisition and spectroscopic analysis
The culture dish is scanned by the acoustic probe (IT-9898; Insight k.k., Japan) which has the piezoelectric film on the top surface (Fig. 2a). The plane longitudinal-wave pulse with a nominal center frequency of 180 MHz is driven by pulsers (DPR500 and RP-U4; Insight k. k., Japan) and focused on the culture surface by the acoustic lens whose focal length is about 2 mm. (180 MHz is a nominal value given by the developer, and actual center frequency was near 220 MHz.) It is reflected at the cell surface and the culture surface, and these echoes are detected by the same piezoelectric film and sent to the receiver (DPR500; Insight k.k., Japan) (Fig. 2b, c). (Note that the culture surface is not perfectly flat because of the uneven distribution of the protein layer.) The scan step size was typically 1 µm, and the scan duration was about 7 min to obtain 800 × 940 pixels with a pulse repetition rate of 1.9 kHz.
The waveform data (no averaging) at individual scanning points are converted to the digital binary data by a digitizer (UD121G; Insight k.k., Japan) with a 2-GHz sampling rate and a 16-bit resolution. The trigger signal was generated by the digitizer, which minimized the system jitter as small as 0.1 ns or less. While the echo from the culture surface appears everywhere, the echo from the cell surface is not always observed even when the probe is above the cell, because the echo from the cell surface overlaps with that from the culture surface in a thin cell. In this case, these echoes interfere, and considering the relationship Zw < Zc < Zd, where Zw, Zc, and Zd denote the acoustic impedances of water, cell, and culture substrate, respectively, constructive or destructive interference occurs with the following equations, respectively,
Here, (d) and (lambda) denote the cell height and the ultrasound wavelength, respectively, and (m) is an integer representing the order of the interference condition. We define ({t}_{{rm{cs}}}) as the representative detection time of the echo from the culture surface, which is determined as the minimum amplitude of the culture-surface echo as shown in Fig. 2b. By referring to the echo from the culture surface at the point where cells are absent, it can be recognized that the culture-surface echo begins from about 10 ns earlier than ({t}_{{rm{cs}}}). The boundary of the two echoes is, therefore, determined by (t) = ({t}_{{rm{cs}}}-10) ns, and the representative detection time of the echo from the cell surface, ({t}_{{rm{cell}}}), is determined as the minimum amplitude in (t) = ({t}_{{rm{cs}}}-10) ns (Fig. 2c). The time difference between ({t}_{{rm{cs}}}) and ({t}_{{rm{cell}}}) is used to calculate the cell height as shown later.
Construction of spectroscopic acoustic image
Spectroscopic acoustic images are constructed to evaluate ultrasound absorption and the height of hiPSCs as explained in Fig. 2d. After performing the fast-Fourier-transform (FFT) procedure on the echoes from the culture surface, the amplitude of every position at a specific frequency for imaging is normalized and plotted to construct an 8-bit image.
Cell preparation
hiPSCs (1383D2 cell line) were obtained from the Center for iPS Cell Research and Application at the Kyoto University40. Single cells were seeded as 2.5 × 10³ cells/cm2 with 10 µM Rho-associated protein kinase inhibitor (CultureSure Y-27632; Fujifilm Wako Pure Chemical Corp., Japan) on 35-mm-diameter culture dishes (81156; ibidi GmbH, Germany). The culture dishes were coated with laminin-511 E8 fragments (iMatrix-511; Nippi, Inc., Japan). hiPSCs were cultured at 37 °C and 5% CO2 in the culture medium (StemFit AK02N medium; Ajinomoto, Japan), which was changed every 24 h. 1% amount of antibiotic-antimycotic (15240062; ThermoFisher Scientific, Japan) was added after 72 h from the cell seeding, and then cells were used in the experiment of acoustic measurements.
Exposure to botulinum hemagglutinin (HA) complex
The procedure used for reconstituting the functional HA complex was similar to the previous studies20,21. The HA solution was added to the culture medium (the final HA concentration was 1 nM) after the first acoustic image was obtained.


Responses