Towards a unified approach to prioritization of regenerative agricultural practices across cropping systems

Introduction
The toll of global food production on the environment remains exceedingly large1,2,3, with agricultural production responsible for a large share of global GHG emissions4,5; pollution of waterways and drinking sources3,6; loss of biodiversity7,8; and an overall immense societal cost that must be reduced9,10,11. A noteworthy direction to improve the sustainability of agricultural environments is to accelerate the adoption of regenerative practices. Regenerative agriculture (RA) typically promotes agronomic practices such as reduced tillage, increased soil cover (residue retention for protection), cover crops, more diverse crop rotations, livestock integration, more use of organic nutrient inputs (manure and composts), and reduced use of synthetic agrichemicals12,13,14,15. Regenerative agriculture should restore soil health, and reverse biodiversity loss14. A formal definition of what is RA, and how it differs from other similar concepts such as conservation agriculture, climate-smart agriculture or sustainable intensification, is still under debate14. Many of the field practices promoted by these concepts overlap. Schreefel et al.13 compared multiple definitions of RA, and suggested the following definition, adopted in this study: “an approach to farming that uses soil conservation as the entry point to regenerate and contribute to multiple provisioning, regulating and supporting ecosystem services, with the objective that this will enhance not only the environmental but also the social and economic dimensions of sustainable food production”. Similar to Rhodes16, we do not exclude the use of agrochemicals in regenerative agriculture, but strive to minimize their use. The EU has proposed a soil monitoring law, which includes information on regenerative practices that can potentially mitigate soil contamination, erosion and degradation17. Several national programs were installed to promote farmers’ best practices that can fall under such definition of RA, e.g., the USDA NRCS EQIP program18, and many food and beverages companies have committed to CO2 footprint reduction plans and sustainable sourcing schemes that are based on farmers adopting best management practices, e.g., the Science Based Targets Initiative database19. Several sustainability programs were proposed to address both farmers’ efforts and the outcomes measured in the field, e.g., the FAO SAFA framework20, RISE21, MASC22 and others, see Alaoui et al.23 for a recent review on this topic. Additionally, many commercial enterprises invest in monitoring the environmental impacts of their supply chains, often with their claims validated by a third-party company. These efforts mainly focus on reducing greenhouse gas emissions footprint of produced food (decarbonizing the supply chain), but may also include goals related to soil health, water use, and biodiversity.
The adoption of regenerative practices by farmers is a gradual process conducted through on-site experimentation, evaluation, demonstration of value, and incentives. Optimizing the regenerative state of crop production can rely on many criteria, such as improved soil organic carbon levels, improved soil structure, optimized chemical fertilizer and crop protection inputs, more efficient water use, and overall reduced environmental footprint while maintaining productive yields. The choice of optimization targets can therefore lead to the promotion of different regenerative practices, necessitating the establishment of production-specific priorities. Agricultural production systems are very diversified, occurring in different climates, soils, and cropping systems, which scientists refer to as ‘production environments’. Setting science-based priorities for different regenerative practices can aid in implementation and the resulting adoption rates, but requires tailoring to the specific needs and intended outcomes of a particular production environment. For instance, promoting residue retention and zero-tillage in drier production systems, where soil carbon levels are low, might hold greater importance compared to areas with carbon-rich soils in wetter climates, where nutrient or pest management could pose a more significant challenge. Just as nutrient recommendations or irrigation requirements are customized to specific site conditions, regenerative agriculture approaches should also be tailored accordingly to the unique characteristics of each production environment. In some national programs, such as USDA EQIP18, farmers can gain subsidies for adopting regenerative practices out of a list of eligible practices with different subsidy rates. The UK Sustainable Farming Incentive (SFI) and Countryside Stewardship (CS) programs offer varying subsidy rates for farmers to implement regenerative practices24. Brazil has a national subsidy program to promote regenerative agriculture practices25. Other countries have local support plans for farmers. Numerous food and beverage companies anticipate, and sometimes mandate, that their suppliers, particularly farmers, adhere to a comprehensive set of regenerative practices. However, these lists generally remain broad, often neglecting to consider local field conditions and lacking prioritization of the practices. In the absence of prioritization, the long evaluation process of regenerative practices by farmers might overlook important practices relevant to their specific production environment, can reduce adoption rates, and overall less efficient spending of public and private funding.
There is therefore a need to evaluate the prioritization of regenerative agriculture practices in a structured and standardized way. The optimization should be broad, adaptive to the production environment, and account for the many facets of regenerative agriculture. Standardized evaluation of practice importance can facilitate efficient scientific discussion, enable cross-comparison between different production systems, and promote efficient transfer of scientific knowledge among stakeholders.
Among the available quantitative methodologies for prioritization, the Analytical Hierarchy Process (AHP) is a widely used multicriteria assessment (MCA) methodology26,27. It is a mathematical method capable of integrating quantitative and qualitative knowledge of experts, based on a pairwise comparison procedure using an agreed appreciation scale. It is attractive for research where decisions are based on multiple criteria and dimensions28. AHP was previously used for various topics in environmental planning29 including, for example, spatial distribution of coal-fired power units30; decision-making in the mining industry31; optimizing irrigation systems32; and prioritization in soil conservation33.
We propose here an approach to prioritize regenerative agriculture efforts quantitatively based on cumulative scientific knowledge. Our objectives are: (i) to test whether synthesizing expert knowledge can identify priorities in regenerative practices, and if these priorities vary between production environments; (ii) to validate the reliability of both the methodology and the experts; and (iii) to demonstrate the credibility of the proposed approach for identifying sustainability management gaps, utilizing an existing sustainability monitoring framework in Maharashtra, India.
Results
Prioritization of field and input management practices
Eight regenerative practices were considered here: Four are related to field management: (i) cover cropping; (ii) crop rotation; (iii) residue management; and (iv) tillage management. Another four practices are related to input management: (i) optimizing the timing of nutrient applications; (ii) optimizing the rate of nutrient applications; (iii) integrated pest management (IPM) efforts; and iv) optimizing irrigation water delivery and rate. See Supplementary Information 1 for the rationale for their selection. Altogether, using pairwise comparison matrices, the experts generated 145 individual practice weights for the three cropping systems (see Methods section for a description of the AHP). The importance of indicators varied considerably among practices and production systems (Table 1). Cover cropping received the highest importance for semiarid vineyards system (41%), followed by the soybean (30%) and maize (21%) systems. Residue management shows a similar pattern, with increased importance for the vineyard systems (29%), followed by soybean (23%) and maize (14%). The higher importance of cover cropping and residue management for vineyard systems can be attributed to the lack of crop rotations in this perennial system, the lower amount of carbon residue returned to the system compared with tropical annual cropping systems, and the need to conserve soil moisture under a more arid climate. Crop rotation, evaluated only for the soybean and maize systems, received slightly higher importance for the maize system (28%) than for the soybean system (23%). The importance of tillage management was found highest in maize (36%), followed by vineyard (30%) and soybean systems (24%). The importance of nutrient rate was scored higher than nutrient timing for all three cropping systems (27% versus 19%, 26% versus 20%, and 37% versus 21% for the vineyards, soybean, and maize systems, respectively). The higher importance of nutrient rate reflects the large pollution risk associated with over-application of nutrients in these systems (specifically nitrogen34) compared with applying the right rate but with non-optimum timing. IPM efforts received similar importance across all production systems, with 23%, 29%, and 26% for vineyards, soybean, and maize systems, respectively. Precision irrigation efforts received the highest importance for drier vineyard systems (31%), followed by tropical soybean (25%) and continental maize (16%). Higher importance in vineyards can be explained by the critical role irrigation plays in drier climates compared with more humid soybean or maize systems, which are mostly rainfed. When considering the weights within a range of 10% below/above weight as equal, instances where the AHP-derived weights are identical are infrequent among individual experts (Fig. 1a). When experts were averaged within a cropping system, 13%, 43% and 63% of the indicators had equal weight for maize, vineyards, and soybean systems, respectively (Fig. 1b).

a Cumulative distribution of individual expert weights and their deviation from equal weight. The shaded area represents plus or minus 10% of equal weight. b The difference in AHP-derived weights from equal weight (%), for different practices and cropping systems, averaged over all experts. Grey lines represent the values of plus or minus 10% difference.
Experts robustness: Individual experts versus group mean
Expert knowledge was used to generate two parameters: (i) practice weight e.g., tillage management; and (ii) practice level normalized score e.g., no-till, minimum tillage, and conventional tillage. It is apparent from Table 1 and Supplementary Information 2 that there are instances where experts hold differing opinions regarding the significance and rating of a particular practice. The coefficient of variation varies considerably between practice weights (Fig. 2a), but experts generally agreed on the best practice level within each practice (Supplementary Information 2). The maize system exhibited the highest level of disagreement regarding the weight of practices, while the soybean system showed the lowest disagreement. Notable cases where experts disagreed on the practice weights were cover cropping, crop rotation, and nutrient timing in the maize system, and IPM efforts in the vineyard system. Conversely, a notable case where experts agreed on the practice weight is crop rotation in the soybean system.
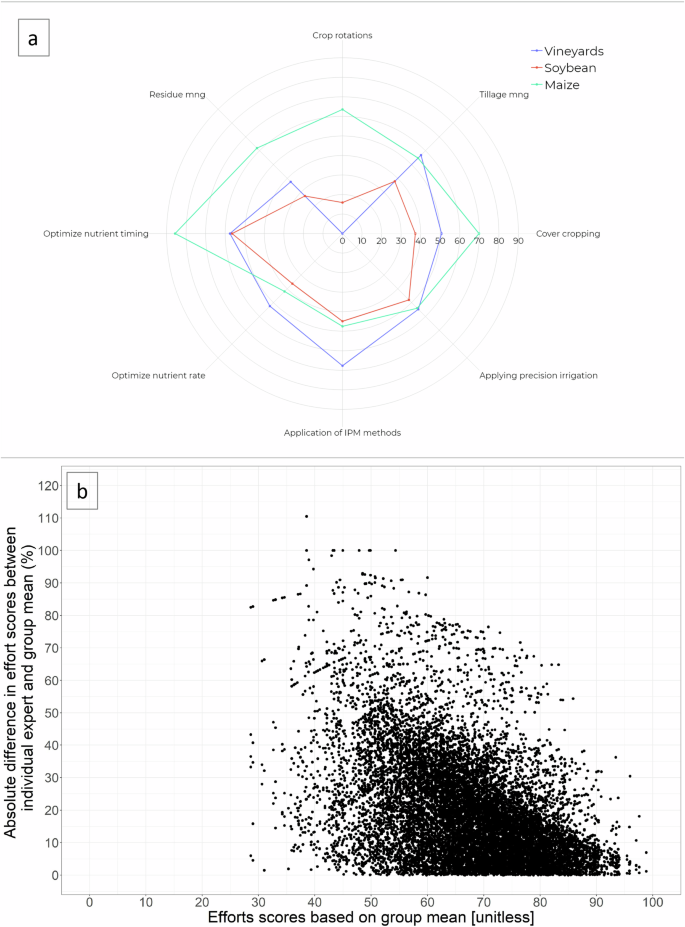
a A spider diagram presenting the coefficient of variation of AHP-derived weights by each expert for each effort indicator. b Absolute difference in effort scores when calculated using individual expert weight and normalized scores, versus using the group mean values.
The disagreement among experts suggests that depending solely on individual experts’ responses can result in divergent scoring compared to utilizing a group of experts. To delve deeper into this issue, a Monte Carlo simulation was conducted to test the variance between the individual experts’ weights and practice-level scores compared to the group mean values. For each cropping system and expert, a practice level was randomly sampled for each practice in the two effort groups (field practices and input management). This procedure was repeated 1000 times for each effort group, resulting in 36000 parameter sets. For each parameter set we subsequently calculated the scores of each effort practice using both the respective individual expert weights and practice level scores, and the group mean relative weight and mean practice level scores. Figure 2b presents the results, where the effort scores, calculated from the mean group values, are shown on the X-axis, while the absolute differences between individual experts and the mean values are depicted on the Y-axis. The findings indicate that, on average, the absolute difference is 20%, yet in certain cases, it can escalate to 111%.
Application of the sustainability framework in vineyards systems in Maharashtra India
To demonstrate how AHP-derived importance weights can be used to quantify regenerative efforts, we applied them to real-world data (see methods section for detailed description). The framework consists of the eight efforts indicators discussed in the previous section, which are matched with an additional seven outcome indicators: (i) SOC%/Clay% ratio; (ii) active carbon (AC), also known as permanganate-oxidizable C; (iii) available water capacity (AWC); (iv) system N input-output balance; (v) system P input-output balance; (vi) yield-scaled CO2 losses; and (vii) irrigation water use. These outcome indicators are based on measured data sampled in the field. The framework was applied on thirty vineyards in the state of Maharashtra, India, with soil type Vertisol and a dominant clay texture ( ~ 40–70% clay fraction, Supplementary Information 5). The climate is semiarid, with mean annual rainfall of 562 mm (average of 2015-2023, IBM weather data), and mean annual potential evapotranspiration of 1667 mm (average of 2020–2023, IBM weather data). Figure 3a depicts the total sustainability score of the thirty vineyards. Detailed scores of the vineyards in each indicator are presented in Supplementary Information 6. The overall score range is 53–73 (out of 100), with a mean value of 61. These results reveal that there is ample room for improvement in these vineyard systems. Figure 3b presents the fulfillment of potential scores for all indicators, averaged over all vineyards. Overall, the vineyards have a generally high efforts score, but perform poorly on some of the outcome indicators, mainly N and P balance, and the yield-scaled CO2 losses.
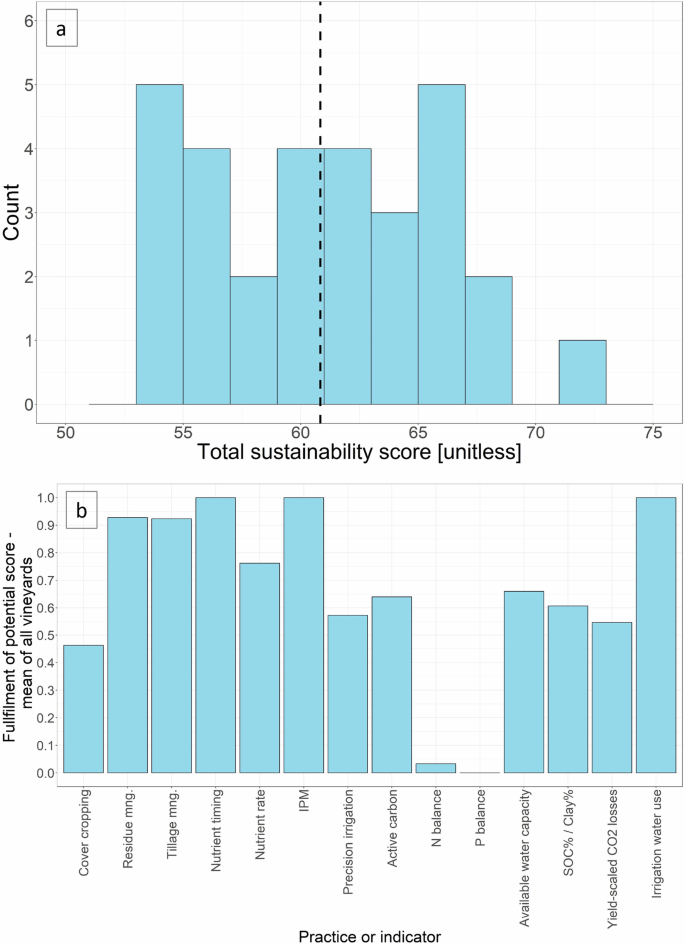
a Total sustainability scores, and b the mean fulfillment of potential scores for the effort and outcome indicators.
Discussion
Scientific frameworks to quantify the sustainability of agricultural production through sets of outcome indicators are in frequent use35,36. Evaluation of these outcome indicators is done in relation to their production environments35,37. However, so far, a similar structured context-based evaluation of farmers’ efforts based on a specific cropping system has not been done. Prioritization of these efforts, and their translation into higher scores in outcome indicators, can promote a substantially more regenerative and sustainable crop production. Nevertheless, the regenerative practices of many national and commercial frameworks are not prioritized, assuming a similar importance of different practices. Our results indicate that the assumption of uniform importance of regenerative practices depends heavily on the cropping system, and in most cases is incorrect (Table 1 and Fig. 1). Integrating multiple experts’ input using AHP allowed us to capture production-specific considerations. Cover cropping and tillage management, for example, are two regenerative practices often promoted in national and commercial programs. Our analysis suggests that their importance and hierarchy differ across systems: cover cropping was found more important than tillage management for dry vineyard systems, but the opposite was found for continental maize crops. The change in hierarchy reflects the production-specific conditions, notably the need to support the buildup of soil organic carbon in the dry vineyard system and to mitigate its loss in the continental maize system through better tillage management. Production-specific priority adjustments were found also for other considered practices (i.e., irrigation, crop residue management, and more). The expert-based approach was able to capture these production-specific intricacies and assign the relevant priorities.
AHP allows to identify where experts agree/disagree on the importance of practices in a specific system (Table 1, Fig. 2a). The coefficient of variation for the practice weights ranged from a low value of 16% (crop rotation in tropical soybean system) to 86% for nutrient timing in the continental Maize system. Monte-Carlo simulations clearly show that relying on a single expert can lead to a very different sustainability evaluation than using a group mean, with a difference in scoring of up to 111%. Previous studies found both single38 or multiple33 experts are adequate to support a robust AHP analysis; the latter is also supported by many studies applying a Delphi method39. A valid and relevant question pertains to how to identify suitable experts. A chosen expert should have experience and intrinsic know-how regarding the cropping system and the field practices under evaluation. An internal guardrail is set in the form of a consistency test: for each expert independent input, a test evaluates the consistency of the assigned scale values over all practices, and a performance threshold value is used to sieve out inconsistent experts (see methods section for details). In our analysis, the input of one expert was found inconsistent and was excluded. All remaining 11 experts’ inputs had consistency values within the desired threshold. As the field of regenerative agriculture is broad and includes many aspects (e.g., carbon management, soil health, crop protection, irrigation), we believe that using a group mean integrates diverse perceptions and individual experiences, thus enhancing the reliability and robustness of the analysis. Therefore, we recommend for future use of AHP for prioritization to consult with a group of experts.
Effort indicators are frequently used by food and beverage companies to monitor their supply chain sustainability levels. These indicators are descriptive, include items such as tillage type, application of cover cropping, or methods of nutrient management, and often rely on farmer surveys or reporting that can be deployed at scale. Monitoring outcome variables, such as SOC%/Clay% ratio, or nutrient balances, requires extensive field-level data and sampling, is costly, and can be logistically difficult to coordinate and obtain. Integrating AHP-derived weights into a sustainability framework enables the quantification of both regenerative efforts and outcomes (Fig. 3a). Using extensive data from thirty vineyards in Maharashtra India, we were able to identify management inefficiencies (Fig. 3b, Supplementary Information 6) and found the relationship between effort and outcome indicators to not always be evident. The effort towards optimizing nutrient rate, for example, received high scores based on farmer reports of an approach that includes soil and leaf sampling (Supplementary Information 6). In contrast, the measured data suggested excessive fertilizer applications in all vineyards, far exceeding levels that may be deemed acceptable for staying within planetary boundary targets40,41. High N surplus values for India cropping systems were also found in previous studies42. Possible reasons for excessive nutrient rates are: (i) nutrients are subsidized by the Indian government43, making fertilizer a low-cost input for the farmers; (ii) farmers indicated that they assume a low nutrient use efficiency of 15-20% (Sanjay Biradar (ICL India), personal communication); (iii) all crops grown were table grapes, where farmers strive for higher quantity rather than optimize the quality of the grapes (as done in grapes grown for wine), and (iv) farmers are unaware of optimum nutrient rates and risk-averse towards insufficient nutrient applications. The discrepancy between the good effort scores and the poor nutrient balance scores emphasizes the importance of coupling effort indicators with outcome indicators measured at the field level.
This study proposes an effective and structured methodology to integrate diverse knowledge to determine the relative importance of various regenerative practices. Identifying what regenerative practices are better suited for a specific production environment can be achieved by assembling a comprehensive experimental database encompassing different crops, climatic regions, and soils. Notable recent efforts to support this are the global SoilHealthDB44, the North American Project to Evaluate Soil Health Measurements (NAPESHM)45, the global Cropland Nutrient Balance reference database in FAOSTAT46, or the Global Crop Nutrient Removal Database47. In parallel to such efforts, we propose to generate a continuous quantification of the efficacy of practices in different production systems based on expert-based methods. Future efforts can combine the two approaches, to allow an iterative validation and the improvement of the expert’s response using empirical data. Standardized protocol through AHP to evaluate the importance of regenerative practices can allow cross-production system comparisons, foster better discussions within the scientific community, and facilitate an educational process to pinpoint areas of consensus and divergence. This can ultimately lead to the development of improved guidelines for promoting regenerative practices and more effective allocation of funding through public and private initiatives. We encourage further evaluation and fine-tuning of the proposed approach, including the specific indicators and their scoring. A potential limitation of the AHP approach is that in contrary to a data-driven approach, where historical experimental data can be used to identify the practices to be evaluated, in the AHP procedure the list of considered practices is predefined based on a literature review and discussions with the experts. As such, local practices not identified in the literature review may be overlooked. This study demonstrated how AHP-derived weights can be coupled to extensive field sampling to monitor sustainability levels in one cropping system (vineyards grown on fine-textured soil, in a semi-arid climate in India). Future studies, focusing on additional and diverse cropping systems, can allow a comparative study of the sustainability levels of these production environments.
Methods
Study regions
In crop production, sustainability efforts should account for climate, soil type, and crop type35. For developing and evaluating the AHP approach, three different production systems were considered in our analysis (Fig. 4):
-
a.
Vineyard system in the state of Maharashtra, India: Köppen climate classification Bsh, Vertisol soil type48, fine soil texture. Also used as a case study with data collected from vineyard farms (Supplementary Information 5).
-
b.
Soybean systems in Brazil’s Cerrado region: Köppen climate classification Aw, Ferralsol soil type48, medium soil texture.
-
c.
Maize (corn) systems in the US Midwest: Köppen climate classification Dfb, Phaeozem soil type48, medium soil texture.
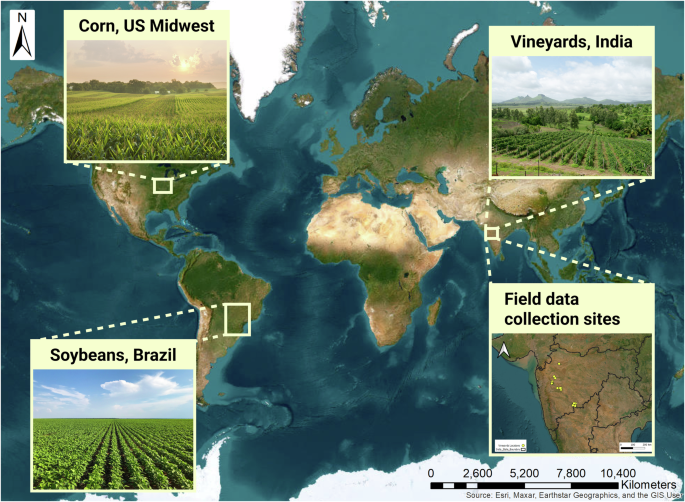
Background map credit: Esri, DigitalGlobe, GeoEye, i-cubed, USDA FSA, USGS, AEX, Getmapping, Aerogrid, IGN, IGP, swisstopo, and the GIS User Community. Cropping systems photos credits: Shikha a; Dan Thornberg; FR.Agro /Shutterstock.com.
The AHP procedure
The AHP method was utilized here to assign weights to the factors impacting sustainable agricultural systems. In general, AHP follows standard procedures where a calibrated Saaty scale (Table 2) is used to quantify the relative importance (weights) of factors by experts and measure their consistency in doing so29.
For example, a pairwise comparison reciprocal 3×3 matrix with different (x) as the appreciation values between every two indicators is shown in Equation 1. The values are entered into the matrix by the experts and the reciprocal of the entry (1/xij) goes to the opposite side of the main diagonal.
A priority vector is subsequently calculated using the eigenvector method, with ({y}_{i}), ({y}_{j}) and ({y}_{k}) as the relative weights, which sum up to 1:
Applying pairwise comparison necessitates an evaluation of each expert’s consistency, defined by Saaty27 as the consistency index (CI):
where (lambda) is the eigenvalue of the matrix, and n is the number of indicators considered.
The consistency relationship CR is determined using RI, a random index that depends on the number of factors considered (0.58 and 0.90, for n = 3 and 4 respectively)27:
CR is a measure of inconsistency in the pairwise comparison answers, and it should be 0.1 or lower.
In the case of our paper here, to quantify the relative importance of farmers’ regenerative agriculture efforts, and test whether this importance changes between production environments, eight efforts (practices) were selected: (i) cover cropping; (ii) crop rotations; (iii) residue management; and (iv) tillage management; (v) optimizing the timing of nutrient applications; (vi) optimizing the rate of nutrient applications; (vii) integrated pest management (IPM) efforts; and (viii) optimizing irrigation water delivery and rate. See Supplementary Information 1 for the rationale for their selection. In the AHP procedure, individual experts are asked to compare pairs of factors (here–practices) in their importance considering a predefined objective. Altogether, eleven experts were used in the analysis. All are active professionals from academia or the industry. The experts had different backgrounds such as nutrient management, carbon cycling, crop protection, irrigation management, or soil health. A summary table of their expertise is presented in Supplementary Information 7.
The field management and the input management practices were analyzed separately with different sets of objectives. For the field management practices, experts were asked to compare them in their importance in supporting regenerative agriculture (as defined by Schreefel et al.13). For the four input management practices, experts were asked to compare them in their importance to mitigate the environmental footprint of crop production. The proposed two sets of objectives for the field and input practices were crafted to account for the multiple facets of regenerative agriculture. Note that these objectives consider only the environmental aspect of different field practices, and don’t consider factors such as cost or logistical burden on the farmers. The rationale is that if the scientific best practice could be identified, and local practices found to differ than the best practice, external incentives could be set to drive change of management. To benefit from the standardization potential of the AHP approach, identical objectives need to be used on all cropping systems. To allow a comparative study, we evaluated the importance of the same eight regenerative agriculture practices in all three production environments. Other list of practices could be used if deemed by the experts more relevant to a specific production environment. The AHP procedure was conducted with each expert independently during separate meetings, and experts had no interaction with each other. Following the establishment of the relative weight of each practice and the respective consistency (Supplementary Information 4), experts were asked to review different management options within each practice (hereafter referred to as practice levels), including the identification of the best level for a given combination of crops, climate, and soil (Supplementary Information 2). Experts normalized the scoring by providing the scores in the form of fulfillment of the potential score. For example, the best practice level option will receive 100% of the potential points, whereas other practice levels will receive lower potential scores (the depth of penalty was left at the experts’ discretion).
The sustainability framework
The analysis utilizes an existing sustainability framework (RegenIQ, developed by Agmatix). Figure 5 is a flow diagram of the framework, which includes three components: (i) data collection of the field and management indicators using remotely sensed data or field measurements; (ii) AHP for prioritization and normalization of the input data by experts; and (iii) weighted linear combination to assign a composite sustainability score.
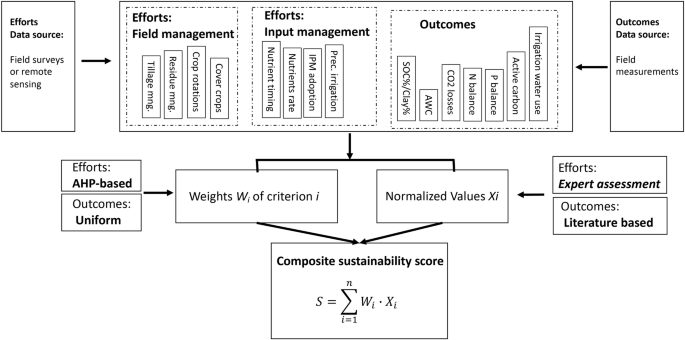
Flow diagram of calculating the composite sustainability score based on three steps: (i) data collection, (ii) normalizing the input data and assigning weights for prioritization; and finally, (iii) assigning a composite score using weighted linear combination.
Following Schreefel et al. 13, we promote the inclusion of environmental, social and economic aspects in regenerative agriculture monitoring frameworks. The proposed sustainability framework is a first step towards that, starting with applying AHP to account for the environmental aspects of regenerative agriculture. The social and economic aspects require different set of efforts and outcome indicators, as well of different experts to support the analysis, and will be explored and implemented in the framework in the future. Similar to other evaluation approaches, e.g., the SCORPAN model to predict soil properties49, our framework integrates measured field data to generate an evaluation score. Table 2 details the fifteen efforts and outcome indicators used in the sustainability framework and their supporting references. Detailed descriptions of the indicators can be found in Supplementary Information 1, while the different levels considered for each practice are presented in Supplementary Information 2. The framework has eight effort indicators and seven outcome indicators (Table 3). The pairwise comparisons used to generate the indicator weights were found consistent in all cases (Supplementary Information 4). The outcome indicators are based on measured data sampled in the field, and their score needs to be assigned and normalized. For the SOC%/Clay%, AC, AWC, and yield-scaled CO2 losses we adopted the approach suggested by (Amsili et al.35), where cumulative distributions of the indicators are calculated for each specific production environment (cropping system, climate, and soil). To create a representative distribution, we used reported measured data for similar cropping systems reported in the literature (minimum of 20 data points). Once the cumulative distribution is generated, the 20th, 40th, 60th, and 80th percentiles are used to define poor, low, adequate, high, and excellent levels, respectively. For the N and P balance indicators, as a first approximation, we used thresholds that have been proposed in the literature to avoid excessive surpluses or deficits40,41. We recognize, however, that nutrient balance-related outcomes may need to be tailored to regional or national levels, or different prevailing farming systems50. For the outcome indicator irrigation water use, we evaluated the quantity of water applied and rainfall in relation to the optimal irrigation quantity, calculated using daily rainfall, potential evapotranspiration and crop-specific coefficients (ETc) following the FAO guidelines51. The quantities are evaluated using a ratio of actual amount/weekly ETc amount, with <10% surplus considered adequate, 10–25% intermediate, 25–40% low, and >40% of surplus considered as poor management. In the final step, the efforts and outcome scores are combined into a single sustainability score. To prioritize an outcome-based approach, we assigned weights of 40% for the efforts score and 60% for the outcome score.
Prioritization within an actual production environment
To validate the approach in practical settings, we conducted a case study in vineyard systems in India. Comprehensive field data were gathered from thirty table grape vineyards located in Maharashtra during the harvest period spanning March to April 2023 (refer to locations in Fig. 4). The collected data consisted of fertilizer prescriptions, irrigation data, and all agro-technical field operations (including residue management, cover cropping, and tillage management). Additionally, the outputs were documented, including yield, and nitrogen and phosphorus concentrations in the harvested fruit. Soil texture, organic carbon, and active carbon were analyzed in each field using composite sampling techniques. Detailed sampling and analysis protocols for various measurements are provided in Supplementary Information 3.


Responses