Transcranial direct current stimulation targeting the bilateral IFG alters cognitive processes during creative ideation

Introduction
Creativity, well-documented as the ability to generate ideas that are both novel and appropriate1,2,3, is critical for education. One cannot teach students how to generate novel and appropriate products; however, one can teach students how to engage in the creative process4. Therefore, it is imperative to understand the mechanics of creative thinking. Neuroimaging studies have illuminated the multifaceted nature of the creative process, revealing its association with a wide array of brain regions ranging from the frontal cortex to more centralized areas, such as the cingulate cortex5,6,7,8,9; this has provided many insights into creativity from a process perspective. The inferior frontal gyrus (IFG) is one of the most important brain areas that supports creative thinking10,11,12,13. While both sides of the IFG are significant in the executive control of creative thinking, they may serve distinct roles. In a recent meta-analysis11, researchers indicated that the left IFG is involved in semantic retrieval, whereas the right IFG is crucial for inhibiting irrelevant information during the creative ideation process. In a stereo-EEG study, Huang et al.14 suggested that the left IFG plays a crucial role in habitual responses during Stroop tasks, which may manifest as automatic retrieval from semantic memory in verbal tasks. In contrast, anodal transcranial Direct Current Stimulation (tDCS) applied to the right IFG enhanced creativity when accompanied by improved inhibitory control15, highlighting the importance of the right IFG in inhibitory processes. These findings are primarily based on divergent thinking tasks and open-ended exercises that prompt participants to generate multiple creative solutions or ideas for a given question. During divergent thinking, the inhibitory function can suppress obvious thoughts and facilitate the generation of original ideas through remote associations. This may explain why studies involving tDCS have found that anodal stimulation of the left IFG can hinder creativity, whereas similar stimulation of the right IFG can enhance performance in creative tasks15,16,17.
In convergent thinking tests, in which participants must find a unique solution based on given cues, the relationship between task performance and the bilateral IFG can be more complex than in divergent thinking tasks. Unlike divergent thinking, solutions in convergent thinking tasks do not necessarily require the suppression of common thought. For example, the compound remote associate (CRA) task18, a well-established measure of convergent thinking, has been frequently used in research19,20. In the CRA task, participants must identify a word that can be combined with three given cue words to form three new words. Notably, these new words are common and thus may not require the suppression of obvious associations. This suggests that the effects of tDCS targeting the bilateral IFG during convergent thinking tasks may differ. In CRA trials in which the cues and solution share a relatively small semantic distance, suppressing obvious thoughts may not be an effective strategy. Therefore, quantifying the semantic characteristics of each CRA trial is crucial for comparing the effects of different tDCS protocols on CRA performance.
The semantic features of each CRA trial can be easily quantified by applying semantic distance21,22, which provides the possibility of investigating a more nuanced thinking process during creative ideation22. For instance, addressing CRA problems with a larger semantic gap between cues and answers may necessitate deeper engagement in semantic memory retrieval and the blocking of common thoughts during association. To accurately measure the semantic attributes of each CRA instance, this study adopted the relative semantic distance (RSD) metric. This involves calculating the ratio of the mean semantic distance between the cues and the answer to the average semantic distance among the cues themselves. The approach proposed in the present study introduced the semantic relationship between CRA cues based on previous studies21,22, to reduce potential biases linked to the relationships among cues (detailed in the Compound Remote Associates Task section). For instance, consider a CRA task involving cues such as “White” and “Snow,” which share a close semantic relationship. In this scenario, participants are likely to rely heavily on semantic memories related to winter, requiring greater inhibitory control and remote association to think beyond obvious connections. In contrast, a CRA task with cues like “Planet” and “Snow,” which are semantically disparate, might lead participants to explore a wider range of less restricted options. In scenarios in which the average semantic distance between the answer and each cue is identical, navigating to the correct answer in the first scenario could demand more effort from participants owing to the comparatively narrow activated semantic space. This contrasts with the second scenario in which a broader semantic field potentially facilitates a more accessible cognitive path to a solution. In summary, after controlling for the semantic distance between cues, we believe that RSD can serve as a good metric for estimating the engagement of remote associations during a CRA trial.
In addition, previous research has posited that the neural underpinnings of creative thinking remain stable during creative tasks, even after various tDCS interventions23,24,25. However, it is critical to acknowledge that the effects of tDCS might extend beyond mere enhancement or inhibition of certain cognitive functions; it could also lead to a modification of creative cognition itself26,27. For example, anodal stimulation of the right dorsolateral prefrontal cortex (DLPFC) has been found to strengthen executive processes while simultaneously reducing spontaneous cognitive activities during creative improvisation, thereby steering creativity towards a more executive-driven process26. This suggests a compensatory mechanism underlying creativity. Compensation in brain activity has been investigated in the context of aging and brain injury28,29, where it refers to the recruitment of less dominant brain areas or networks to support a specific activity when the primary brain area becomes less active. Previous studies also emphasized the role of compensation in explaining the effect of noninvasive brain stimulation30,31. In terms of creativity, we posit that if associative processes are disrupted, they may be compensated for by executive processes. In such cases, the correlation between associative ability and creativity may decrease, as may the relationship between association-related brain activity and creativity. However, this does not necessarily imply a decline in creativity, because executive processes may compensate for this deficit. For instance, consider someone who cycles to work. If their bicycle breaks one day, they may walk. Although the correlation between cycling time and journey no longer applies, this does not mean that they are unable to reach their destination.
Given the potential of tDCS to modify the creative ideation process and the distinct roles of the bilateral IFG in creative ideation, it is pertinent to examine the thinking process involved in creative ideation separately, following different tDCS protocols targeting the bilateral IFG. To explore potential changes in thought processes during creative ideation, our study used CRA as a measure of creative thinking. This is not only because of the reasons mentioned above but also because it uniquely offers a single correct solution for each question. This specificity permits focused comparison of the creative thinking process, minimizing the introduction of extraneous confounding variables generated by differences in answers.
In summary, our study aimed to elucidate the effects of tDCS on the IFG from a neural cognitive process perspective. This endeavor could illuminate the mechanisms by which tDCS influences creativity and the cognitive processes involved in creative ideation. We evaluated the impact of tDCS targeting the bilateral IFG on both performance on the CRA task and the corresponding neural activity, as recorded by electroencephalography (EEG). The superior time resolution of EEG helps to capture neural activity more accurately when solving the CRA. Previous studies have explored changes in brain activity following tDCS during creative tasks using EEG25. However, we propose that simply comparing band powers or ERPs to investigate neural differences during tasks is insufficient. In addition to random error and noise, the variance in EEG signals can be influenced by factors such as task/stimulus, tDCS, and their interactions, making it challenging to interpret the observed differences in tDCS studies. The study of creativity adds another layer of complexity. Creative thinking engages multiple brain networks6,9,32, such as the executive control, default mode, and salience networks. The involvement of these diverse networks requires a broader perspective to examine the relationship between creativity and brain activity. Thus, conventional methods, such as ANOVAs or Pearson correlations, may not adequately capture such complex relationships. Therefore, to ascertain whether the observed neural activity changes were specifically related to the CRA and not merely alterations induced by tDCS, we constructed classification models to assess the correctness of CRA responses for each tDCS group based on the functional connectivity between different lobes. Specifically, we focused on alpha and beta band oscillations.
Alpha-band oscillations have been consistently linked to creativity in previous studies19,33,34,35. In the realm of creativity, convergent evidence suggests that alpha-band oscillations are indicative of the inhibition of salient but unhelpful information, facilitating the combination of remote concepts in a top-down manner33. Integrating these insights, we propose that during the CRA task, alpha-band oscillations may reflect the inhibition of salient associations triggered by individual cues.
Beta-band oscillations, in conjunction with the alpha band, have long been recognized as neural markers of executive function36. However, distinct from the alpha band, a recent study37 suggests that beta-band oscillation may be involved in the construction of semantic associations between an external stimulus and potential solutions in an executive manner during CRA. Additionally, a previous study38 noted the relevance of beta-band oscillations in semantic retrieval. Therefore, the interplay between beta- and alpha-band oscillations in CRA performance may reflect the dual processes of searching within semantic memory and inhibiting irrelevant associations.
Our hypotheses were as follows: 1). RSD in CRA tasks will exhibit a negative correlation with CRA performance, as previous studies suggested21,22. 2). tDCS targeting the bilateral IFG will have distinct effects on CRA performance. Given the inhibitory role of the right IFG15 and the generative role of the left IFG39, we hypothesized that right anodal stimulation of the IFG would enhance performance on tasks with a higher RSD by facilitating the retrieval of remote concepts. Conversely, left anodal stimulation was expected to improve performance in tasks with lower RSD by aiding in broader semantic retrieval. 3). EEG-based classification models for CRA correctness will demonstrate significant variations following different tDCS interventions. Specifically, we anticipated that the predictive model of CRA performance would exhibit left lateralization following left anodal stimulation of the IFG and right lateralization following right anodal stimulation.
Results
Differences in RIBS and SAM across groups
The χ2 test showed that the participants could not determine to which group they were allocated (χ2 = 4.50, p = 0.11). The one-way ANOVA showed no significant differences in RIBS scores among three groups after adjusting for gender (F2,76 = 0.38, p = 0.68, ηp2 = 0.01). For SAM valence, the main effect of time (F1,76 = 0.81, p = 0.37, ηp2 = .01) and group (F2,76 = 0.17, p = 0.84, ηp2 = 0.01), and the interaction between time and group were all nonsignificant (F2,76 = 1.33, p = 0.27, ηp2 = 0.03) after adjusting for gender. For SAM arousal, the main effect of time (F1,76 = 19.27, p < 0.001, ηp2 = 0.20) was significant, whereas the effect of group (F2,76 = 0.91, p = 0.41, ηp2 = 0.02) and the interaction between time and group (F2,76 = 1.82, p = 0.71) were nonsignificant after adjusting for gender. Post hoc tests showed that arousal after tDCS was significantly higher than that before tDCS (t76 = 4.39, p < 0.001).
The influence of tDCS on Stroop performance
The result of ANOVA showed that the tDCS applied in the present study showed neither a significant effect on accuracy on the Stroop task (F2,76 = 1.41, p = 0.25, ηp2 = 0.04) nor reaction times on that task (F2,76 = 0.17, p = 0.85, ηp2 < 0.01), after adjusting for gender. Table 1 shows the general performance on the Stroop task and CRA after different tDCS protocols.
The influence of tDCS on CRA performance
In the mixed-effects models, the main effects of group on CRA performance were nonsignificant (F2,75 = 1.15, p = 0.33 for accuracy; F2,69.5 = 1.83, p = 0.17 for reaction time), whereas the effect of RSD on both CRA accuracy and reaction time was significant (F1,1517 = 5.01, p = 0.02 for accuracy; F1,605.2 = 31.11, p < 0.001 for reaction time). Additionally, the quadratic regression outperformed the linear regression (Table 2), with a nonlinear relationship between CRA accuracy and RSD was identified (Table 3). However, the breakpoint regression indicated that the slope beyond the breakpoint was not significant (Table 4 and Fig. 1a).

A Relationship between RSD and ACC; b Relationship between RSD and RT. Note. In Fig. 1a, the dots indicate the average ACC in each trial for the three groups. In (B), the dots indicate the RT for each trial. Shadows indicate standard errors. ACC accuracy on compound remote association task, RT reaction time on compound remote association task, RSD relative semantic distance, L+R− anodal stimulation of F7 and cathodal stimulation of F8, L−R+ cathodal stimulation of F7 and anodal stimulation of F8; SHAM sham control for tDCS.
Furthermore, quadratic regression demonstrated superior performance over monotonic regression in examining the impact of tDCS and RSD on CRA reaction time (Table 2). Notably, the interaction of RSD with group and the square of RSD with group were both significant (Table 3). Simple effects analysis revealed that in the L+R− group, neither RSD (t859 = −0.99, p = 0.32) nor its square (t859 = 0.88, p = 0.38) significantly influenced CRA reaction time. Conversely, in the L−R+ group, RSD significantly affected reaction time (t852 = −2.23, p = 0.03), with the effect of the square of RSD approaching significance (t852 = 1.91, p = 0.06). In the Sham group, both RSD (t851 = −4.39, p < 0.001) and its square (t851 = 4.18, p < 0.001) significantly affected reaction time. Breakpoint regression for the L−R+ and Sham groups revealed a U-shaped relationship between RSD and CRA reaction time in the Sham group, whereas this relationship was monotonically decreasing in the L−R + group (Table 5 and Fig. 1b).
Performance of the classification models
After excluding unqualified data, a total of 323, 407, and 300 valid trials from the L+R−, L−R+, and Sham groups, respectively, were used for model construction. In the alpha frequency band, 569, 1091, and 873 iterations were required to generate 80 valid classification models for the L+R−, L−R+, and Sham groups, respectively. Similarly, in the beta band, 472, 664, and 491 iterations were conducted to obtain the same number of valid models for each group, respectively. That all the models were derived within 1600 iterations confirms the statistical robustness of the models constructed in this study. All models showed a specified classifying ability, as indicated by a one-sample t-test (Table 6).
According to the ANOVA results presented in Fig. 2a, both the group factor (F2,474 = 24.64, p < 0.001, ηp2 = 0.094) and the frequency band (F1,474 = 31.68, p < 0.001, ηp2 = 0.063) exerted significant effects on AUC (AUCs of each group were depicted in Fig. 2b–d). Additionally, the interaction between group and frequency band approached significance (F2,474 = 2.68, p = 0.07, ηp2 = 0.011). Upon further analysis of model performance differences within each group, it was observed that specifically in the L+R− group, models based on alpha band data significantly underperformed compared to those based on beta band data (t474 = −5.08, pbonferroni < 0.001). This finding suggests that the overall differences in model performance could be primarily attributed to variance within the L + R− group.
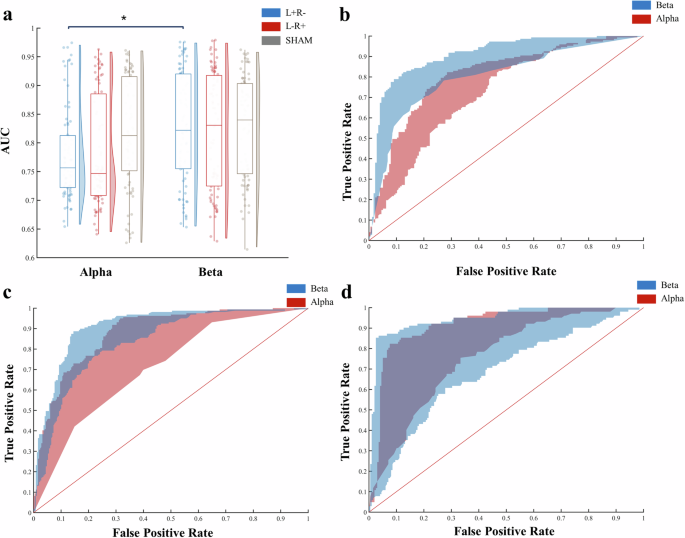
a ANOVA result; b AUC of L+R− group; c AUC of L−R+ group; d AUC of SHAM group. Note. In (b–d), the upper curve indicates the model whose performance was at the 75th percentile among all models, and the lower curve indicates the model whose performance was at the 25th percentile among all models. AUC area under the curve; L+R− anodal stimulation on F7 and cathodal stimulation on F8; L−R+ cathodal stimulation on F7 and anodal stimulation on F8; SHAM sham control for tDCS. *p < 0.05.
The predictors that passed the t-test with Bonferroni correction are shown in Fig. 3. For further details about the predictors, please see Supplementary Tables 1–6.
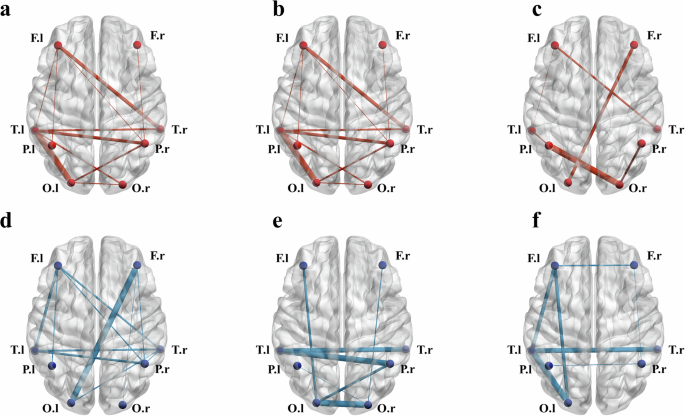
Bold lines indicate higher weights in the classification models. a alpha-band based model of L+R− group; b alpha-band based model of L−R+ group; c alpha-band based model of SHAM group; d beta-band based model of L+R− group; e beta-band based model of L−R+ group; f beta-band based model of SHAM group; Note. l left side; r right side; F frontal area; T temporal area; P parietal area; O occipital area; L+R− anodal stimulation on F7 and cathodal stimulation on F8; L−R+ cathodal stimulation on F7 and anodal stimulation on F8; SHAM sham control for tDCS.
Regarding the degree of frontal area activity, as Fig. 4a depicts, for the alpha band, there was a significant interaction between group and hemisphere (F2,237 = 44.78, p < 0.001, ηp2 = 0.274). Specifically, for the Sham group, the degree of right frontal activity was significantly higher than that of the left frontal area (t237 = 3.51, pbonferroni = 0.008), while L+R− exhibited a reversed pattern (t237 = 9.17, pbonferroni < 0.001). For the L−R+ group, bilateral frontal areas showed no significant difference in degree (t237 = 0.88, pbonferroni = 1.00). Meanwhile, the degree of left frontal activity in the L+R− group was significantly higher than that in the Sham group (t237 = 3.96, pbonferroni = 0.002), while the degree of right frontal activity in L+R− group was significantly lower than that in the L−R+ and Sham group (t237 = 9.48, pbonferroni < 0.001 and t237 = 9.97, pbonferroni < 0.001, respectively).
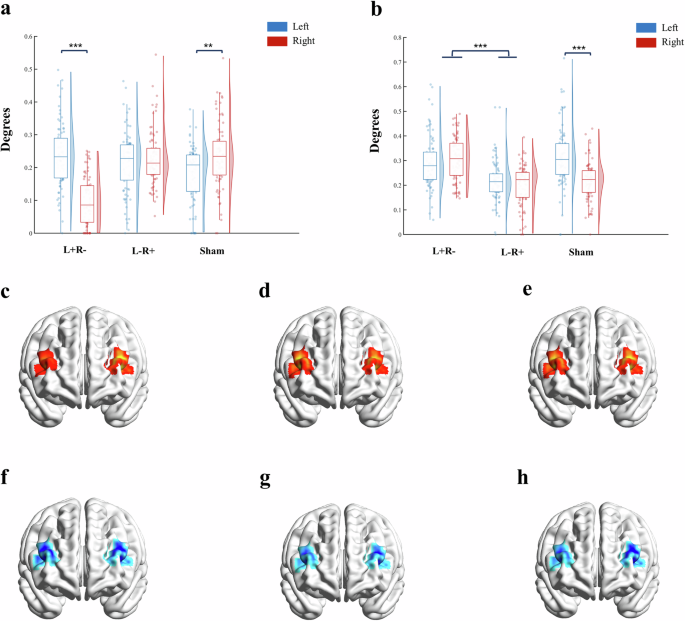
a ANOVA results for alpha band; b ANOVA results for at beta band; c–e simulated distribution of activity at alpha band respectively for L+R−, L−R+, and SHAM group. The color distribution indicates the degrees in 80 classification models; the warmer the color, the greater the degrees. f–h simulated distribution of activity at beta band respectively for L+R−, L−R+, and SHAM group. The color distribution indicates the degrees in 80 classification models; the colder the color, the greater the degrees. Note. L+R− anodal stimulation on F7 and cathodal stimulation on F8; L−R+ cathodal stimulation on F7 and anodal stimulation on F8; SHAM Sham control for tDCS. **p < 0.01. ***p < 0.001.
For the beta band (Fig. 4b), an interaction between group and hemisphere was also confirmed (F2,237 = 14.40, p < 0.001, ηp2 = 0.109). Post hoc tests showed that for the Sham group, the degree of left frontal activity was significantly higher than that of the right frontal area (t237 = 6.24, pbonferroni < 0.001). For the L+R− and L−R+ groups, no effect of hemisphere was present (t237 = 1.11, pbonferroni = 1.00 and t237 = 0.95, pbonferroni = 1.00), but the main effect of the group suggested that the degree of bilateral frontal activity in the L+R− group was significantly higher than that in the L−R+ group (t237 = 8.69, pbonferroni < 0.001). Additionally, the degree of left frontal activity in the L−R+ group was significantly lower than that in the Sham group (t237 = 5.84, pbonferroni < 0.001). Figure 4c–h depicts the distribution of degrees across all three groups and two bands.
Discussion
In this study, we investigated the effects of tDCS on the bilateral IFG and its impact on creative processing. Our findings revealed that while there was no significant difference in the overall performance on the CRA task following different tDCS interventions, there were notable changes in creative cognition. These changes were evidenced by the altered relationship between CRA performance and the RSD of each trial. Additionally, modifications to the classification models based on EEG signals further indicated shifts in the cognitive processes underlying creativity. Additionally, the changes in creative cognition observed in the present study cannot be solely attributed to alterations in executive function, as no significant differences were found in Stroop task performance under different tDCS conditions.
Interestingly, our study revealed that the RSD of CRA trials had a positive monotonic relationship with the accuracy of CRA responses. However, the relationship between RSD and reaction time varied across the different tDCS groups. Specifically, in the Sham group, there was a U-shaped relationship between RSD and the reaction time on the CRA. In contrast, the L−R+ group exhibited a negative monotonic relationship between RSD and CRA reaction time. Meanwhile, no clear linear or quadratic relationship was found between RSD and CRA reaction time in the L+R− group. These findings diverge from those of earlier studies that explored the connection between CRA performance and its semantic features21,22. This discrepancy could be attributed to two factors. First, unlike prior studies, our analysis incorporated the semantic distance between cues, a variable not previously considered. Second, the methodology for quantifying the semantic distance between cues and answers differed significantly: whereas earlier studies relied on association tasks conducted by participants to measure semantic distance; the current investigation employed Word2Vec for this purpose. This methodological innovation permitted a more nuanced and computationally sophisticated understanding of semantic relationships, potentially explaining the observed differences in outcomes.
Our discussion begins with the results from the Sham group, which serve as a baseline for understanding natural cognitive processes during CRA. In studies focusing on divergent thinking, a key component of creative thinking, convergent evidence suggests a robust positive relationship between the semantic distance between cues and answers and the creativity of the answers40. Typically, creative answers require greater cognitive effort and time. Therefore, it is intuitive to assume that solving CRA trials with less semantic cohesion requires greater effort. However, our data reveal a complex pattern.
In the Sham group, the positive monotonic relationship between the accuracy of CRA and RSD indicates that, unlike in divergent thinking, reaching semantically remote concepts in CRA was easier than reaching closer concepts. Previous research has suggested that people generally solve CRA tasks in a bottom-up associative manner41, building associations based on the last candidate42. This approach is akin to chain-free association, a process in which the semantic distance between the cue and the associated concept continuously increases43.
Consequently, in CRA tasks, the nature of chain-free associations may decrease the likelihood of immediately arriving at a semantically close answer. The reaction time data for the Sham group imply that individuals may initiate their search using relatively remote concepts. If the correct answer was far from the initial cue, the participant took relatively more time to arrive at the correct answer. Conversely, if the answer was closer to the cues, the process could be more cognitively demanding than merely expanding the current associative chain because it involved a form of cognitive subtraction that is generally more challenging than addition in the context of creative ideation44. Overall, our findings suggest that in CRA tasks, people tend to begin associative searches with moderately remote concepts.
Although no significant effects of tDCS were observed on the accuracy of CRA responses, our study revealed an intriguing moderating effect. Specifically, we found that the U-shaped relationship between RSD and reaction time, which was initially present in the Sham group, disappeared following L+R stimulation of the bilateral IFG. Moreover, this relationship became monotonically decreasing after the L−R+ stimulation. These changes suggest that tDCS stimulation of the bilateral IFG may modify the natural cognitive processes involved in solving CRA tasks. Notably, these alterations were neutral, as the overall CRA performance was comparable across all groups.
To delve deeper into the mechanisms underlying this cognitive alteration, we constructed classification models based on EEG signals to examine neural activity during CRA following different tDCS interventions. These models revealed that functional connectivity (FC) in both the alpha and beta bands during the CRA task effectively differentiated between correct and incorrect trials.
Consistent with the behavioral results, the classification models based on alpha band data in the L+R− group demonstrated poorer performance compared to those based on beta band data, a pattern not observed in the L−R+ and Sham groups. This suggests that solving CRA tasks after L+R stimulation relies less on alpha-band oscillations. Considering the inhibitory role of alpha-band oscillation33, this finding may help explain the observed behavioral patterns. Reduced engagement of alpha-band oscillation in the L+R− group could lead to less inhibition of thoughts closely related to the cues, increasing the likelihood of identifying answers with nearer semantic distances. Consequently, it took longer for individuals in the L+R− group to find answers with more remote semantic distances because of the greater number of potential candidates. In essence, this suggests a shift towards a more traversal-based approach in solving CRA tasks after L+R stimulation. These findings also conceptually resonate with those of a previous study45, which suggested that beta-band oscillation during rest is associated with a tendency to solve CRA tasks using an analytical strategy. This further underscores the nuanced interplay between different neural oscillations and cognitive strategies in creative problem-solving.
Topological analysis of the prediction models revealed a notable decrease in right lateralization in the frontal area in the alpha band for the L+R− group compared to the other two groups. This suggests that the increased reliance on an analytical strategy during CRA tasks following L+R stimulation may be attributable to a decreased activation of the right IFG in the alpha band. The bilateral IFG, recognized as a core hub of the executive-control network, exhibits diverse functions46. Its activation has consistently been reported in tasks involving verbal processing47, executive functions48, and notably, creativity11,13. Specifically, a previous study15 found that anodal stimulation of the right IFG enhances creativity by improving inhibitory control, suggesting a role for the right IFG in suppressing accessible but irrelevant concepts during creative ideation. Therefore, the observed reduced engagement of the right prefrontal area in our study supports the hypothesis that, after L+R stimulation, individuals are more likely to employ an analytical strategy to solve CRA tasks.
Similarly, we observed decreased engagement of the left prefrontal area in the beta band following L−R+ stimulation. The left IFG is hypothesized to be involved in semantic processing49 and has been suggested to play a significant role in free association39. Reduced activity in the left prefrontal area after L−R+ stimulation suggests that individuals might experience a “blocking” of concepts, leading them to generate ideas with more remote associations with CRA cues. This cognitive shift could result in improved performance in CRA trials with higher RSD compared with those with lower RSD.
Despite its contributions, this study has certain limitations that warrant further consideration. First, although we utilized EEG to capture neural activity prior to the CRA responses, it is important to note that EEG has a relatively low spatial resolution. Future studies could replicate our findings using neuroimaging technologies with higher spatial resolution, such as magnetoencephalography (MEG), functional magnetic resonance imaging (fMRI), and functional near-infrared spectroscopy (fNIRS).
Second, the classification models employed in this study were based on decision trees, which are nonlinear classifiers. Consequently, these models do not directly provide a linear relationship between neural activity and behavioral performance. That is, our analysis can infer differences in neural engagement, but cannot pinpoint the activation or deactivation of specific brain areas.
Third, although the relationship between semantic space and CRA performance demonstrated robust associations, the number of trials included in our study was relatively limited. The limited number of trials also made it difficult to separate high- and low-RSD trials into two groups for direct comparison. Future research using larger datasets is recommended to confirm these findings.
Finally, a previous study has suggested that the effects of tDCS are sensitive to individual differences50. In this study, we investigated the effects of tDCS at the group level. To minimize the influence of individual variability, we used a mixed-effects model, treating individuals as random effects and pooling all trials in the analysis. Our results demonstrated the effects of tDCS on the bilateral IFG for convergent thinking at the group level but did not provide insights into the role of individual differences or their interactions with tDCS effects. Future studies should consider individual variability when exploring the effects of tDCS on creativity.
In conclusion, this study advances our understanding of the neural underpinnings of convergent thinking by integrating tDCS and EEG data. The altered relationship between RSD and CRA performance and the altered prediction model of CRA performance suggest that after experiencing L+R− stimulation of the bilateral IFG, people solved creative tasks by relying more on analytical strategies. Conversely, after experiencing L−R+ stimulation of the bilateral IFG, people solved creative tasks by relying more on remote associations. These findings offer valuable insights for future researchers interested in exploring and influencing neural activity using noninvasive techniques to probe creative cognition.
Methods
Participants
Eighty-one undergraduate students participated in this study (27 males; mean age = 21.53 ± 1.78 years). All participants were right-handed with normal or corrected-to-normal vision, and none had a history of psychiatric illness. Informed consent was obtained from all participants to ensure that they fully understood the experimental procedures and objectives. All collected behavioral data were included in subsequent statistical analyses. However, data from nine participants were excluded from the construction of the prediction model and further analyses because of unqualified EEG signals, as determined through manual inspection using the open-access MATLAB toolbox EEGLAB51. This study conformed to the principles of the Declaration of Helsinki and was approved by the Ethics Committee of East China Normal University (HR2-0032-2022).
General procedure and tasks
Upon arrival, participants provided written informed consent and were randomly assigned to one of three groups: anodal stimulation on the left IFG and cathodal stimulation on the right IFG (L+R−), reverse stimulation protocol (L−R + ), or Sham stimulation. Before stimulation, participants completed the Runco Ideational Behavior Scale (RIBS)52 and the Self-Assessment Manikin Scale (SAM)53. Then, after the application of electrode gel and an electrode cap, they received 15 min of tDCS or sham stimulation. A second application of electrode gel was specifically targeted at the electrode where tDCS was administered. This approach allowed us to implement tDCS efficiently and collect EEG data within a short timeframe. The participants then sequentially performed the Stroop task and CRA after a short break. Following tDCS and the tasks, participants completed the SAM again and reported to the experimenter whether they felt any stimulation on their scalp. The specific configurations of tDCS and tasks applied in this study are described in detail below. Figure 5 illustrates the general procedure used in this study. The software used for electric field modeling in this study (see Fig. 5) was SimNIBS54. Most parameters were set to their default values except for current density, electrode position, and electrode size (for details, see “Transcranial direct current stimulation (tDCS) configuration”).
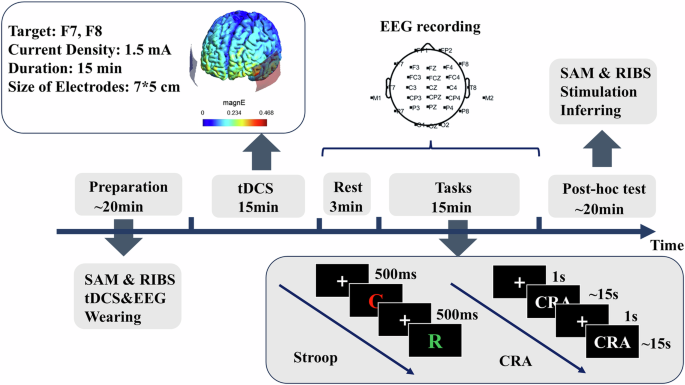
Note. SAM Self-Assessment Manikin scale; RIBS Runco Ideational Behavior Scale, CRA compound remote association task.
The Stroop Task55 is widely used for efficiently assessing executive control abilities. Participants were asked to perform the Stroop task to investigate whether tDCS altered their executive control abilities. Generally, the Stroop task requires participants to determine whether the color of a word matches its semantic meaning. Participants were instructed to press the “J” key if there was a match, and the “F” key if there was no match. For instance, if the word “yellow” is displayed in red or blue, participants should press “F.” Conversely, if “yellow” is shown in yellow, they should press “J.” Performance on the Stroop task was quantified based on the reaction time and proportion correct. In this study, the Stroop task consisted of 72 trials, with 32 trials presenting words for which the color matched the meaning (congruent) and 40 trials for which it did not (incongruent). The inteR−stimulus interval was set at 500 ms. We measured Stroop task performance based on the reaction time of the correctly answered trials.
The Compound Remote Associates Task18 is a widely utilized task that focuses on one aspect of creativity: convergent thinking ability. Unlike open-ended divergent thinking tasks, the CRA is closed-ended but still demands creative cognition. This characteristic allows the investigation of different creative thinking processes while avoiding biases due to answer variability. This study employed a well-established Chinese version of the CRA56.
In the CRA, participants were presented with three Chinese characters and were required to identify another character that could form a meaningful compound with each presented character. For example, the characters (also can be deemed words) “词” (word), “运” (transport), and “带” (bring) can be combined with “动” (move) to create “动词” (verb), “运动” (sports), and “带动” (drive). The participants in our study completed 20 CRA trials. Each trial lasted 15 s after a 1 s fixation period. The participants indicated their readiness to answer by pressing a key, after which they entered their responses into an answer box. CRA performance was quantified based on the proportion correct and reaction time for correct answers.
To quantify the relative semantic distance (RSD) for each CRA question, we first utilized a Python-based toolbox, Gensim57, to calculate the semantic distance between the three cue words and the correct answer using the Word2Vec algorithm58. The corpus employed in our study was obtained from Tencent Corp.59, comprising approximately eight billion Chinese words, each represented by a 200-dimensional vector. For each CRA trial, six semantic distances were computed, three of which were the semantic distances between the cues (SDw) and three of which were the semantic distances between each cue and answer (SDb). These distances were used to calculate the RSD, as Eq. (1) depicted:
note. where RSD refers to the relative semantic distance, SDb refers to the semantic distance between the answer and each CRA cue, and SDw refers to the semantic distance between the CRA cues.
Transcranial direct current stimulation (tDCS) configuration
In this study, a portable, battery-powered 1 × 1 low-intensity transcranial DC stimulator (Soterix Medical, New Jersey) was used to deliver a constant current of 1.5 mA for 15 min, including a 30 s ramp-up time. Stimulation was administered using a pair of saline-soaked sponge electrodes, each measuring 7 × 5 cm². This duration and current density of tDCS have been shown to be effective at influencing creative thinking25. The locations of the left and right IFG were determined as F7 and F8, respectively, according to the 10–20 EEG system.
Electroencephalographic data collection and preprocessing
EEG data were recorded using a Neuroscan EEG system (Compumedics, Australia) with electrodes positioned at FP1, F3, F7, FC3, C3, CP3, P3, P7, T7, and O1 on the left side and their corresponding locations on the right side. Additional electrodes were placed at Fz, FCz, Cz, CPz, and Oz following the 10–20 system. The sampling rate was set at 1000 Hz, and no downsampling was applied in subsequent analyses.
Initially, the EEG data were bandpass-filtered between 1–50 Hz. All data were then re-referenced to the average EEG signals collected from the aforementioned electrodes. Electrodes exhibiting excessively noisy signals, as manually assessed for each participant, were interpolated from neighboring electrodes using spherical spline interpolation. Subsequently, independent component analysis (ICA) was applied to correct for ocular and muscle artifacts.
For each trial, the last 2000 ms of the EEG signals prior to the participant’s response were extracted. In cases for which participants failed to provide an answer within 15 s, signals from 13 to 15 s were used. The data for each trial were then manually inspected and any unqualified trials were discarded from further analysis. It is important to note that participants with fewer than 10 qualified trials were excluded from further analysis, which is consistent with the approach taken in a previous study60.
To account for potential superficial correlations in EEG signals due to volume conduction effects, we averaged the signals from the electrodes within the same lobe. Specifically, signals from FP1, F3, and F7 were averaged to represent the left frontal lobe, CP3 and P3 the left parietal lobe, T7 and P7 the left temporal lobe, and O1 the left occipital lobe, as there were no other electrodes in this study located in the left occipital lobe. A similar averaging process was applied to electrodes in the right hemisphere.
Eight signals corresponding to the bilateral frontal, parietal, temporal, and occipital lobes were obtained. From these, 28 functional connectivity (FC) values ((8 × 8 − 8)/2) were calculated using the phase-locking value (PLV) for each trial. PLVs were computed during each trial and during the fixation period preceding each trial. To determine task-related PLV changes, we compared the Fisher Z-transformed task PLVs with the reference PLVs for each trial.
Data analysis
To investigate whether participants could identify the group to which they were allocated, χ2 tests were performed. A one-way ANOVA of the RIBS scores was then performed to compare the differences in daily life creativity among the three groups. For the SAM, two repeated-measures ANOVAs were performed across time and groups for valence and arousal. For the Stroop task, we conducted two one-way ANOVAs to investigate the effect of tDCS on the accuracy and reaction time of correct trials.
To explore the impact of tDCS on the bilateral IFG while accounting for triaL−level differences in the CRA task, we constructed four mixed-effect models: two linear and two quadratic models. These models assessed the accuracy of the CRA responses and reaction times. In these models, tDCS group, RSD, gender, Stroop task performance (reaction time for correct trials), and the interaction between tDCS group and RSD were included as fixed effects. We are not interested in the possible effect of practice and fatigue, and so individual differences in the present study, therefore, the order of CRA trials and participant identities were treated as random effects. In the quadratic models, if the quadratic terms (i.e., the square of RSD or the interaction between the square of RSD and the tDCS group) demonstrated significant effects, a breakpoint regression analysis was conducted to confirm either a U-shaped or an inverted U-shaped relationship between RSD and CRA performance. The breakpoint in these analyses was determined using the Robin Hood procedure, as described in a previous study61. Additionally, if the interaction term between the square of the RSD and the tDCS group was significant, we performed breakpoint regression separately for groups in which the simple effect of RSD² was significant. The rationale for this separate model is that a significant interaction term suggests that the breakpoint for each group may differ, making it inappropriate to summarize all data using a single breakpoint regression model.
The methodology used to construct the models is illustrated in Fig. 6. Broadly, we aggregated trials within each group and employed nested ensemble classification to predict the correctness of the CRA responses. Owing to the inherent randomness of ensemble classification, the same algorithm can produce slightly different optimal models for each iteration. To address this, we constructed 80 models for each group for comparison. The number of models was determined using G*Power. For a 3 (group) × 2 (bands) two-way ANOVA, with an effect size set at 0.25 (medium size) and both alpha and beta error probabilities set at 0.01, a total of 444 samples were required. Therefore, 480 models (2 × 3 × 80) were constructed to satisfy this criterion. In each prediction iteration, random under-sampling was used to balance the number of correct and incorrect trials. Specifically, 20 correct and 20 incorrect trials were randomly selected as test data, whereas the remaining data were undersampled before being used for model training.
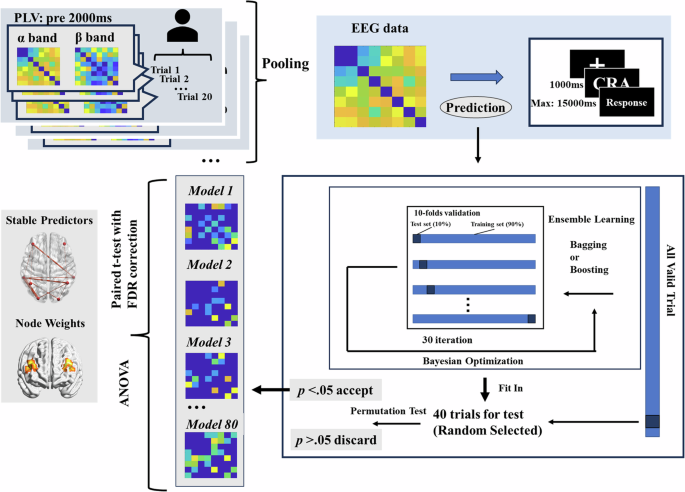
Twenty correct and twenty incorrect trials were randomly chosen as test data. Bayesian optimization and 10-fold cross-validation were used to identify the optimal model in each iteration. Eighty models were finally obtained for each group.
Bayesian optimization and 10-fold cross-validation were used to identify the optimal model for each iteration. A model was considered for further analysis only if it significantly predicted the correctness of the CRA trials in both the training and test data, as determined by a permutation test performed 1000 times for generalizability. For each group, a maximum of 1600 iterations were conducted to ensure the statistical robustness of the classification models (with a significance threshold set at 80/1600 = 0.05). This modeling process was performed separately for both the alpha (8–12 Hz) and beta (13–30 Hz) frequency bands.
After completing the modeling process, we first fit the model to all of the datasets to test the specifications of the model. For example, 80 models based on alpha band oscillation from L+R− group were fitted in all six data sets (3 groups and 2 bands), resulting 80 × 6 classifications. One-sample t-tests were conducted to investigate whether the area under the ROC curve (AUC) was significantly higher than the estimated level. We then conducted a two-way ANOVA to compare the AUCs across the different frequency bands and groups. This analysis helped to assess the predictive accuracy of the model under various conditions. To identify stable predictors within each group, we performed a series of paired t-tests. These tests compared the weight of each functional connectivity (FC) against the median weight of the FCs in each model, with Bonferroni correction applied to account for multiple comparisons. FCs with weights significantly higher than the median weight of the model were considered stable predictors.
Finally, we tested the lateralization of the bilateral frontal lobes in the prediction models by comparing the weighted degree of each frontal lobe. The weighted degrees were obtained by summing the weights of the FCs connected to the bilateral frontal lobes. We then compared these weighted degrees across groups and hemispheres. This comparison was performed using two separate mixed ANOVAs: one for the alpha band (8–12 Hz), and the other for the beta band (13–30 Hz). The between-subjects (model) factor was the different groups, and the within-subjects (model) factor was the hemisphere.
Responses