Transcriptional reprogramming triggered by neonatal UV radiation or Lkb1 loss prevents BRAFV600E-induced growth arrest in melanocytes
Introduction
Cutaneous malignant melanoma (CMM) is a heterogeneous fatal disease that is well known to be associated with high levels of sun exposure (ultraviolet (UV) radiation; UVR). Melanoma cell heterogeneity has been categorized as four differentiation stages (melanocytic, transitory, neural crest cell-like, and undifferentiated) according to the corresponding gene expression profiles [1]. This heterogeneity is determined by both germline and somatic genetic characteristics and also by environmental factors since each individual with CMM has a different degree of sun exposure.
Melanocytic nevi are considered benign precursor lesions initiated mainly by activating mutations in RAS or BRAF family members. This activation leads to transient cell proliferation that ultimately promotes growth arrest [2]. Approximately 80% of nevi harbor the BRAFV600E mutation and are composed largely of arrested melanocytes [3]. Although the predominant explanatory theory for this growth arrest has historically been oncogene (BRAFV600E)-induced senescence (OIS) [4], recent studies have suggested a more complex situation that also considers the presence of cells with reversible and conditional BRAFV600E-induced arrest [5]. Despite the described linear stepwise sequence of melanocytic malignant progression, only 25–33% of melanomas arise from nevi [6,7,8]; however, 50% of CMMs harbor the BRAFV600E mutation [9], supporting the idea that BRAFV600–induced arrest and/or senescence could be bypassed or prevented under the appropriate conditions [5]. Several overlapping specific molecules and mechanisms have been proposed to mediate the establishment and maintenance of growth arrest, including the regulation of microRNAs [5], the activity of cell cycle inhibitors (p16INK4a, p14ARF, etc.), epigenetic changes (5-hmC, DNMT3B, etc.), metabolic reprogramming (alterations in PDK1 expression, autophagy, OXPHOS, etc.), microenvironmental control (the senescence-associated secretory phenotype; SASP), reduced immune surveillance, and downregulation of oncogenic pathways (PI3K/AKT and mTORC1/2), among others [2]. Correspondingly, studies in several mouse models have shown that constitutive activation of the PI3K/AKT pathway releases melanocytes from BrafV600E-induced arrest [10, 11], a finding compatible with those in human lesions [11], where activation of both mTORC1 and mTORC2 seems to be required for BrafV600E-induced melanomagenesis [12].
UVR exposure (sunburn) is a major risk factor for melanoma development [13,14,15]. Ultraviolet B (UVB) radiation is the cause of sunburns and is more effective than ultraviolet A at initiating melanoma [16, 17]. Numerous studies have highlighted the importance of sunburns in early life as a predictor of melanoma risk [18,19,20]. In addition to promoting melanin synthesis and melanocyte proliferation [21], UVB radiation induces cutaneous inflammatory responses that promote melanomagenesis [22]. Furthermore, previous works have shown that UVR (including UVB) cooperates with the BrafV600E mutation in different contexts during melanoma development (for review [23]). Studies in a transgenic BrafV600E-expressing mouse model showed that loss of ARF sensitizes mice to UV-induced melanoma via suppression of XPC [24]. Later studies in an inducible melanocyte-directed BrafV600E knock-in model demonstrated that exposure of BrafV600E nevi to chronic intermittent UVR induced TP53/Trp53 mutations, accelerating BrafV600E-driven melanomagenesis [25]. Furthermore, in a BrafV600E;Pten −/− mouse model UVR can initiate melanomagenesis, which can arise from melanocyte stem cells [26].
Individual oncogenic mutations (BRAFV600E) or DNA damage (UV-induced) can promote growth arrest and/or senescence through multiple and sometimes overlapping mechanisms, which likely require simultaneous inactivation for melanocyte transformation and progression. Here, we used UVB-dependent and independent mouse models, transcriptional and genomic analyses of mouse and human samples, analyses of clinical data, single-cell profiling analyses, and studies in preclinical models to identify relevant molecules and mechanisms involved in UVB-mediated prevention of BRAFV600E-induced growth arrest. Our in vivo studies revealed molecules associated with poor survival in human studies, some of which exhibited activity as potential targets for melanoma treatment. Additionally, single-cell profiling of BRAFV600E–transduced human melanocytes identified a cell population whose expression profile was associated with early resistance to multiple targeted drugs. Our studies provide evidence for plausible mechanisms underlying melanocyte transformation and the evasion of growth arrest in neoplastic lesions, also identifying novel therapeutic targets.
Results
A single dose of UVR prevents BRAFV600E-induced cell arrest and/or senescence in neonatal mice
To investigate the cooperative effect of the acquisition of BRAFV600E mutations early in life and neonatal UVB irradiation (280–330 nm), we used the conditional Cre-activated Braf allele (Tyr::CreERT2;BrafCA/+) mouse model (B mouse model) [10] (Fig. 1A). The expression of BrafV600E on postnatal day two recapitulated the previously described mouse phenotype [10]. Topical administration of 4OHTx to the dorsal skin of mice led to profound pigmentation in the animals due to increased melanocyte proliferation and melanin production (nevi), which occasionally also affected meningeal melanocytes. In some cases, the lymph nodes appeared to be pigmented due to the presence of melanophages, and some animals developed hyperkeratosis (Fig. S1A–D). As expected, heterozygous activation of BrafV600E (BrafCA/+) did not lead to melanoma development due to BRAFV600E-induced growth arrest and/or OIS, and only one of the 14 animals developed a dermal melanoma, which was detected 423 days after homozygous activation of BrafV600E (BrafCA/CA) (Fig. 1B, C).
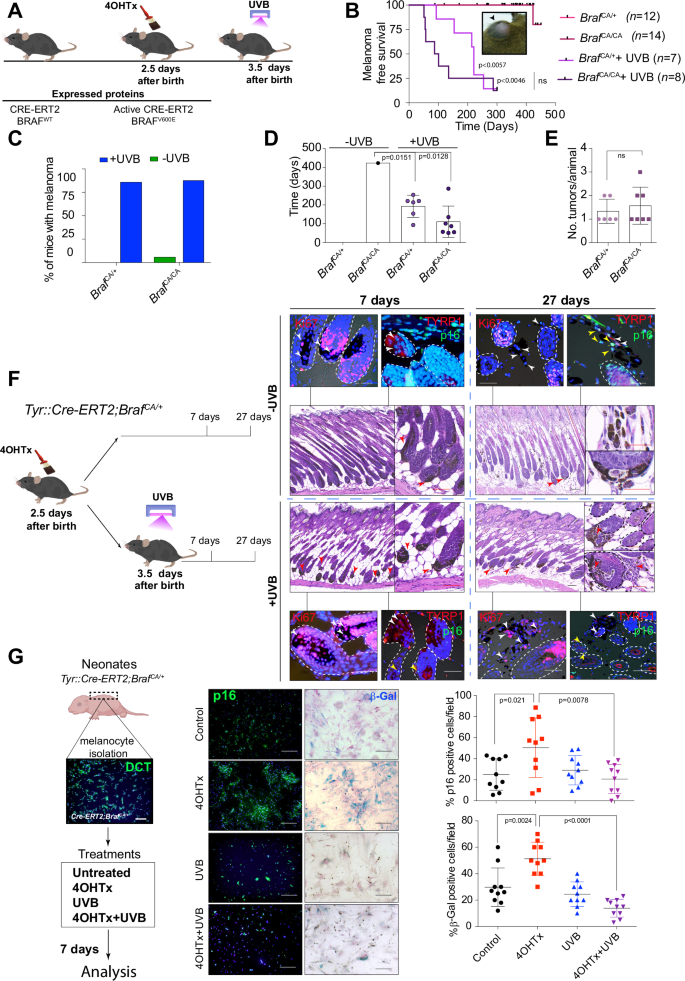
A Time schedule of BrafCA activation and UVB irradiation. B Kaplan–Meier curve of melanoma-free survival in mice treated perinatally with 4OHTx or 4OHTx+UVB. Inset, a representative picture of a melanoma in an adult BrafCA mouse. C Graph showing the percentage of mice that developed melanoma according to treatment and gene dose. D Graph showing the mean time to melanoma development according to treatment and genotype. E Analysis of tumor multiplicity in irradiated Braf mutant mice according to gene dose. F IHC analysis of flank skin harvested from Tyr::CreERT2; BrafCA/+ (B) mice at various time points after the indicated treatments. The arrowheads indicate melanocytes (Red: in H&E staining, white: Ki67 or TYRP1 positive cells, yellow: p16 positive cells); dashed lines delimitate the hair follicles; scale bars: black, 20 µm, white or red, 10 µm. G IHC and β-Gal staining in melanocytes isolated from B mice upon the indicated treatments. Right, semiquantitative analysis of IHC staining and β-Gal activity (n = 3 experiments; 10 fields per condition).
However, administration of a single neonatal erythemogenic dose of UVB radiation one day after BRAFV600E activation promoted melanoma development in 85.7% of the BrafCA/+ and 87.5% of the BrafCA/CA mice, with onset times of 193 ± 24 and 110 ± 31 days, respectively, and a tumor multiplicity ranging from 1 to 3 tumors per animal (Fig. 1B–E). The melanomas in these mice were mainly amelanotic, localized in the dermis or subcutaneous region without a junctional component, occasionally ulcerated, and occasionally displayed different morphologies. Some tumors were pleomorphic, with the tumor cell morphology ranging from spindle-shaped to round and the nuclear morphology ranging from small, hyperchromatic, and pyknotic nuclei to large vesicular nuclei with punctate nucleoli. Overall, we distinguished three major tumor morphologies: melanomas with myxoid features characterized by atypical spindle cells with small nuclei and glycolipids, glycoproteins, and focal mucin deposition in the dermis; melanomas with spindle-shaped to round, plump cells; and melanomas with nerve sheath differentiation (neural differentiation). All morphological types exhibited positive staining for S100B (Fig. S1E). Some of the tumors were heterogeneous, showing predominant areas of myxoid-like morphology. Thus, these data suggested that neonatal UVB irradiation prevented BRAFV600E-induced growth arrest and/or OIS, allowing full melanoma development.
It is known that BRAFV600E expression in human melanocytes promotes an initial phase of proliferation that is subsequently restrained from malignant progression by engagement of a cell cycle arrest program with features of senescence [4]. Similarly, in mice, highly pigmented lesions (nevi) were detected by 21–28 days after activation of BrafV600E [10]. Analysis of mouse skin on days 7 and 27 post BRAFV600E activation, with or without neonatal administration of UVB radiation, revealed that 27 days post treatment, irradiated melanocytes were proliferating outside the hair follicles, exhibited positive staining for Ki67 and negative staining for p16Ink4a. In contrast, at the same time point, nonirradiated melanocytes exhibited indications of BRAFV600E-induced growth arrest and/or senescence (Fig. 1F).
To confirm the cooperative effect of simultaneous neonatal UVB irradiation and BRAFV600E activation, we isolated melanocytes from the skin of neonatal B model mice. Subsequent in vitro experiments revealed that UVB radiation significantly prevented BRAFV600E-induced growth arrest and/or senescence, as indicated by the populations of β-Gal- and p16Ink4a-positive cells (Fig. 1G). Thus, these data support the hypothesis that cooperative effect of a simultaneous single neonatal dose of UVB irradiation and oncogenic BRAFV600E signaling promotes melanoma development.
Gene expression profiling confirmed the role of UVB radiation in preventing oncogenic BRAFV600E-induced growth arrest
While UVR is known to cause DNA mutations that may help override OIS [25], the specific role of neonatal UVB radiation in transcriptional reprogramming that prevents OIS remains less well understood. To gain insight into the molecular events underlying the observed phenotype, we isolated melanocytes from neonatal B model mice and analyzed the gene expression profiles of cells treated with 4OHTx alone or in combination with UVB exposure, 27 days after 4OHTx administration. As previously described [4], BrafV600E expression (BrafCA/+) triggered cell proliferation and pigmentation, followed by an extended lag time for cell division, consistent with cell cycle arrest and the OIS phenotype. UVB-irradiated B melanocytes underwent an initial selection process through cell death, resulting in the emergence of visible proliferative clones (Fig. S2A). Metascape analysis of the unsupervised hierarchical clustering of the 200 most strongly regulated genes following BrafV600E expression confirmed the involvement of biological processes related to growth arrest and OIS (Fig. S2B and Table S1). Analysis differentially regulated genes (log2FC > 0.265 3–4 biological replicates) in BrafV600E (B) and B + UVB samples identified genes and biological processes specifically induced by either BrafV600E or in combination with UVB (Fig. 2A). Genes regulated by BrafV600E activation were enriched in processes related to pigmentation and the SASP, including cytokine-mediated signaling, myeloid leukocyte differentiation, and inorganic ion homeostasis. In contrast, comparison of B + UVB and B samples revealed regulation of melanin production and processes linked to DNA synthesis, ROS management, cell division, and proliferation (Figs. 2B and S2C, and Table S2). Given that simultaneous UVB irradiation and BrafV600E activation appeared to prevent BrafV600E-induced growth arrest and/or senescence (OIS), we investigated the specific senescence-related genes involved in this process. To this end, we generated a senescence gene signature consisting of 579 genes (both upregulated and downregulated) from prior studies across various senescence models, including melanocytes [27,28,29,30,31,32,33] (Table S3). We then performed a meta-analysis to examine the regulation of these genes in BrafV600E-expressing cells compared to normal melanocytes (WT) (B vs. WT) and in UVB-irradiated BrafV600E melanocytes compared to non-irradiated BrafV600E cells (B + UVB vs. B). The expression analysis of B vs. WT melanocytes identified differential regulation of 184 genes from the senescence signature. Ninety-five of those genes were regulated exclusively in non-irradiated BrafV600E-expressing cells. Among them, 68 were regulated in the same direction as reported in previous senescence studies and were associated with biological processes such as cell cycle, cell division, and cellular senescence biological processes (pro-senescence signature) (Figs. 2C and S2D and Tables S3–S5). Similarly, the B + UVB vs. B analysis revealed differential regulation of 205 genes from the senescence signature. Of these,116 genes were regulated exclusively in UVB-irradiated cells (B + UVB), with 81 of these 116 genes (involved in cell division, DNA replication, response to ionizing radiation, and cell senescence) regulated in the opposite direction to the prosenescence signature (Fig. 2C and S2D). Eighty-nine genes from the senescence signature were regulated in both comparison groups (B vs. WT and B + UVB vs. B). However, 55 of these 89 genes, mostly related to cell cycle and cellular senescence, showed opposite regulation in the B + UVB vs. B comparison group compared to the B vs. WT comparison group and the senescence signature (Fig. 2C and S2D). Thus, gene expression profiling confirms the cooperative effect of neonatal BrafV600E activation and UVB irradiation on preventing BRAFV600E-induced growth arrest and/or OIS, which is reflected in the opposing regulation of critical genes involved in senescence.
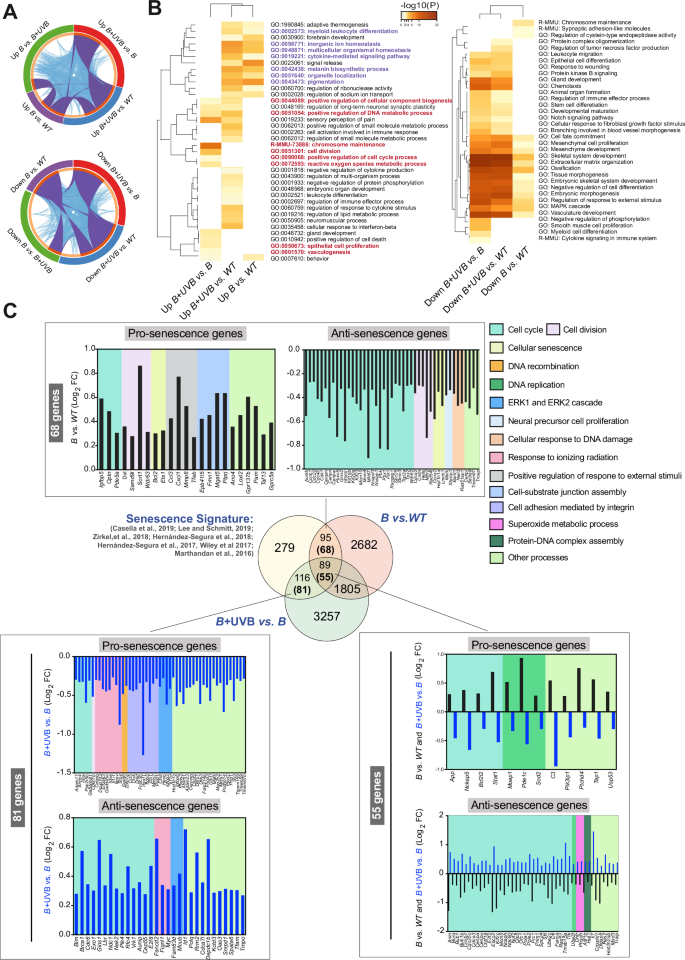
A Circus plot showing the overlap between gene lists obtained via microarray analysis at the gene level and the shared term level. The purple curves link identical genes, and the blue curves link genes that belong to the same enriched ontological term. The inner circle represents the gene list, where hits are arranged along the arc. Genes with hits in multiple lists are shown in dark orange, and genes unique to a list are shown in light orange. B Heatmap of enriched terms across the input gene lists colored according to the p value obtained from Metascape. The terms shown in purple are the BRAFV600E-dependent upregulated processes, and the terms shown in red are those upregulated by UVB in BRAFV600E tumors. C Venn diagram illustrating the relationship between regulated genes in the B and B + UVB models and the senescence signature generated from data in the indicated publications. The numbers in parentheses are the numbers of genes regulated in the expected direction: prosenescence for the B vs. Control comparison or antisenescence in the B + UVB vs. B comparison. The graphs show the direction of gene regulation (Log2FC) and the biological processes associated to the regulated genes (background color depicted on the right).
Loss of Lkb1 prevents BRAFV600E-induced growth arrest
A substantial number of BRAFV600E-mutated human samples either lack or show low amounts of LKB1 expression [34]. Like UVB irradiation, Lkb1 inactivation disrupts BRAFV600E-induced growth arrest, promoting melanoma development and increasing tumor multiplicity in response to UVB [12, 34]. To further elucidate the molecular mechanisms that prevent BRAFV600E-induced growth arrest and/or senescence, including the contributions of Lkb1 loss in cooperation with BRAFV600E to melanoma development and its effects upon UVB radiation, we used the Tyr::CreERT2;BrafCA/+;Lkb1F/F mouse model (abbreviated B;L hereafter). Similar to the results observed in UVB-irradiated B mouse skin samples (Fig. 1F), simultaneous neonatal Lkb1 loss and BRAFV600E activation (UVB-independent) promoted the development of melanocytic neoplasms outside the hair follicles that exhibited positive staining for Ki67 and negative staining for p16Ink4a. Analogous results were observed in the UVB-irradiated samples (Fig. 3A), indicating that Lkb1 loss prevents BRAFV600E-induced growth arrest and/or senescence (OIS). To investigate the mechanisms involved in the phenotypic progression to BRAFV600E-induced growth arrest, we used neonatal melanocytes isolated from B;L mice (Fig. S2A). Analyzing the upregulated genes in B;L vs. B melanocytes (27 days) and comparing them to those upregulated in B + UVB vs. B melanocytes, we identified 931 overlapping genes. Metascape analysis suggested that these genes are involved in the regulation of the cell cycle, DNA replication, and cell division processes (Fig. 3B and Table S6). Similarly, analysis of the downregulated genes (B;L vs. B compared to B + UVB vs. B) revealed the inhibition of processes such as cell differentiation and the negative regulation of cell proliferation (Fig. 3C and Table S6). To identify common molecules or molecular mechanisms involved in the prevention of BRAFV600E-induced growth arrest and/or OIS in both models (B + UVB and B;L), we used several strategies. First, we focused on the top 200 regulated genes (log2FC > 0.265) with similar regulation in both B + UVB and B;L melanocytes but opposite regulation in B melanocytes. Thirty-six genes were regulated in the same direction in both B + UVB and B;L melanocytes. Metascape analysis revealed that these genes are involved in metabolic processes and cell proliferation, including the upregulation of Prkg2, a kinase able to activate ERK1/2 [35, 36]; Bnc1, a transcriptional activator that deregulates the AKT pathway [37, 38]; and Upp1, an enzyme that plays an essential role in pyrimidine salvage and the metabolism of uridine, with a critical role in cancer by enabling the use of uridine-derived ribose to fuel central carbon metabolism, supporting redox homeostasis, survival, and proliferation [39, 40] (Fig. 4A and Table S7). Next, we compared the upregulated genes (log2FC > 0.265) identified in the B + UVB vs. B and B;L vs. B comparisons to the downregulated genes in the gene senescence signature (antisenescence signature, 283 genes). Similarly, we analyzed the downregulated genes (log2FC < −0.265) from B + UVB vs. B and B;L vs. B comparisons against the upregulated genes in the gene senescence signature (prosenescence signature, 296 genes). Sixty-nine common genes were upregulated in both B + UVB and B;L melanocytes compared to B melanocytes but were downregulated in senescent cells. An additional 103 genes were upregulated exclusively in B;L melanocytes behaved similarly. Furthermore, 28 common genes downregulated in the B + UVB vs. B and B;L vs. B groups were upregulated in the prosenescence signature, with another 64 genes downregulated exclusively in B;L melanocytes. Since Lkb1 loss promoted B melanocyte transformation, we sought to determine which of those genes are regulated by Lkb1. We filtered the list of common genes from both models and those uniquely regulated in B;L melanocytes associated with senescence (69 upregulated and 28 downregulated common genes along with 103 uniquely upregulated and 64 uniquely downregulated genes, respectively), against a known unique LKB1-regulated gene expression signature (the top 200 regulated genes from 16 studies, for a total of 2747 genes) [41, 42] (Table S8). Forty-nine genes were identified as previously regulated by LKB1 expression and 18 of these were also differentially regulated in B + UVB vs. B tumors (Fig. 4B). The annotated biological functions of these genes were related to maintain cancer cells homeostasis and included processes such as cell cycle and mitosis (i.e., Chtf18 and Aurkb), apoptosis (i.e., Ern1 and Lmnb1), metabolism (i.e., Phgdh), stress signaling (i.e., Ern1 and Optn) and response to growth factors and hormones (i.e., Col1a1 and Ern1) (Fig. 4B, C). The differentially expressed common genes (B + UVB and B;L) (Fig. 4A–C) contributing to BrafV600E–mutant melanocyte transformation and/or malignant transformation appeared to be directly or indirectly regulated by UV irradiation or Lkb1 loss. UVB radiation and Lkb1 loss have been shown to induce DNA mutations and contribute to genomic instability [43, 44]. To assess whether genes within the senescence signature are mutated and selected for in B + UVB or B;L tumors, we analyzed the exome sequencing data from 6 tumor samples (3 B + UVB and 3 B;L) [34, 44]. This analysis identified 1147 unique mutated genes with a variant allele frequency (VAF) greater than 10% (Table S9). Of these, 624 were differentially expressed in B + UVB vs. B and B;L vs. B melanocytes (log2FC > 0.265 and log2FC < −0.265). Notably, TP53 or TERT-promoter mutations were absent in these samples. When we compared these commonly mutated genes to the senescence signature, we identified 28 overlapping genes, including Chtf18, Kif14, Nckap5, Lmnb1, Mcm5, and Tbc1d2 (VAFs of 14.3%, 20,24%, 25,4%, 10,68%, 15,3%, and 16.67%, respectively) (Fig. 4D).
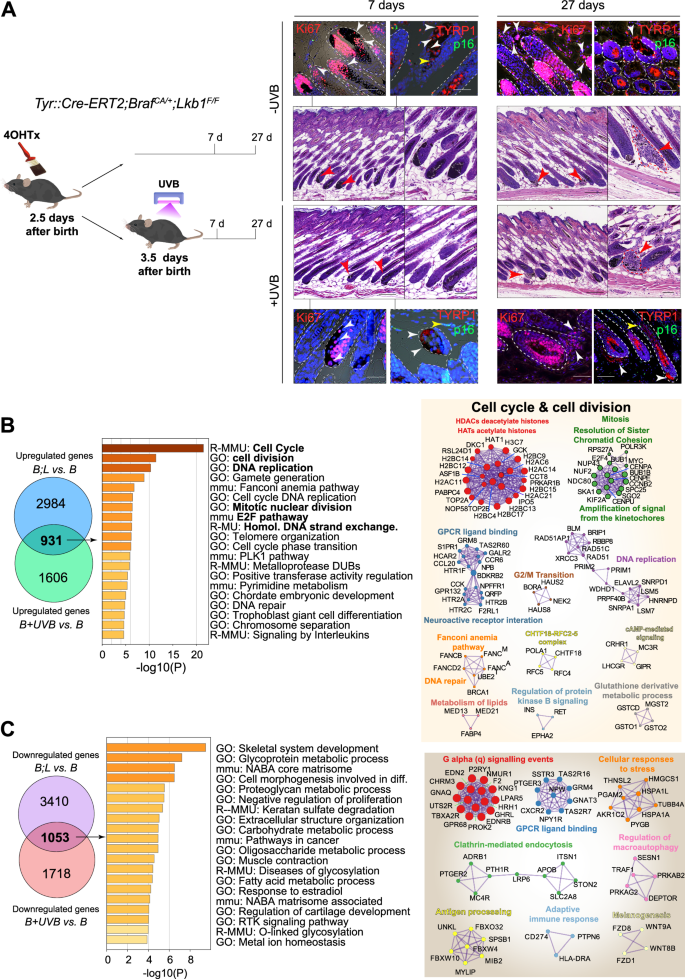
A IHC analysis of flank skin from BrafCA/+;Lkb1F/F mice harvested at various time points after the indicated treatments. The arrowheads indicate melanocytes. (Red: in H&E staining, white: Ki67 or TYRP1 positive cells, yellow: p16 positive cells); dashed lines delimitate the hair follicles; scale bars: black, 20 µm, white or red, 10 µm. B Analysis of the upregulated gene lists from the B;L vs. B and B + UVB vs. B melanocyte gene expression profiles. The graphs show the terms enriched in the common genes, colored according to the p values obtained from Metascape. Significant identified protein-protein networks of the upregulated genes (log2FC > 0.265) in B + UVB and B;L melanocytes compared to melanocytes expressing only BrafV600E (B). C Analysis of the downregulated gene lists from the B;L vs. B and B + UVB vs. B melanocyte gene expression profiles. The graphs show the terms enriched in the common genes, colored according to the p values obtained from Metascape. Significant identified protein-protein networks of the downregulated genes (log2FC < −0.265) in B + UVB and B;L melanocytes compared to melanocytes expressing only BrafV600E (B).
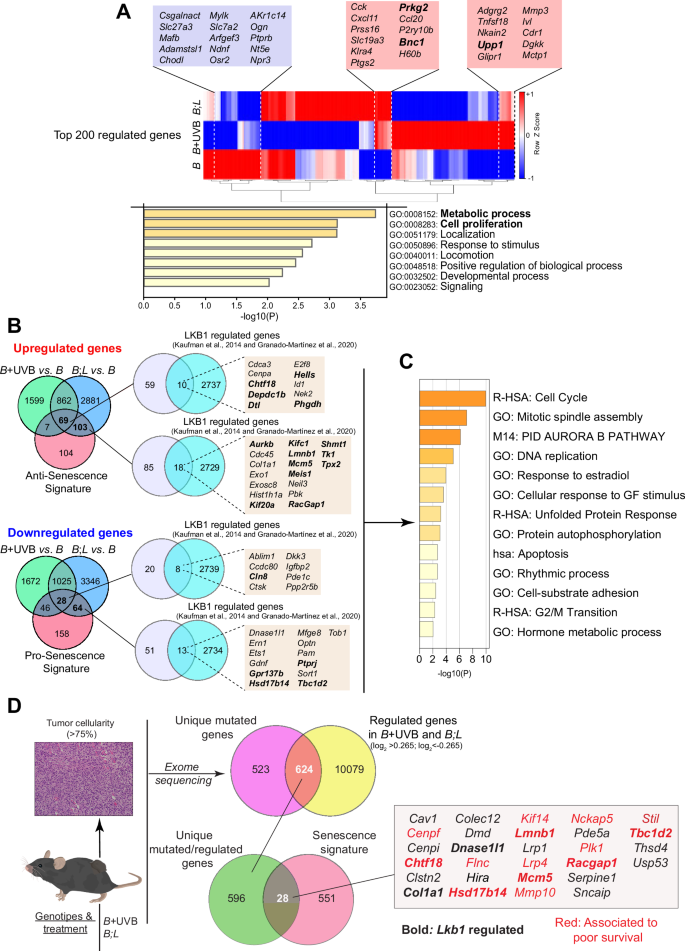
A Heatmap of the hierarchical clustering of the top 200 regulated genes in the lists. Common differentially regulated genes in B + UVB and B;L melanocytes are shown in the colored boxes (blue = downregulated, red = upregulated). The genes whose alterations are associated with poor prognosis are presented in bold font (PanCancer, TCGA database). Graph of terms enriched in the overlapping regulated genes colored according to the p values obtained from Metascape. B Venn diagrams showing the overlap of the upregulated and downregulated genes in the B + UVB vs. B and B;L vs. B comparisons interrogated with respect to the antisenescence and prosenescence signatures (genes downregulated or upregulated in the senescence signature (Fig. 2C), respectively). Venn diagrams showing overlap between the indicated gene lists filtered with respect to a list of LKB1-regulated genes. The colored boxes show the senescence-related genes regulated by LKB1. The genes whose alterations are associated with poor prognosis are presented in bold font (PanCancer, TCGA database). C Graph showing the GO terms enriched in the LKB1-regulated genes (within the boxes) colored according to the p value obtained from Metascape. D Venn diagrams showing the unique mutated genes overlapping with the regulated genes in B + UVB vs. B and B;L vs. B and the unique mutated and regulated genes in B + UVB vs. B and B;L vs. B identified in the senescence signature. The identified genes are shown in the box. Red, genes associated with poor survival (PanCancer, TCGA database); bold, genes regulated by LKB1.
Upregulation of BNC1, KIF14, NCKAP5, PHGDH, PRKG2 and UPP1 is observed during melanoma progression
Multiple genetically altered genes associated with cancer homeostasis appear to participate in the prevention of BRAFV600E-induced growth arrest and/or OIS. To identify genes relevant to these processes common in both models, we analyzed the survival rates of melanoma patients (via the TCGA database) with genetic alterations in upregulated and/or mutated genes (Fig. 4). Twenty-three of these genes, including AURKB, BNC1, CHTF18, PHGDH, PRGK2 and UPP1, were associated with poor survival independent of any other genetic alterations (Fig. S3). The transcriptional regulation of these genes in response to treatment (27 days after 4OHTx and/or UVB treatment) was confirmed by RT‒PCR in B, B + UVB, and B;L melanocytes (Fig. S4A).
Cutaneous melanoma exhibited the highest frequency of mutations and/or amplifications in BNC1, PHGDH, PRKG2, and NCKAP5, compared to 30 other tumor types in the TCGA cohort. UPP1, CHTF18, and KIF14 also showed important alterations (Fig. S4B). We further investigated the contributions of these genes in the prevention of BRAFV600E-induced growth arrest and melanocyte transformation.
To functionally confirm the participation of these genes in BRAFV600E-mutant melanocytes, we validated their regulatory effects of the selected regulated genes in human melanoma cell lines and tumor samples. Proteins BNC1, CHTF18, KIF14, NCKAP5, PHGDH, PRKG2, and UPP1 appeared to be upregulated in melanoma cell lines compared with melanocytes, including patient-derived cells (Fig. 5A). shRNA depletion of these proteins reduced melanoma cell proliferation and/or viability (Fig. S5). Notably, as proof of concept for the regulation of these molecules during melanoma progression, tissue samples diagnosed as BRAFV600E-mutated nevus-associated melanoma showed that the residual nevus component had very low or negative staining, while the melanoma component expressed elevated levels of these proteins (Fig. 5B). Further assays using 6 nevus, 4 superficial melanoma and 8 malignant melanoma samples confirmed the increased expression of BNC1, KIF14, NCKAP5, PHGDH and UPP1 during malignization. Expression of PRKG2 and CHTF18 was more variable, although CHTF18 showed prevalent nuclear staining in malignant melanoma samples (Fig. 5C and S6). These results support the participation of these proteins in melanocyte transformation under BRAFV600E-induced growth arrest.
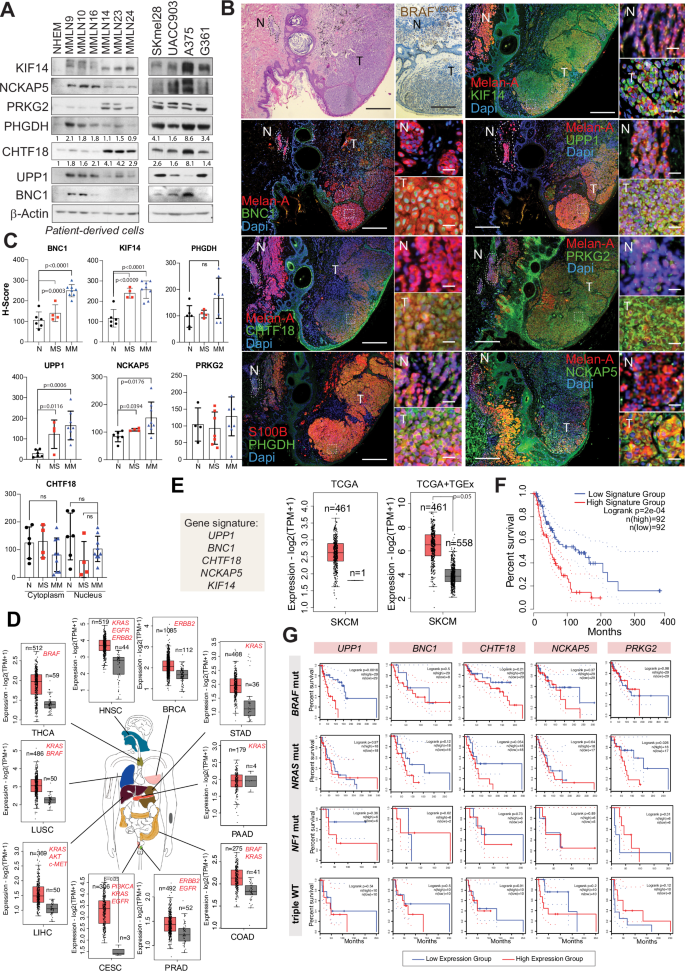
A Western blot analysis of the indicated proteins in melanoma cells. NHEMs were used as controls. Quantifications are shown in proteins detected in the control (NHEM). B IHC analysis of the indicated proteins in BRAFV600E-mutated human samples. N = remaining nevus component, T = tumor. Bars, 500 µm and 50 µm. C IHC analysis of BRAFV600E-mutated human samples during melanoma progression. The graphs show the quantitative H-scores of the indicated proteins (6 nevi (N), 4 melanomas in situ (MS), and 8 infiltrating malignant melanomas (MM)). ns = not significant. D Expression of the selected 5-gene signature in different tumor types harboring driver oncogenes (red) (GEPIA 2, TCGA database). The error bars indicate the SDs. E Graphs showing the expression of the 5-gene signature in melanoma samples and either nonmalignant melanocytes or sun-exposed skin samples. The error bars indicate the SDs. F Kaplan–Meier survival curve of patients with either high or low expression of the 5-gene signature. G Kaplan–Meier survival curve of patients with either high or low expression of the indicated 5 genes according to the melanoma molecular subtype.
Upregulation of BNC1, CHTF18, KIF14, NCKAP5, and UPP1 is associated with melanoma and oncogene-driven cancers
Given their association with BRAF-mutated melanoma progression, we explored whether these genes were similarly involved in other tumors driven by oncogene-mediated activation of the RAS pathway (e.g., BRAF, KRAS, ERBB2). Using TCGA and GTEx datasets (via GEPIA 2) [45], we observed upregulation of BNC1, CHTF18, KIF14, NCKAP5 and UPP1 in 10 oncogene-driven tumor types, excluding pancreatic adenocarcinoma, compared to corresponding normal tissues (Fig. 5D). These five genes were significantly upregulated in melanoma samples compared with melanocytes and normal sun-exposed skin samples (Fig. 5E), and high expression correlated with poor survival (Fig. 5F). Despite the small sample size, analysis of the individual associations with poor overall survival with melanoma subtype showed that high expression of UPP1 was linked to poor survival in the BRAF-mutated melanoma, high expression of either CHTF18 or BNC1 associated with poor survival in both the BRAF– and NRAS-mutated melanoma subtypes, and high expression of PRKG2 correlated with poor survival in the NRAS-mutated melanoma (Fig. 5G). These findings suggest that these genes play a role in the malignant transformation mediated by RAS-pathway-activating driver oncogenes.
UPP1, CHTF18, and BNC1 promote the transformation of BRAF
V600E-mutated melanoma cells toward a neural crest-like phenotype
Melanocyte transformation typically requires the cooperation of multiple overlapping mechanisms involving oncogenes like BRAF. UPP1, BNC1, and CHTF18 were associated with poor survival in BRAF-mutated melanoma (Fig. 5G). To validate this, we studied the contributions of these genes to BRAFV600E-induced transformation and dedifferentiation using human neonatal melanocytes (Fig. S7A). BRAFV600E-transduced neonate melanocytes exhibited significantly higher β-Gal staining compared to other combinations (Fig. S7B). Human neonatal melanocytes transduced with BRAFV600E and selected for 27 days (with or without UPP1, CHTF18, or BNC1) were characterized by scRNA-seq to identify different populations of transformed cells (Fig. 6A and S7C). Integrated scRNA-seq analyses of BRAFV600E-transduced melanocytes (BRAF sample, 13,825 cells) and pooled-samples (BRAFV600E with UPP1, CHTF18 or BNC1; Pool sample, 6359 cells) revealed nine distinct clusters (Fig. 6B). BRAFV600E expression was similar in both the BRAF and Pool samples, while UPP1 and CHTF18 were markedly upregulated in most clusters within the Pool sample. In contrast, BNC1 was upregulated in only a subset of cells, specifically clusters 6 and 7 of the Pool sample, likely in a cell-context dependent manner (Fig. 6C). Analysis of the upregulated senescence-related gene expression signature revealed decreased expression of these genes in the Pooled sample compared to that in the BRAF sample (Fig. 6D), suggesting that these molecules play a role in preventing BRAFV600E-induced growth arrest and/or melanocyte transformation. The stochastic distribution of cells between the two samples (BRAF/Pool ratio = 2.17) was notably altered in clusters 5, 6, 7, and 8, with an increased number of Pool sample cells in clusters 6 and 8 (Fig. 6E). Expression analysis of gene signatures associated to melanocytic differentiation state and overexpressed genes [1, 46] (Table S10) categorized the clusters by cell subtype (melanocytic, transitory, neural crest-like and undifferentiated) enrichment. Cluster 1 was predominantly melanocytic, clusters 2 and 3 were enriched in proliferative cells, and clusters 5–8 were enriched in transitory, neural crest-like, and undifferentiated cells. Interestingly, cluster 6 was characterized by a low-MITF/high-AXL/high-NGFR expression profile, a phenotype associated with early resistance to multiple targeted drugs [47], suggesting the clonal generation of these resistant cells during BRAFV600E-induced transformation. Additionally, the Pool sample fraction in cluster 6 also showed upregulation of the AREG (EGFR ligand), PMEPA1 (TGFβ inhibitor), and the 5’-nucleotidases NT5E, RAMP1 and ANGPTL4, proteins that regulate metabolic and nonmetabolic functions connected to lipid metabolism and several aspects of vascular function and dysfunction [48] (Fig. 6F). Independent expression analysis of cells in clusters 6–8 confirmed the enrichment of UPP1-, CHTF18- or BNC1-transduced BRAFV600E melanocytes (Pool sample) in the neural crest-like and undifferentiated cell subtypes (Fig. 6G). Taken together, these results support the involvement of UPP1, CHTF18, and/or BNC1 in preventing BRAFV600E-induced growth arrest, melanocyte transformation, and dedifferentiation.
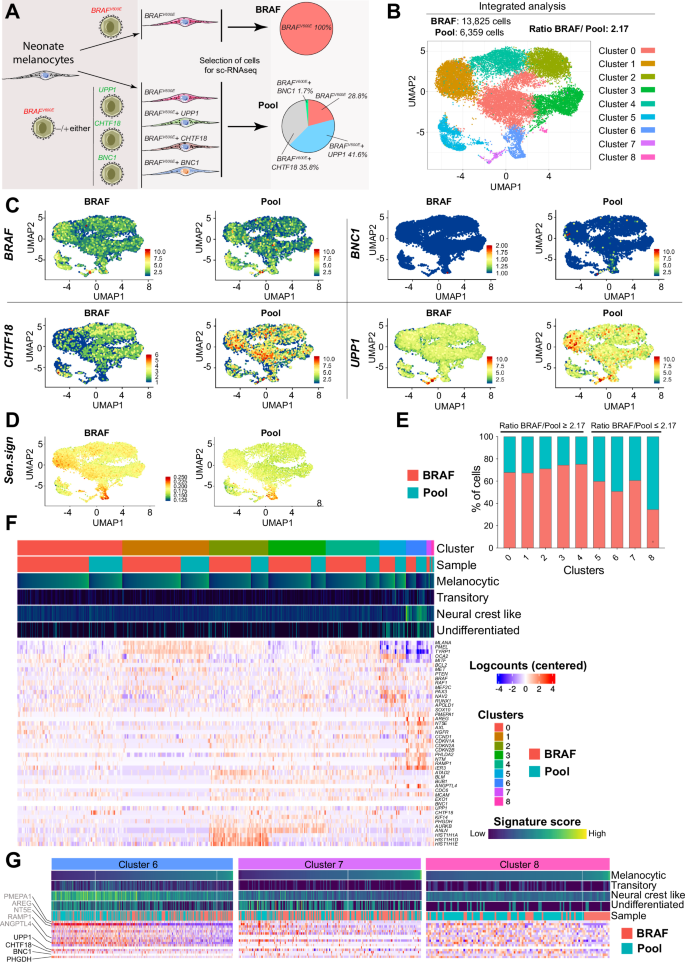
A Schematic diagram showing the different transduced melanocyte populations and samples (BRAF and Pool) used for scRNA analysis. B UMAP plot showing the clusters identified via integrated analysis of both samples (BRAF and Pool) (C) UMAP plots showing the expression of the transduced genes in each sample population within the different identified clusters. D UMAP plot showing the regulation of senescence signature expression (upregulated genes) in both samples after integrated analysis. E Graph showing the stochastic distribution of the percentage of cells from the two samples (BRAF and Pool) in each identified cluster. F Heatmap showing the DEGs among the clusters and between the samples. The upper bars indicate the cluster numbers, sample types, and expression levels of the indicated gene signatures within each cluster and sample type. G Heatmaps showing the differential expression of the indicated gene signatures in clusters 6, 7, and 8. The bars indicate the expression levels of the genes associated with each signature and the type of sample (BRAF or Pool). The scales for the heatmaps and bars are the same as those in (F).
Targeting UPP1 effectively suppresses BRAF
V600E mutant tumor growth in vivo
UPP1 was recently identified as a driver of compensatory metabolism, highlighting its potential as a therapeutic target in solid tumors [40]. As proof of concept for the use of some of these molecules as possible targets for melanoma treatment, we tested the efficacy of targeting UPP1 both in vitro and in vivo. Pharmacological inhibition of UPP1 with 5-benzylacyclouridine [49] showed that melanoma cells were more sensitive to UPP1 inhibition than were melanocytes or fibroblasts (Fig. 7A). For in vivo testing, we transduced melanoma cells with an inducible shUPP1 construct. In agreement with the above data (Fig. S5), the proliferation of BRAFV600E-mutant melanoma cells was clearly inhibited in vitro upon UPP1 depletion (Fig. 7B). To test the contribution of UPP1 to in vivo tumor growth, we chose A375-ind-shUPP1 cells as a model. Depletion of UPP1 effectively reduced in vivo tumor growth (Fig. 7C). UPP1 is essential for the utilization of uridine to fuel carbon metabolism and support nucleotide biosynthesis, reducing potential, bioenergetic activity, and cell proliferation [40]. Molecular analysis of tumor samples revealed that depletion of UPP1 led to lower levels of cyclin E, cyclin B1, and pRb phosphorylation and higher levels of the cell cycle inhibitor p27KIP1 than in control tumors, suggesting cell cycle arrest at S phase entry. We did not observe significant differences in cell death; however, restriction of the use of uridine to fuel carbon metabolism was also reflected in the downregulation of PFK1, the main regulator of glycolysis, reinforcing the role of UPP1 role in melanoma (Fig. 7D).
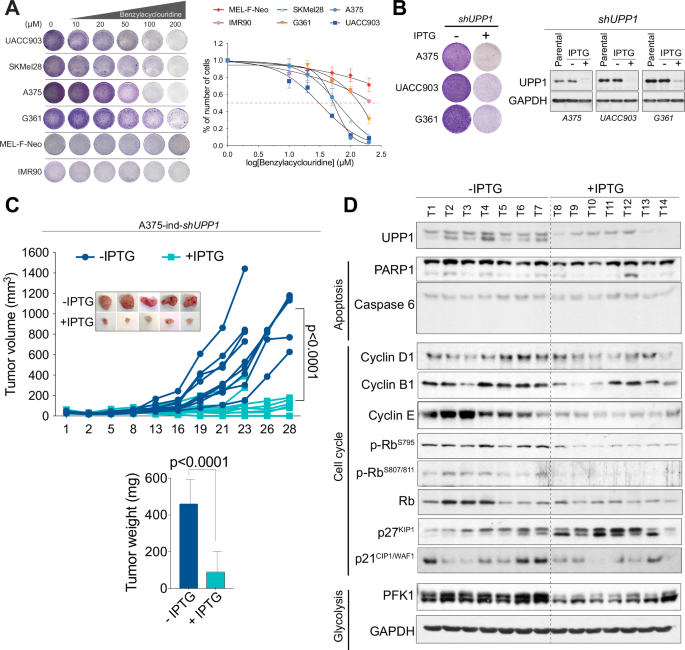
A Representative images of viability assays with crystal violet staining and viability curves of melanoma cells treated with the UPP1 inhibitor 5-benzylacyclouridine. The error bars indicate the SEMs. B Representative images of viability assays with crystal violet staining and western blots of melanoma cells transduced with an IPTG-inducible shUPP1 construct (n = 3 independent experiments). C In vivo growth curves of tumors formed from IPTG-treated and untreated A375-ind-shUPP1 melanoma cells. The inset shows representative images of the tumors. The graph shows the tumor weights. The bars indicate the SEMs. D Western blot showing the relative abundances of the indicated proteins in tumors formed in IPTG-treated and untreated mice.
Discussion
UV radiation and oncogene-mediated activation of the RAS pathway are major drivers of cutaneous melanoma. Approximately two-thirds of melanomas arise on normal-appearing skin lacking precursor lesions (nevi) [50]. Previously, it was shown that the expression of BRAFV600E in melanocytes stimulates proliferation (nevus formation) but eventually leads to growth arrest and OIS. Recent studies challenged this model, proposing that melanocytes from nevi exhibit growth arrest but remain viable and metabolically active, with the potential for reactivation and transformation [5, 51]. Accumulation of mutations that cooperate with BRAFV600E accelerates melanoma development, especially with UVR exposure [22, 25]. Here, we investigated the concomitant neonatal BRAFV600E oncogene activation and UVB irradiation as a mechanism for preventing oncogene-induced growth arrest and/or OIS and the identification of potential targets involved in BRAFV600E–mutant melanocyte transformation.
Previous studies demonstrated the cooperative effects of UVR and oncogenes/tumor suppressors in melanoma development and progression in different contexts [24,25,26]. However, to our knowledge, no prior research has specifically investigated transcriptional reprogramming promoted by the concomitant conditional neonatal activation of only BrafV600E and UVB irradiation contributing to melanoma development. Our results showed that this combination promotes melanoma development with high penetrance, suggesting that UVB irradiation prevents oncogene-induced growth arrest and/or OIS. This assumption was supported by the observation of small dermal amelanotic lesions 4 weeks after BRAFV600E activation and UVB irradiation. Currently, the existence of cell autonomous mechanisms such as BRAFV600E-induced OIS and nonpermanent oncogene-induced growth arrest are debated [5, 52]. Additionally, the timing of growth arrest following BRAF activation varies between in vitro and in vivo models [4]. In our study, melanocytes were analyzed 27 days post-treatment, the same time frame as the in vivo observations. Unlike nonirradiated BrafV600E-mutant melanocytes, those exposed to UVB showed clear upregulation of processes that counteracted growth arrest and differentiation. No single hallmark distinguishes senescence from other growth-arrested cellular states. Senescence is assessed by a collection of traits, none of which is necessary or sufficient. To avoid missing key contributors to this phenotype, we generated a gene expression signature combining different gene expression patterns involved in different types of growth-induced arrest and senescence in several cell types, including melanocytes. Analysis of this signature confirmed the cooperative effect of UVB radiation on preventing cell growth arrest and promoting the transformation of BrafV600E-mutant melanocytes. Sixty-six percent of genes from the generated senescence signature were regulated in BrafV600E-mutant melanocytes, with few of them regulated in the opposite expected direction, suggesting the possibility of nonpermanent cell growth arrest in certain cells. To further explore mechanisms preventing BrafV600E-induced growth arrest, we searched for common features between UVB-irradiated BrafV600E-mutant melanocytes and a model in which Lkb1 loss allows the progression of BrafV600E-mutant melanocytes (no UVB-induced mutations) [12]. LKB1 expression is low or absent in a large proportion of human melanomas [44], and its loss contributes to genomic instability and transformation, particularly in response to UVB [34, 44, 53, 54]. Interestingly, the common transcripts between these models involved in melanocyte transformation and melanomagenesis (i.e., Aurkb, Ptprj, Phgdh, and Lmnb1) were regulated in opposition to those observed during BRAFV600E-induced cell growth inhibition [5, 55, 56]. Upp1, Bnc1, and Chtf18, previously implicated in cell proliferation and differentiation [38, 57,58,59], were also involved. In B + UVB and B;L tumors, Chtf18, Lmnb1, RacGap1, and Cep350 were mutated, and several genes, including Aurkb, Lmnb1, and RacGap1 were directly regulated by Lkb1 [41, 42]. Cep350 was identified as a melanoma tumor suppressor [60], and AURKB suppression contributes to BRAFV600E-induced reversible mitotic arrest in human melanocytes [5]. Interestingly, the upregulation of several of the identified genes is associated with poor survival in human melanoma patients, independent of any other alteration. KIF14, NCKAP5, PRKG2, PHGDH, CHTF18, UPP1, and BNC1 are upregulated in melanoma cells and during melanoma progression, highlighting their role in BRAFV600E-mutant melanocyte malignancy, particularly UPP1. In fact, depletion of these proteins in melanoma cells has a significant impact on their viability.
In a broader context, the upregulation of these genes, involved in different aspects of tumor biology, is associated with other tumor types characterized by driver oncogene-mediated activation of the RAS pathway (EGFR, RAS, RAF…). In the case of tumor suppressor driver tumors, this is more difficult to evaluate because the loss of a tumor suppressor gene alone is generally not sufficient to generate cancer without the participation of an oncogene or additional genetic or environmental factors. However, all the interrogated proteins were previously associated with malignancy. BNC1 expression and stability may be influenced by particular mutational contexts; however, BNC1 plays diverse roles in breast cancer, squamous cell carcinoma, and head and neck tumor progression depending on the cellular context and disease stage [61,62,63]. CHTF18 is responsible for loading proliferating cell nuclear antigen (PCNA) onto DNA during the S phase and is involved in DNA repair, which may be particularly relevant in melanoma cells [64]. Several studies highlight the role of PHGDH in melanoma tumor growth and metastasis [65, 66], while UPP1 has been shown to be implicated in lung adenocarcinoma progression and pancreatic cancer metabolic adaptation, enabling tumors to thrive under glucose restriction and develop drug resistance [40, 59].
While none of these genes alone may be sufficient to overcome BRAFV600E-induced growth arrest, they likely contribute to melanocyte transformation and dedifferentiation, impacting tumor progression. Although our scRNA-seq analysis did not account for the tumor microenvironment (e.g., UV-mediated inflammation), it supports the role of UPP1, CHTF18, and BNC1 in cell-autonomous dedifferentiation toward neural crest-like and undifferentiated phenotypes, as observed in Lkb1-null BrafV600E-mutant mouse tumors, independently of UVR [44]. Additionally, we identified a low-MITF/high-AXL/high-NGFR subpopulation within the BRAFV600E mutant cells, previously associated with early resistance to targeted therapies [47], suggesting this subpopulation emerges early during transformation.
Overall, our findings indicate that these molecules are components of the machinery necessary for malignancy and/or tumor maintenance. While not all may be viable therapeutic targets, UPP1 represents a potential metabolic adaptation critical for tumor cell survival, particularly under nutrient deprivation [40]. The differential overexpression of UPP1 in tumors and the results of our preclinical experiments support this metabolic axis as a therapeutic target.
Collectively, our data demonstrate the cooperative effect of concomitant BRAFV600E activation and UVB irradiation on melanoma development through transcriptional reprogramming, identifying novel targets for further exploration.
Materials and methods
Materials availability
Materials associated with this manuscript will be available upon request. Some plasmid constructs will be subjected to an MTA due to the backbone use restrictions.
Reagents
4-Hydroxytamoxifen (4OHTx) was obtained from Sigma (St. Louis, MO, USA). Primary antibodies against Melan-A (MA5-15237; IHC 1:100), KIF14 (PA5-87769; WB 1:1000; IHC 1:100), p16Ink4a (MA5-17142; IHC 1:100), S100B (#710363; IHC 1:100), CHTF18 (A301-883A; IHC 1:50), BNC1 (PA5-85984; IHC 1:200) and p21CIP1/WAF1 (MS-891-P1; WB 1:1000) were purchased from Thermo Scientific (Waltham, MA, USA). The primary antibody against BNC1 (ARP33283; WB 1:1000) was obtained from Aviva Biosciences (San Diego, CA, USA). The primary antibody against NCKAP5 (STJ196143; WB 1:1000) was obtained from St. John’s laboratory (London, UK). Primary antibodies against PARP1 (#9542; WB 1:1000), Caspase 6 (#9762; WB 1:1000), Cyclin-D1 (#2926; WB 1:1000), p-RbS795 (#9301; WB 1:1000), p-RbS807/811 (#9308; WB 1:1000) and p27KIP1 (#2552; WB 1:1000) were purchased from Cell Signaling (Danvers, MA, USA). Primary antibodies against CHTF18 (sc-374632; WB 1:500), PHGDH (sc-100317; IHC 1:20; WB 1:500), and PFK1 (sc-67028; WB 1:1000) were obtained from Santa Cruz Biotechnology (Santa Cruz, CA, USA). Primary antibodies against GAPDH (60004-1; WB 1:10,000), UPP1 (14186-1-AP; WB 1:000; IHC 1:50), PRKG2 (55138-1-AP; WB 1:1000; IHC 1:50), and RB1 (10048-2-Ig; WB 1:1000) were obtained from Proteintech (Rosemont, IL, USA). Primary antibodies against NCKAP5 (HPA034639; IHC 1:100), Cyclin-B1 (05-373; WB 1:1000), and β-Actin (A3854; WB 1:10,000) were obtained from Merck (Darmstadt, Germany). Primary antibodies against Ki67 (ab16667; IHC 1:200) and Cyclin-E (ab7959; WB 1:1000) were purchased from Abcam (Cambridge, UK). The primary antibody against BRAFV600E (#760-5095) was obtained from Ventana Medical Systems. Primary antibodies against TRP1 (Pep1) and TRP2 (Dct; Pep8) were obtained from Dr. Vincent Hearing, National Institutes of Health, and each was used at a 1:2000 dilution [67]. Fluorescent secondary antibodies were purchased from Thermo Fisher Scientific.
Mouse model
The Tyr::CreERT2,BrafCA strain [10], and the Tyr::CreERT2;BrafCA;Lkb1F/F strain [68] were previously described. Both sexes were used for experiments. All mice were maintained on a mixed C57BL/6, FVB, and 129 background. All mice were cared for and maintained in accordance with animal welfare regulations under a protocol approved by the Institutional Animal Care and Use Committee of Vall d’Hebron Institut de Recerca (VHIR) and Biomedical Research Park of Barcelona (PRBB).
Melanoma initiation in vivo
Mice were treated topically on postnatal days 2.5 and 3.5 with 100 µl of an acetone solution containing 100 mg/ml 4OHTx. Neonatal mice were irradiated on postnatal day 3.5, as previously described [15]. The exposure time was 15 min for a total dose of 9.6 kJ/m2 UVB (280–330 nm) using TL 40w −12 RS lamps. Melanoma-free survival was analyzed by the Kaplan‒Meier analysis.
Primary melanocyte culture
For both models (Tyr::CreERT2;BrafCA/+ generated by crossing Tyr::CreERT2;BrafCA/CA X WT (obtained by crossing BrafCA/+X BrafCA/+) and Tyr::CreERT2;BrafCA/+;Lkb1F/F generated by crossing Tyr::CreERT2;Lkb1F/F X Tyr::CreERT2;BrafCA/CA;Lkb1F/F), dorsal skin samples were collected from neonatal mice (three pups per litter, with at least three litters per genotype) following a protocol adapted from [12]. In brief, the skin was removed from 1- or 2-days-old pups, sterilized by immersion in 70% ethanol for 5 s, and immediately washed with PBS. The skin was then incubated with 0.05% trypsin-EDTA (Gibco, Waltham, MA, USA) at 37 °C in a 5% CO2 incubator for 1–2 h. Next, the epidermis was separated from the dermis using sterile forceps and mechanically digested with a scalpel. Melanocytes were then cultured in selective medium consisting of Dulbecco’s modified Eagle’s medium (DMEM)-F12 (Biowest, Riverside, MO, USA) supplemented with 5% fetal bovine serum (FBS; Gibco), 200 pM cholera toxin (Sigma), 200 nM phorbol esters (12-O-tetradecanoylphorbol-13-acetate; TPA) (Sigma), 2 mM L-glutamine (Gibco), 10 U/ml penicillin and 10 μg/ml streptomycin (Gibco).
Cell lines and treatments
Normal human epidermal melanocytes (NHEMs; C-12400) and human neonatal melanocytes (MEL-F-NEO cells) were purchased from PromoCell (Heidelberg, Germany) and Zenbio (Durham, NC, USA), respectively, and cultured following the manufacturers’ recommendations. UACC903 (CVCL_4052) cells were a gift from J. Trent (Tgen, Phoenix, AZ, USA). A375 (CRL-1619), SKMel28 (HTB-72), and G361 (CRL-1424) cells were purchased from the American Type Culture Collection (ATCC; Manassas, VA, USA). IMR90 cells were obtained from M. Abad (VHIO, Barcelona, Spain). Patient-derived cell lines, including MMLN9, MMLN10, MMLN14, MMLN16, MMLN23, and MMLN24, were derived from cells obtained from patients after tumor surgery [69, 70]. All the samples were obtained and used with informed consent from the patients and approval from the Vall d’Hebron Hospital Ethical and Clinical Research Committee (CEIC) (PR(AG)115/2013). Patient-derived cells were cultured in DMEM (Biowest) supplemented with 20% FBS (Gibco), 2 mM L-glutamine (Gibco), 100 U/ml penicillin, 100 μg/ml streptomycin (Gibco), and 5 μg/ml Plasmocin (InvivoGen, Toulouse, France). A375 and G361 cells were grown in DMEM. UACC903 cells were cultured in RPMI 1640 medium (Biowest). SKMel28 and IMR90 (CCL-186) cells were cultured in Eagle’s minimum essential medium (EMEM) (ATCC). Unless otherwise specified, all media were supplemented with 10% FBS, 2 mM L-glutamine, 100 U/ml penicillin, 100 μg/m streptomycin, and 5 μg/ml Plasmocin. All cells were maintained at 37 °C in a 5% CO2 incubator. 5-Benzylacyclouridine (BAU) was obtained from MedChemExpress (Monmouth Junction, NJ, USA) and used at the indicated concentrations. Isopropyl-beta-D-1-thiogalactopyranoside (IPTG) was purchased from Gold Biotechnology (St. Louis, MO, USA) and used at 500 µM.
Mouse model-derived melanocytes were treated with 4OHTx for in vitro recombination and exposed to UVR. Tamoxifen was added at a concentration of 1 μM for 48 h. For UVR exposure, a Stratagene UV Crosslinker 1800/2400 was used. After the removal of the medium and the plate lid, cells at 60–70% confluence were irradiated with 30 J/m2 UVB. For combined treatments, cells were irradiated 48 h after 4OHTx treatment. After treatment, fresh medium was added, and the cells were incubated for 27 days prior to RNA isolation. During the incubation period, the culture medium was replaced every 2–3 days.
Human melanoma samples
All pseudonymized human melanoma samples were provided by the Vall d’Hebron Research Institute under the National Research Ethics Service approved study number PR(AG)59-2009. Informed consent was provided by all patients.
Molecular cloning
The pLenti-IRES-GFP plasmid was obtained from Stephan Tenbaum (Vall d’Hebron Institute of Oncology VHIO). The human UPP1, CHTF18, and BNC1 sequences were subcloned from pCMV-SPORT6-UPP1, pCMV-SPORT6-CHTF18, and pLOC-BNC1, respectively (Dharmacon, Cambridge, UK), to construct pLenti-rtTA2-UPP1-IRES-GFP, pLenti-rtTA2-CHTF18-IRES-GFP, and pLenti-rtTA2-BNC1-IRES-GFP. All short hairpin RNAs (shRNAs) against PHGDH, UPP1, PRKG2, KIF14, NCKAP5, CHTF18, and BNC1 were purchased from Sigma (Table S11). The backbone vectors of these plasmids were pLKO.1. for constitutive expression plasmids and pLKO-IPTG-3xLac0 for inducible expression plasmids. The BRAFV600E sequence was obtained from pCR4-BRAFV600E and was subcloned and inserted into pLTPC-hPGK-rtTA2-p2A-mCherry-TRE, which was kindly provided by the Hector Palmer laboratory.
Lentiviral transduction: overexpression and shRNA-mediated gene knockdown
To produce lentiviruses, three million HEK293T cells were seeded in p100 plates (Sarstedt) in 8 ml of DMEM supplemented with 10% FBS, 2 mM L-glutamine, 100 U/ml penicillin-100 μg/ml streptomycin, and 5 µg/ml Plasmocin. One hour before transfection, the medium was replaced with DMEM supplemented with 10% FBS (complement inactivated) and chloroquine (Sigma) at a final concentration of 15 μM. Then, 40 µg of total DNA (20 μg of lentiviral vector, 15 μg of pPAX2, and 5 μg of pMD2.G) was added to 150 mM sodium chloride (NaCl) to a final volume of 800 μl. Then, 200 μl of polyethylenimine (PEI) transfection reagent (1 mg/ml) (Sigma) was added to the DNA mixture, and the mixture was incubated at room temperature for 15 min. The mixture was added to cells, and the cells were incubated overnight at 37 °C. The medium was then replaced with DMEM supplemented with 2% FBS (complement inactivated) and 5 mM sodium butyrate (Sigma). After 24 h, the virus-containing supernatant was collected, and fresh medium was added to the cells. The collected supernatant was centrifuged for 5 min at 1000 rpm and passed through 0.2 µm filters (Sarstedt). The cells were incubated for another 24 h, after which the collection procedure was repeated. For cell infection, the processed supernatant containing either 4 µg/ml (MEL-F-NEO) or 8 µg/ml (UACC903, SKMel28, A375, and G361) polybrene (SCBT) was added to the cells. The infection efficacy was assessed after the addition of doxycycline (1 µg/ml) (Sigma) through detection of green (GFP) and/or red (mCherry) signals under a fluorescence microscope.
Chromogenic assay for β-galactosidase activity
Senescence-associated β-galactosidase (SA-βgal) activity was measured following the protocol of Debacq-Chainiaux et al. (Debacq-Chainiaux et al. 2009). In brief, melanocytes were isolated from the skin of neonatal mice and seeded directly on a 24-well plate (Sarstedt) at 50% confluence. After attachment, the melanocytes were treated with 4OHTx (1 µM) and/or exposed to UVR (30 J/m2) and incubated for 7 days. Before performing the assay, the cells were rinsed twice with PBS and fixed with PBS containing 2% formaldehyde-0.2% glutaraldehyde (Sigma) for 5 min at room temperature. After two washes with PBS, the cells were stained with a freshly prepared 5-bromo-4-chloro-3-indolyl-β-D-galactoside (X-Gal) staining solution containing 40 mM citric acid/Na buffer, 5 mM potassium ferrocyanide, 150 mM NaCl, 2 mM MgCl2, and 1 mg/ml X-Gal, all of which were purchased from Sigma. The cells were incubated overnight at 37 °C in the dark in a CO2-free incubator. β-Galactosidase activity was also determined in nonmalignant melanocytes overexpressing BRAFV600E alone or in combination with UPP1, CHTF18, or BNC1. For determination of the β-galactosidase activity of these cells, we followed the same procedure described above.
Immunocytochemical (IC), immunofluorescence (IF), and immunohistochemical (IHC) analyses
For IC analysis, mouse-derived melanocytes were seeded directly on coverslips in a 24-well plate (Sarstedt) at 50% confluence, incubated overnight, and, when indicated, subjected to treatment the next day. Cell staining was performed as previously described (Andreu-Pérez et al. 2011). For IHC analysis, the entire dorsal skin of the animals was collected (four animals per genotype and condition). For IF and IHC analyses, 4 μm sections of formalin-fixed, paraffin-embedded tumor samples were stained according to the antibody manufacturer’s protocol. Antibody binding was visualized with the UltraViewTM Universal DAB Detection Kit (Ventana Medical Systems) by using either horseradish peroxidase-conjugated or fluorophore-conjugated secondary antibodies. Staining was performed either manually or on an automated immunostainer (Beckmarck XT, Ventana Medical Systems, Roche, Tucson, AZ, USA). For the manually processed samples, antigen retrieval was performed using target retrieval solution (pH 6.0; Agilent, Santa Clara, CA, USA). Hematoxylin and eosin (H&E) staining was performed to evaluate the structure of the tissue. The samples were scanned (panoramic slide digital scanner) and evaluated by two independent pathologists (using 3DHistech software).
Protein isolation and western blotting
Cells were lysed in protein lysis buffer (150 mM NaCl, 50 mM Tris, 1 mM EDTA, and 1% NP-40) supplemented with protease and phosphatase inhibitor cocktails (Millipore, Burlington, MA, USA). Then, equal amounts of protein were separated by SDS‒PAGE and transferred to a PVDF membrane. Immunoblotting was performed as previously described [69]. The membrane was incubated at 4 °C overnight with primary antibodies and was then incubated for 1 h at room temperature with secondary antibodies. β–Actin and GAPDH were used as loading controls.
RNA Isolation, quantification, and quality control
For RNA purification, a Direct-Zol RNA Kit (Zymo Research, Irvine, CA, USA) was used. The isolation procedure was performed according to the manufacturer’s recommendations. The isolated RNA was analyzed with a 2100 Bioanalyzer (Agilent) to confirm the quantity and integrity of the sample. Only high-quality samples were used for subsequent analyses.
Microarray analysis
The mouse transcriptome was analyzed using a Clariom S Mouse Array (Affymetrix Santa Clara, CA, USA) (three biological replicates per condition). The raw data generated from the array were processed using the open-source software R Studio. Intensity values were converted into gene expression values using the robust multiarray average (RMA) algorithm, which consists of background correction, logarithmic transformation, quantile normalization, and probe normalization steps, via the Bioconductor package oligo. Identification of differentially expressed genes (DEGs) was carried out using the limma package. A moderated t-test was applied for each comparison based on the empirical Bayes method. Then, we generated lists of upregulated (log2FC > 0.265) and downregulated (log2FC < −0.265) genes comparing Control, B and B + UVB groups (Table S4) and B, B + UVB and B;L groups (Table S6). For functional analysis of the identified DEGs, Metascape (metascape.org) (Zhou et al., 2019) and the Molecular Signatures Database (MsigDB; gsea-msigdb.org) (Subramanian, Tamayo et al., 2005; Liberzon et al., 2011) were used. Heatmaps were generated using Morpheus (software.broadinstitute.org/morpheus). Hierarchical cluster analysis was performed based on the average pairwise distance calculated by Pearson correlation analysis.
Quantitative reverse transcription (RT)‒PCR
A total of 250 ng of purified RNA was reverse transcribed to cDNA using the SuperScriptTM III First-Strand Synthesis Kit (Thermo Fisher). Quantitative PCR analysis was performed using SYBRTM Select Master Mix (Applied Biosystems, Waltham, MA, USA), and the reactions were carried out in 384-well plates using a 7900 HT system (Applied Biosystems). The primers used were designed using BiSearch software (Arányi T et al., 2006), and the sequences are listed in Table S12. The ΔCt method was used to calculate relative expression values, which were normalized to the expression of the housekeeping genes Actb, Gapdh, and Vim. The data are presented as the mean ± SD of triplicate samples from three independent experiments.
Single-cell RNA sequencing (scRNA-seq) and data analysis
Human neonatal melanocytes (MEL-F-NEO) were simultaneously transduced with two different lentiviral constructs: pLenti-hPGK-rtTA2-p2A-mCherry-TRE-BRAFV600E and pLenti-hPGK-rtTA2-TRE-UPP1/CHTF18/BNC1-IRES-GFP. The expression of BRAFV600E, UPP1, CHTF18, and BNC1 was induced by the addition of doxycycline (1 µM) to the culture medium. After 27 days of induction, cells exhibiting red fluorescence (expressing BRAFV600E) and cells exhibiting both red and green fluorescence (expressing BRAFV600E and UPP1, CHTF18, or BNC1) were sorted by flow cytometry using Aurora CS spectral technology (Cytek).
The raw sequencing data (fastq format) were processed using 10× Genomics Cell Ranger 7.0.0 to align the reads to the GRCh38 human genome. After obtaining the count matrices, low-quality cells were filtered out. Cells with fewer than 1000 or more than 35,000 unique molecular identifiers (UMIs), fewer than 500 or more than 7000 detected genes, or an abundance of mitochondrial DNA greater than 20% of the transcriptome were excluded from the downstream analysis.
BRAF and pooled samples were combined for joint analysis. We merged both count matrices and, using the Seurat package (version 4 [71] i), we normalized the data, determined the top 3000 highly variable genes, and scaled the data. We also performed principal component analysis (PCA). We then ran Harmony ([72] ii) to remove the influence of the dataset of origin from the embedding and downstream analysis. We obtained the Harmony-corrected PCA embedding and used the top 25 corrected principal components to generate the uniform manifold approximation and projection (UMAP) plot for visualization. To cluster the cells, we first generated the 20 nearest neighbors graph and performed clustering using the original Louvain algorithm with a resolution of 0.3.
To characterize the clusters, we used several melanocyte signatures that we computed across cells using the UCell package ([73] iii). Additionally, we performed classical marker gene analysis for each cluster. All these steps were carried out using R statistical software ((version 4.3.1, R Core Team 2023)4).
In vivo tumor growth
Six-week-old athymic Foxn1nu/nu nude mice were purchased from Janvier (Le Genest, Pays de la Loire, France). Both male and female mice were used for this study. A total of 5 × 10⁶ A375 (BRAFV600E) cells were subcutaneously injected into the flanks of the mice. When the tumors reached a volume between 50–100 mm3, mice with similarly sized tumors were randomized into treatment cohorts (n = 6 per group) and IPTG was administered via the drinking water (10 mM) or intraperitoneally (i.p.) (20 mM, two injections per week) beginning at the initiation of the experiment. The mice in the control groups were treated with vehicle (PBS). Tumor growth was monitored every two days for 28 days. Tumor volume was calculated as L × w × h, where “L” is the major diameter, “w” is the minor diameter, and “h” is the third axis of the tumor mass. The maximal tumor volume permitted by the Vall d’Hebron Institute of Research Ethics Committee is 1500 mm3. Tumor samples were collected at the end of the experiment for further analysis. The results are presented as the mean tumor volumes ± SDs.
Statistical analysis
Microarray RNA expression and single-cell RNA-seq analysis were described in their respective sections. Statistical analyses were performed in GraphPad Prism 9.0 (GraphPad Software, Inc.) using 2-tailed Student’s t-test or one-way ANOVA to evaluate the significance of differences between the groups.
Senescence signature establishment
For senescence signature establishment, seven different recent publications (Marthandan et al. [31]; Hernández-Segura et al. [28]; Wiley et al. [32]; Hernandez-Segura et al. [29]; Zirkel et al. [33]; Lee and Schmitt et al. [30]; and Casella et al. [27]), including articles and reviews, were used. Studies were selected according to their relevance in the field and included the responses of different cell types to different senescence inducers.


Responses