Transcriptomic clustering of chronic lymphocytic leukemia: molecular subtypes based on Bruton’s tyrosine kinase expression levels
Introduction
Historically, CLL prognostic classification started with disease burden reflected in Rai and Binet staging [1]. Genetically, the disease could be segregated based on chromosomal anomalies such as del(17p), del(11q), trisomy 12, and del(13q) [2]. These chromosomal alterations have been standard in disease prognostication as they are highly correlated with disease course and therapy outcomes. Targeted next generation sequencing (NGS) and genomic mutations in TP53, ATM, NOTCH1, SF3B1, XPO1, BIRC3 further extend these prognostic features to define risk-categories [3]. IGHV mutation status is another important marker which can help in disease predictions, with finite-duration treatment such as chemoimmunotherapy and BCL2-inhibitor-based treatments [4]. While many of these genetic and genomic anomalies were defined as attributes of poor prognosis, with targeted therapeutics these differences are dissipated or decreasing for many such markers [1].
Prior studies in leukemias [5,6,7] and lymphomas [8] suggested utility of transcriptomics in identifying disease subgroups. For CLL, only subtypes based on prognostic factors, cytogenetics, and genomics [1,2,3] are available. Gene expression profiling data identified pathways associated with CLL progression [9]. We hypothesized that gene or protein expression analyses may provide functional omics to identify additional CLL subtypes. Current work focuses to this end.
To enrich number of patients and samples, we initially utilized publicly available transcriptomics data from 130 CLL patients to develop and test our hypothesis [9]. Then to test and validate, we used two additional sets and profiled RNA from MD Anderson cohorts. Further, we used reverse-phase protein array data to relate the functionality. In total, data from 682 patients were evaluated in the current meta-analysis of CLL. Our initial unsupervised hierarchical clustering analysis of most variable transcripts in the microarray data from 130 CLL patients indicated strong association with BTK expression. To further explore and evaluate this association, consensus hierarchical clustering [10] was performed on the normalized expression data using 5000 genes with the highest median absolute deviation (MAD). The consensus clusters were (k = 2) significantly associated with BTK transcript expression levels that we describe as BTK-Low and BTK-High subtypes. Using the same algorithm, normalized expression data from other datasets were analyzed.
To identify transcripts associated with BTK-Low and BTK-High subtypes, we performed differential expression analysis between the clusters. Downstream expression analysis on five cohorts indicated that there were distinct gene expression patterns among the two subtypes. BTK-High subtype showed increased CCL3/CCL4 levels and disease burden. BTK-Low cohort showed down-regulated mRNA and proteins of DNA-repair pathway and increased DNA-damage-response which may have contributed to abundance of inflammatory pathway transcript and proteins. BTK-Low subtype relied less on BCR pathway and more on other signaling axes. High-BTK subgroup was enriched in mRNAs of replication pathway and transcription machinery. In conclusion, consensus clustering of gene expression data suggested two subtypes which were closely associated with BTK expression level.
Patients and methods
Description of CLL patient data sets
Gene expression datasets from five cohorts were used for the meta-analysis (Supplementary Table 1) of patients with CLL. Initial clustering and assessment of association with BTK mRNA expression was performed using Affymetrix Microarray data set that has 130 patients [9] designated as Set1. In addition, we tested this hypothesis in two other publicly available expression cohorts [11, 12], named as Set2 and Set3. These expression datasets were profiled by Affymetrix Microarray and RNA sequencing, respectively. These three cohorts had RNA samples from treatment-naïve and previously treated patients, that included a total of 531 CLL patients. We further validated these results in two additional cohorts (Set4 and Set5) at MD Anderson after profiling RNA using Next-generation sequencing from a total of 151 patients who were previously treated or untreated.
Patients and sample collection
In case of samples in Set4 and Set5 (in house collection and analyses), peripheral blood samples were obtained from patients with CLL. Collection and use of patient samples were obtained by informed consent and approved by the University of Texas MD Anderson Cancer Center Institutional Review Board. The clinical patient characteristics and previous treatments are summarized in Supplementary Table 2.
Peripheral blood collection and sample preparation
Blood from patients was collected into Vacutainer glass green top (sodium heparin) tubes for the isolation of plasma and white blood cells (Becton Dickinson). The tubes were centrifuged to separate the plasma, and the remaining blood was processed immediately by Ficoll-Hypaque density gradient separation, as described previously [13]. The peripheral blood mononuclear cells (PBMCs) were isolated and washed twice with phosphate-buffered saline, and the cell numbers were determined using a Z2 Coulter Particle Count and Size Analyzer (Beckman Coulter). Cell pellets were stored in liquid nitrogen vapor phase or in –80 °C freezer. Previous studies from our group have quantitated >90% CLL cells in such population [14]. Cells were used for RNAseq and RPPA (471 antibodies) (Supplementary Table 3).
Measurement of chemokine levels
Levels of chemokines such as CCL2, CCL3 (Mip-1α) and CCL4 (Mip-1β) in plasma were quantitated using Quantikine enzyme-linked immunosorbent assay immunoassays (R&D Systems). Absorbance was measured at a wavelength of 450 nm, using a microplate reader (Powerwave XS BioTek Instruments). The results are presented as the means of duplicate analyses in picograms per milliliter.
Next generation mRNA sequencing
RNA was isolated from cell pellets using Qiagen RNeasy Mini Kit (Qiagen, Hilden, Germany, 74104) according to the manufacturer’s instructions. During the procedure, traces of DNA contamination were eliminated using DNases. The total RNA extracted were quantitated and qualified using ThermoFisher Nanodrop 1000 and Agilent Technologies Bioanalyzer 2100 RNA 6000 nano assay kit (PN 5067-1511). The qualified total RNA with RIN > 9.0 were processed for sequencing library construction using Illumina Truseq stranded mRNA library preparation kits (Illumina, PN RS-122-2101 and RS-122-2102), following guidance of Illumina Truseq stranded mRNA protocol. In Brief, 100 ng of total RNA were used for poly(A) containing mRNA enrichment using oligo(dT) coated magnetic beads. The purified mRNA was fragmented into small pieces using divalent cations under elevated temperature. The RNA fragments were then reverse transcribed into first strand cDNA using reverse transcriptase and random hexamers primers for RT priming, followed by second strand cDNA synthesis using DNA polymerase I and RNase H. These double strand cDNA fragments were end-repaired and then Adenylated 3ʹ Ends with the addition of a single ‘A’ base to prevent self-ligation during subsequent ligation to the illumina index-specific adapters that has a single “T” at 3ʹ end which provides complementary overhang for ligating the adapter to the fragment. The raw library products are purified and enriched by PCR to create the final cDNA sequencing library. The final sequencing library contains both coding RNA, as well as multiple forms of poly-adenylated non-coding RNA in flank with P5 and P7 adaptors with R1, R2 and i7 index primer binding regions. The individual final library with index was quantified by Agilent Bioanalyzer and normalized before they were pooled into a multiplex sequencing library.
Sequencing was performed on Illumina Nextseq 500 sequencer using TruSeq High Output Kit V2 150 cycles, (FC-404-2001) in PE75 sequence run. To ensure the sufficient data coverage for high, medium, and low copy number transcripts transcribed, fifteen indexed mRNA libraries were pooled and sequenced per flow cell run with output data 60-70 million PE reads per sample. Sequencing data QC matrix was measured by Q30 > 90%. The raw data bcl files were de-multiplexed and converted into fastq file by using Illumina bcl2fastq2 conversion V 2.19 software.
RNA sequence analysis
The raw reads from tumors were aligned to the Human genome (GRCh38), with Star transcriptome alignment tool [15]. HTseq software was utilized to summarize the gene expression counts from alignment data [16]. Normalization of counts and differential expression analysis was performed on the read counts with the R package DESeq2 [17].
Analysis of microarray data
The Affymetrix data was background corrected, normalized and summarized by Robust Multichip Average (RMA) algorithm. A unique representative probe set was selected for each gene based on the overall score estimated by Jetset for the Affymetrix HGU133plus2 arrays [18]. Differential expression analysis was performed using t-tests on the normalized expression data.
Gene expression analysis
Hierarchical clustering (Pearson distance and ward linkage) and principal component analyses were used for unsupervised expression investigation. Further, consensus hierarchical clustering [10] was performed by Pearson distance and ward linkage using genes with the highest median absolute deviation (n = 5000). The hierarchical clustering was repeated 10,000 times, taking a subset (80%) of samples and genes for every iteration to generate robust consensus groups. Significant differentially expressed genes were defined by false discovery rate of 0.05 and log fold change threshold of 1. Pre-ranked Gene Set Enrichment Analysis (GSEA) based on differential expression and Gene Set Variation Analysis (GSVA) was performed using the Hallmark and KEGG pathway databases to assess the function of subtypes [19, 20].
Reverse phase protein array (RPPA)
Cell pellets were lysed in mammalian protein extraction reagent with protease and phosphatase inhibitor cocktails for 30 min on ice. Then, the cell lysate was centrifuged and the supernatant was collected. Protein concentration was determined by BCA assay (Thermo Fisher Scientific) and was adjusted to 1 to 1.5 μg/μL. Cell lysate was mixed with 4× SDS sample buffer and the samples were boiled for 5 min. RPPA data were generated at MD Anderson Cancer Center Functional Proteomics RPPA Core Facility.
Briefly, denatured cellular proteins were diluted in five twofold serial dilutions in dilution lysis buffer. Serial diluted lysates were arrayed on nitrocellulose‐coated slides (Grace Bio Lab) by Aushon 2470 Arrayer (Aushon BioSystems). Each slide was probed with a validated primary antibody plus a biotin‐conjugated secondary antibody. A listing of the antibodies used for RPPA is in Supplementary Table 3. Only antibodies with a Pearson correlation coefficient between RPPA and western blotting of greater than 0.7 were used. The signal obtained was amplified using a Dako Cytomation–Catalyzed system (Dako) and visualized by DAB colorimetric reaction. The slides were scanned, analyzed, and quantified using a customized software to generate spot intensity. Relative protein levels were quantified using the SuperCurve method implemented in R [21]. The relative levels were normalized for protein loading and median centered for downstream data analysis. Differential protein analysis was performed using t-tests. Significant differentially expressed proteins were defined by false discover rate of 0.05 and log fold change threshold of 1.
BTK protein immunoblots and protein quantitation
CLL cells were lysed at 4 °C in radioimmunoprecipitation assay buffer supplemented with 1 mini complete Protease Inhibitor (Roche) tablet per 10 mL of buffer, and protein content was measured using a DC protein assay kit (Bio-Rad) according to the manufacturer’s protocol. Total protein (30 μg) was boiled with Laemmli sample buffer and loaded onto SDS-polyacrylamide gel and transferred to PVDF membranes (GE Osmonics Labstore, Minnetonka, MN). The membranes were blocked at room temperature for 1 h in Odyssey blocking buffer (LI-COR Inc), then incubated with primary BTK (catalog # 85475, Cell Signaling) and vinculin (catalog # 13901, Cell Signaling) antibodies. After washing with phosphate buffered saline with 0.05% Tween-20, membranes were incubated with infrared-labeled secondary antibodies (LI-COR Inc) for 1 h. Before visualization, membranes were washed 3 times with PBST then visualized with the use of an LI-COR Odyssey Infrared Imager. BTK protein bands density normalized to the vinculin bands density in each extract.
Statistical analysis
Wilcoxon rank sum test was used to determine statistical significance between the subtypes among molecular markers and pathways. Enrichment analysis using KEGG and Hallmark pathway databases was performed on common significant genes across all subsets using hyper-geometric tests. P values obtained from multiple testing, where applicable, were adjusted by estimating the False Discovery Rate [22]. Treatment-free survival analysis was performed between the cohorts of patients in the two subtypes using the Kaplan-Meier estimate.
Ethics approval and consent to participate
All methods were performed in accordance with the relevant guidelines and regulations. Live vertebrates were not used in this project. Patients with CLL disease participated in this project. Collection and use of patient samples were obtained by informed consent from each participant and protocol to collect patient sample was approved by the University of Texas MD Anderson Cancer Center Institutional Review Board.
Results
CLL gene expression cohorts
Gene expression datasets from five cohorts were used for the analysis of patients with CLL (Supplementary Table 1). The initial dataset (Set1, n = 130; GSE39671) had all previously untreated patient samples that were profiled using Affymetrix microarrays [9]. Second and third public data sets were samples from a mix of treatment-naïve and previously treated patients. The second set (Set2) was profiled by Affymetrix microarrays while third was assayed using RNA sequencing (Set3). Fourth data set included 126 patients (Set4); half of them were previously untreated while other half were previously treated patients whose disease had relapsed or was refractory to treatment. We used RNAseq to profile these samples. Last set with smaller number of patients (Set5, n = 25) had all relapsed/refractory disease and analyses were done using RNAseq as well as RPPA assays.
Consensus clusters are associated with BTK mRNA expression
Unsupervised hierarchical clustering analysis of most variable transcripts in the microarray data from Set1 (130 CLL patients), showed association with BTK expression (Fig. 1A). Consensus clustering was performed on the normalized expression data using 5000 genes with the highest median absolution deviation (Fig. 1B). The consensus clusters (k = 2) were significantly (p = 1.39e–12) associated with BTK mRNA expression; 47 patients were in BTK-High and 83 were in BTK-Low groups (Fig. 1C). In contrast, these clusters did not associate with other clinical features such as age, gender, IGHV mutation status, and ZAP-70 expression level (not shown). Functionally, these two BTK-groups showed significant difference in probability of remaining untreated (progression-free) within the CLL cohort (Fig. 1D). BTK-Low subtype required treatment in less than 6.5 years after diagnosis, while BTK-High cohort needed treatment in less than 2 years. To further validate this clustering pattern, other datasets (Set2–Set5) were analyzed using the same algorithm.
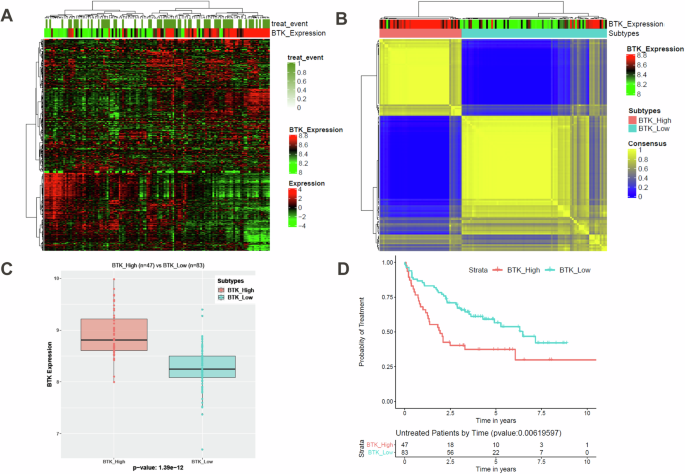
Hierarchical clustering of normalized gene expression data revealed two distinct groups associated with BTK expression (A). The hierarchical clustering was repeated 10,000 times, taking a subset (80%) of samples and genes for every iteration to generate robust consensus groups. Consensus clustering was performed on the normalized expression data using 5000 genes with the highest median absolution deviation (B). The consensus clusters (k = 2) are significantly associated with BTK mRNA expression (C, BTK subtypes). There is significant difference in these BTK subtype’s probability of remaining untreated (progression-free) within this CLL cohort (D).
We compared BTK transcript level between consensus clusters in each cohort. As shown in Fig. 2A–D, in each of the cohorts these two clusters indicated significant difference in BTK mRNA expression. So, we deemed these clusters as BTK subtypes based on the BTK mRNA expression level. Proportion of patients in BTK-High or BTK-Low subtypes were different in each cohort. While CD38 positivity is marginally associated with BTK-Low subtype in Set4 (p = 0.031, n = 129), there is no association in the smaller internal (Set5) cohort (Supplementary Fig. 1A, B). There is a significant difference between BTK subtypes among chromosomal aberrations profiled by FISH (p = 7.927e–06). 13qdel is enriched in BTK-High group, while trisomy 12 is limited to BTK-Low group to the most part in Set4. Similar to Set1, BTK-High and BTK-Low groups did not associate with other features such as age, gender, IGHV mutation status, and ZAP-70 expression level (not shown). Other prognostic factors of CLL such as TP53 aberrations, chromosomal abnormalities [del(17p) and del(11q)], and type of prior treatment were also not associated with the BTK subtypes (Supplementary Table 4). For Set2, probability of remaining untreated (progression-free) data were available (Supplementary Fig. 2). BTK-Low subtype required treatment in <4 years after diagnosis, while BTK-High cohort needed treatment in <2 years. The trend in time to treatment is similar as in Set1 (Fig. 1D), however Set2 data were not significantly different. In summary, gene expression data from previously treated or untreated CLL patients strongly segregated by the underlying BTK mRNA expression as two subtypes (BTK-Low, BTK-High).
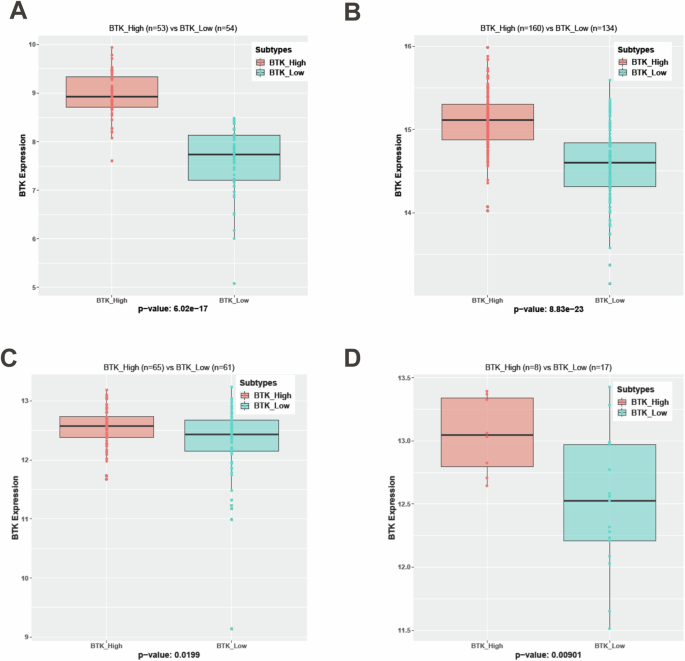
Normalization of expression data is performed using RMA and DESeq2 algorithms on Affymetrix microarray (Set2) and RNA sequencing (Set3, Set4, and Set5) datasets respectively. BTK subtypes are generated using the same consensus clustering methodology in other four cohorts. BTK subtypes in each of these cohorts are significantly associated (p < 0.05) with BTK mRNA Expression (A-Set2, B-Set3, C-Set4 and D-Set5).
Differential gene expression between BTK-High and BTK-Low subtypes
To identify transcripts associated with BTK-Low and BTK-High subtypes, we performed differential expression analyses in all five cohorts (Supplementary Fig. 3). There were significant numbers of differentially expressed genes in each of the cohorts, suggesting a clear distinction between the BTK based subtypes (Fig. 3A–E). However, the number of upregulated genes in BTK-High and BTK-Low vary among the cohorts as the underlying expression platforms used to profile data (RNAseq/Microarray) and tumor specimen type (TN/RR) were different. Common differentially expressed among all the cohorts were defined with lower significance threshold (FDR-0.1, log FC–0.25) considering the variability among expression cohorts (Supplementary Tables 5, 6). These genes were illustrated using Venn diagrams; a total of 75 and 128 genes that were upregulated in BTK-High and BTK-Low subtypes respectively (Fig. 3F). We analyzed if these 75 and 128 genes were associated with signature pathways in BTK-High and BTK-Low subtypes. While 75 genes did not associate with the molecular pathways, 128 genes upregulated in BTK-Low cohort were associated with TNF alpha signaling via NFkB, several inflammation related pathways; and apoptosis pathway (Supplementary Tables 7, 8) which were further identified in GSEA as described below.
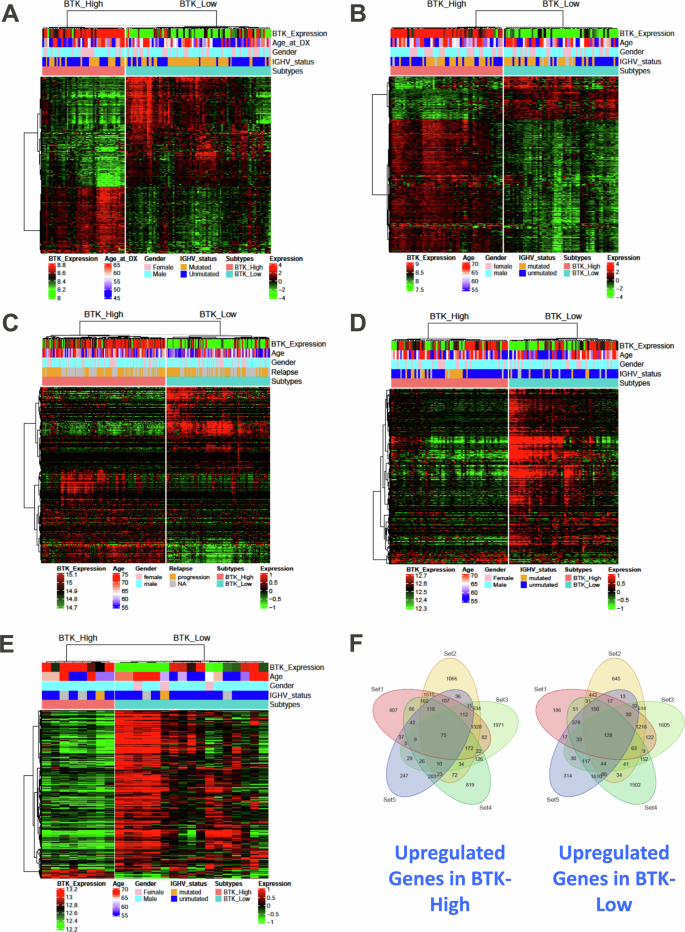
The differential expression analyses are performed between the BTK-High and BTK-Low subtypes across all five datasets separately. P-values obtained after multiple tests (Wald tests for RNAseq and t tests for microarrays) were adjusted using BH method. Heat maps are used to illustrate significant differentially expressing genes (FDR: 0.05, log2FC: 1) in each of the five datasets (A-Set1, B-Set2, C-Set3, D-Set4 and E-Set5). Common significant differentially expressing genes (FDR: 0.1, log2FC: 0.25) from all the sets are quantified. Venn diagram to show upregulated genes in BTK-High subtype and BTK-Low subtype (F).
Inflammatory response and proapoptotic pathways are enriched in BTK-Low subtype
As there are many genes that were significantly differentially expressed between BTK-Low and BTK-High cohorts (common and mutually exclusive), we decided to identify pathways associated with these genes. Among the Hallmark gene set-enrichment analyses, inflammatory response related pathways were significantly upregulated in the BTK-Low group. Specifically, inflammatory response pathway (Fig. 4A) and TNF-alpha signaling via NF-kB (Fig. 4B) were enriched in BTK-low subtypes in all the cohorts. The related pathways in KEGG were also enriched in all sets and were mostly significant between BTK-Low and BTK-High subtypes (Supplementary Fig. 4A–J). Rheumatoid arthritis gene set was higher in BTK-Low subtype and statistically significant in 4 of 5 datasets by ssGSEA score (Supplementary Fig. 5A–E). Similarly, RIG-1 or DDX 58 which is a sensor of RNA viral infection was also high in BTK-Low subtype in all five cohorts (Supplementary Fig. 6A–E).
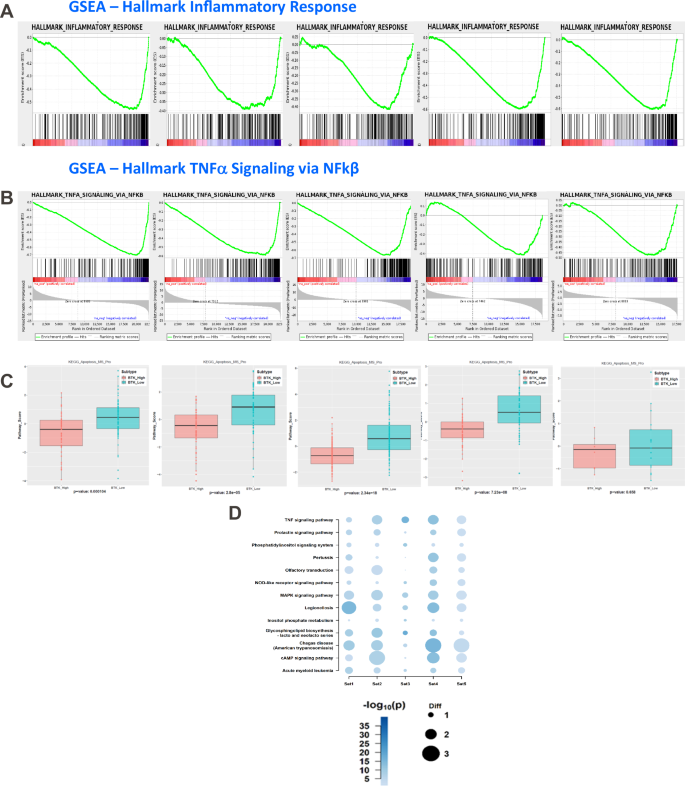
Gene Set Enrichment Analysis and Sample-level Gene set Score Analysis identified association of multiple pathways in the BTK-Low subtype. The enrichment plots from the corresponding GSEA are illustrated for Inflammatory response (A) and TNF-alpha signaling via NFkB (B) in all the datasets. Pro-apoptosis gene set is enriched in the BTK-Low compared to BTK-High subtypes among the CLL cohorts (C). KEGG pathways enriched in common (based on z-score) among multiple cohorts in BTK-Low subtype are illustrated in bubble chart (D).
Among the genes that are associated with apoptotic response, we separated pro- and anti-apoptotic genes (Supplementary Table 9). In all the 5 data sets, there was upregulated expression of proapoptotic gene set in BTK-Low subtype (Fig. 4C). To further evaluate pathways associated with BTK-Low expressing CLL patients, we summarized all the KEGG gene sets by z-score which are significantly higher in BTK-Low group. Among the top pathways enriched in BTK-Low subset in all 5 cohorts, prolactin, PI3K, JAK-STAT, NOD-like RTK, cAMP signaling and MAPK signaling pathways were included, further substantiating results of Hallmark Pathway analyses (Fig. 4D, Supplementary Fig. 7A–O).
BTK-High group was enriched in BCR pathway and had high DNA replication and DNA repair gene enrichment
We then explored enrichment of pathways in BTK-High cluster. This cluster was enriched in BCR pathway, however, that was more apparent in treatment naïve CLL (not shown). UGT2B17 gene has been previously shown to be associated with BTK [23]. In our studies in all 5 sets, there was increased expression of UGT2B17, which was significantly different in Set 1–3 (data not shown).
Both DNA replication (Fig. 5A) and DNA-repair pathways (Fig. 5B) were enriched in BTK-High subtype suggesting increased replication and repair in this group. To identify specific pathways, we summarized all the KEGG gene sets by z-score in BTK-High subtype (Fig. 5C). Nucleotide excision repair, non-homologous end-joining, mismatch repair, and homologous recombination were all enriched in all cohorts. Further, amino acid and protein metabolism and DNA replication pathways showed upregulation in all 5 sets in BTK-High group (Fig. 5C).
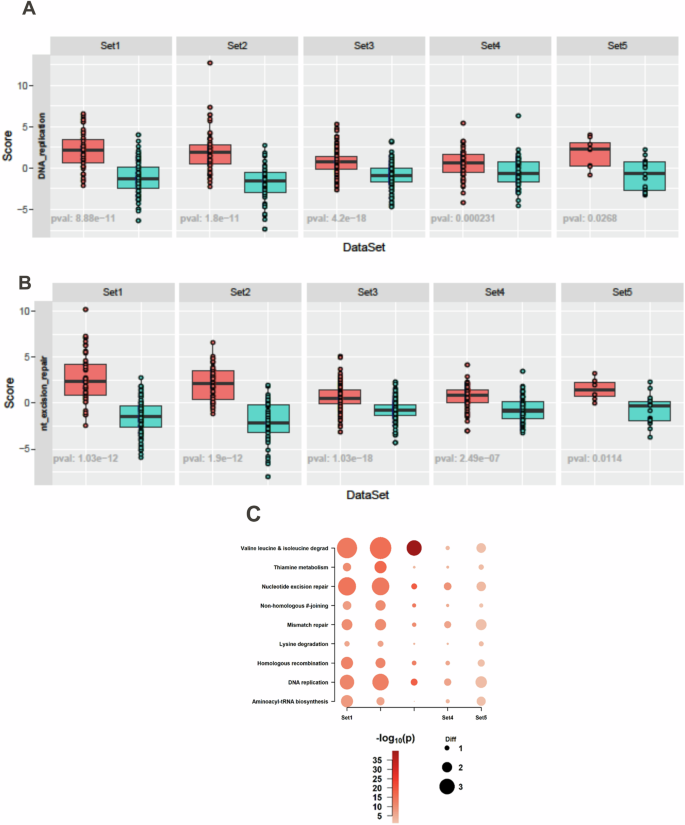
Gene-set Score Analysis identified enrichment of DNA replication (A) and nucleotide excision repair pathways (B) within the KEGG database in BTK-High subtype. KEGG pathways enriched in common (based on z-score) among multiple cohorts in BTK-High subtype are illustrated in bubble chart (C).
Proteomics data associate with BTK-Low and BTK-High CLL
In concert with mRNA data, BTK immunoblot (Supplementary Fig. 8), and quantitation (Fig. 6A) showed statistically significant association between BTK-Low and BTK-High clusters in the 5th dataset where we analyzed both transcriptomics and proteomics. There was a direct, linear, and significant relationship between BTK protein and mRNA levels representing strong correlation (Fig. 6B).
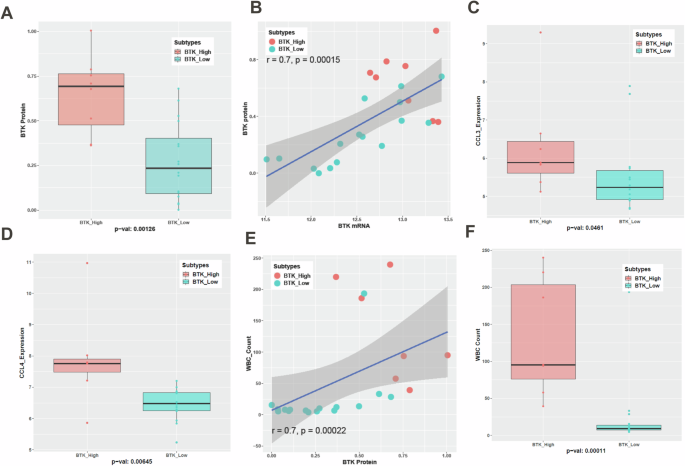
CLL lymphocytes from peripheral blood of 25 patients were isolated to measure basal levels of BTK protein. BTK protein levels (IHC) between BTK-Low and BTK-High subtypes are statistically significant (A). Spearman correlation is used to assess the association between BTK Protein and BTK mRNA and values are listed on the graph (B). Data points from BTK-Low are presented as turquoise blue symbols while data points from BTK-High are represented as red symbols. Plasma CCL3 (Mip-1α) and CCL4 (Mip-1β) levels were quantitated using enzyme-linked immunosorbent assay (ELISA). Their levels were significantly associated with BTK subtypes (C, D). White Blood Cell (WBC) counts in the peripheral blood were also quantified for this cohort. Spearman correlation is used to assess the association between BTK Protein and WBC counts (E). WBC counts are significantly different between the BTK subtypes (F).
Chemokines (CCL3 and CCL4) are considered biomarkers for CLL disease [24], proliferation of CLL cells, and reduced by BTK-inhibitor therapy [13, 25]. There was heterogeneity regarding total protein levels in plasma of these chemokines (Supplementary Fig. 9A–C) and both chemokines showed a trend of linear association with BTK protein level (Supplementary Fig. 9D, E). Importantly CCL3 (Fig. 6C) showed borderline significant difference while CCL4 (Fig. 6D) was significantly higher in BTK-High cluster. In concert with these data, total WBC counts in peripheral blood of these patients was correlated with the BTK protein, (Fig. 6E) BTK mRNA (Supplementary Fig. 10) and associated significantly in two clusters of BTK and was several-fold higher in BTK-High CLL subtype (Fig. 6F). Collectively, these data were in concordance with the transcriptomics data suggesting aggressive tumor growth and replication when BTK transcript and protein levels were high.
With this nosology of CLL, we compared proteins in the RPPA data between the two BTK subtypes (Fig. 7A). As observed for transcript levels, compared to BTK-High subgroup, inflammation associated proteins were upregulated in BTK-Low subgroup (Fig. 7B). Consistent with gene expression data, DNA damage response proteins were expressed at higher levels in BTK-High cluster (Fig. 7C). This may result in increased genotoxic damage in BTK-Low subtype which was consistent with enrichment of inflammatory response in this cohort. Additionally, low expression of DNA damage response proteins would lead to high H2AX phosphorylation in BTK-Low subgroup. This was observed with our data (first row Fig. 7C and Supplementary Fig. 11). Protein synthesis proteins were expressed at higher levels in BTK-High subgroup (Fig. 7D) which aligns with higher proliferation, replication, and greater WBC count in this cohort.
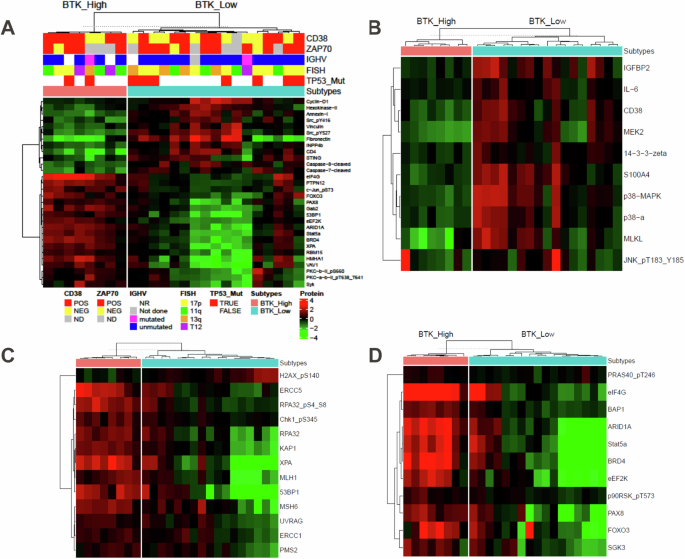
Differential protein expression analysis is performed between the BTK-High and BTK-Low subtypes in the RPPA dataset. P values obtained after multiple t tests were adjusted using BH method. Significant differentially expressing proteins (FDR: 0.05, log2FC: 1) are illustrated by heatmap (A). Further, differentially expressed proteins involved in inflammatory response (B), DNA repair (C), and protein synthesis (D) are illustrated in supervised heatmaps.
In concert with mRNA data of proapoptotic gene signature in BTK-Low, cleaved caspase-7 and caspase-8 were significantly higher in this subtype (Fig. 8A, B). Cells of BTK-Low subtype had higher protein expression of cyclin D1 and cyclin D3; both are G1-cell cycle proteins indicating higher G1 population i.e. non-proliferative fraction (Fig. 8C, D). Consistent with these observations, replication-related total and phospho-RPA32 was much higher in the BTK-High subtype (Fig. 8E, F). BCR pathway (phospho Src as negative regulator, and PKC beta downstream of BTK) was much lower in the BTK-Low cohort (Supplementary Fig. 12).
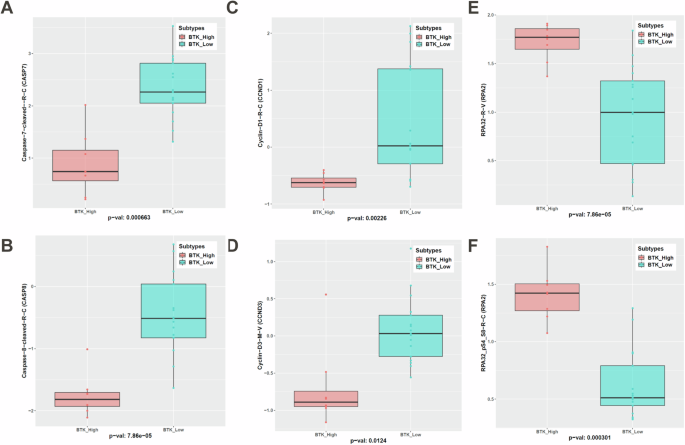
Significant differentially expressing proteins in the apoptosis pathway— caspase 7 (A) and caspase 8 (B), G1 cell cycle (Cyclin D1 (C) and Cyclin D3 (D)), and replication protein total RPA32 (E) and phospho-RPA32 (F) are shown.
Discussion
CLL outcomes have been stratified using several clinical and laboratory features such as disease staging systems (Rai and Binet); immunophenotyping including, ZAP70, and CD38; molecular genetics including del(13q), del(11q), del(17p), T12 and complex karyotype and genomics such as IGHV mutation status and mutations in TP53, ATM, and others [26,27,28]. Even with these features, time to treatment and survival of CLL patients is highly heterogeneous which underscores need for additional criteria to understand CLL biology and to treat the disease. To this end, several genomics databases are available for rigorous analyses to identify new measures. We initiated this work based on that premise.
Publicly available database from highly enriched CLL cells of 130 previously untreated patients [Set1 [9]], clearly and significantly (p = 1.39e–12) separated in two clusters that were associated with BTK transcript levels. Our analysis of this dataset was rigorous and unsupervised; the hierarchical clustering was repeated 10,000 times, taking 80% of subset of samples and genes for every iteration to generate robust consensus groups. Consensus clustering was performed on the normalized expression data using 5000 genes with the highest median absolute deviation (MAD). These two (BTK-Low and BTK-High) clusters showed clinical relevance as they were associated with treatment probability. Time-to-treatment was <2 years for BTK-High cohort while BTK-Low cohort did not require treatment for >6 years, which was significantly different. Time to treatment was not available for all sets, however we extended and validated BTK-expression-mediated subsets with other datasets, including previously treated CLL patients and more contemporary technology of RNAseq, data were validated in a total of 5 sets of CLL patients constituting ~700 patient samples. In all cases, consensus clustering identified two cohorts of patients based on BTK expression levels. Importantly, protein data not only corroborated with transcriptomics data but also shed some light on functional differences between these BTK-High and BTK-Low cohorts.
Our investigations were focused on omics data in CLL primary lymphocytes and differences in BTK-High and BTK-Low cohorts. Previously, when MEC-1 cell line with endogenous BTK was compared with MEC-1 cell line with over-expressed WT-BTK, we demonstrated increase in phospho-BTK, phospho-PLCy2, and phospho-ERK in cells with higher BTK levels. This was further stimulated with IgM in transduced cells. Growth-rate of these cells were not significantly different [29]. Such model systems need to be evaluated for omics and functional assays.
The BTK is a non-receptor tyrosine kinase, and the protein is an integral part of B-cell receptor (BCR) pathway and BCR nexus is responsible for proliferation, survival, migration, maturation and function of normal or malignant B-cells such as CLL cells [30,31,32,33]. Hence, separation of BTK-Low and BTK-High cohort is consistent with the role of BCR in CLL biology. Phospho-Src negatively regulates BCR pathway [34, 35] and this was upregulated in BTK-Low cohort. PKC-beta is a downstream molecule in the BCR pathway and was downregulated in BTK-Low subtype. As expected, the BCR signaling axis was higher in BTK-High cohort. As shown before [23], UGT2B17 was overexpressed in BTK high cohort which was significantly different in treatment-naïve groups, but other signaling pathways including JAK/STAT ad TNF-alpha [33] were highly expressed in BTK-Low cluster, suggesting reliance on non-BCR pathways.
The distal BCR pathway leads to activation of several transcription factors such as NFkB, a key factor in B-cells. CLL with high-BTK cohort may have augmented overall transcription in CLL cells. Our GSEA data suggested transcription pathway enrichment in the BTK-High group. Importantly, BTK-High cluster had increased transcription machinery genes. GO analysis [36] of common differential expressed genes that were upregulated in BTK-High or BTK-Low cohorts were consistent with function analyses based on pathway data (Supplementary Tables 4, 5). These data imply that the Low-BTK and High-BTK clusters are driven by different independent signal transduction pathways and accordingly could be treated differently. We further validated these observations using CLL proteome data.
BTK protein and transcript are synthesized and maintained in CLL cells and normal B cells through normal transcription. However, this transcription is dependent on active BCR pathway signaling that stimulates NFkB and other transcription factors that bind to the promoter of BTK and activate transcription [32]. Activation of BCR pathway is through antigen ligation. Some of the key components of this pathway were enriched in BTK-High subtype. Microenvironment especially in lymph node is shown to be responsible for activation of BCR pathway. B-cells show high levels of BTK protein when in contact with BM or lymph node in non-diseased mice [37, 38]. Conversely in diseased mice [39] or primary CLL cells, BTKi treatments result in decrease in the levels of BTK transcript and protein [40].
The role of BTK and BCR pathway was further established when covalent and non-covalent inhibitors of BTK were used in the clinic for patients with B-cell malignancies in general and CLL in particular. Among the covalent BTK inhibitors, three drugs have transformed treatment of B-cell malignancies. All three covalent BTKi, ibrutinib [25, 41], acalabrutinib [42], and zanubrutinib [43] are US-FDA approved. A long-term inhibition of BTK with these BTK inhibitors resulted in suppression of disease progression due to inhibition of B-cell proliferation, lymphocytosis and decline in lymph node size due to migration of cells from lymph node niches to peripheral blood [41,42,43], and transcription inhibition due to impact on BCR pathway signaling resulting in decrease in transcription factor-controlled transcription of early response genes such as BTK, PIM, and survival protein MCL-1 in mice [39] and humans [40, 44].
BTK-High and BTK-Low cohorts were associated with higher or lower score of GSE when tested for Hallmark replication pathway. While BCR pathway is expressed at a lower rate in BTK-Low cluster, these cells showed enrichment of other signaling pathways such as TNF signaling, prolactin and PI3K signaling, MAP kinase and NOD-like receptor signaling and cAMP signaling. BTK-Low subtype had low tumor burden which is consistent with high expression of proapoptotic genes as well as low enrichment of proliferation genes which may be responsible for cell death and low proliferation rate of these malignant cells. Both hallmark and KEGG pathways suggested lower DNA replication gene-enrichment in BTK-Low subgroup while higher enrichment in the BTK-High cohort which is consistent with its association with significantly higher or lower WBC counts in BTK-High and BTK-Low clusters, respectively (Fig. 6F).
In addition to replication, GSEA delineated that the BTK-High cohort had high DNA repair Hallmark-GSE. To further establish sample-wise pathway distribution among subtypes, we computed aggregate scores (GSVA) of all the gene sets in the KEGG pathway database. Among DNA repair genes, homologous recombination, mismatch repair, nucleotide excision repair, and non-homologous end-joining [45] suggested similar distribution i.e. expressed mostly in high-BTK cluster (Fig. 5B. C). This was not associated with del(11q) or ATM mutation (Supplementary Table 2), a well-known culprit for DNA repair in CLL. Absence of an efficient DNA damage response and DNA repair machinery may be responsible for high inflammatory response in this cohort, which was observed both in Hallmark and KEGG pathways (Fig. 4A, B, D). Consistent with the gene expression data, proteins associated with DNA damage response such as MLH1, MSH6, ERCC1 and 5, PMS2, Chk1, KAP1, and XPA were expressed at higher level in BTK-High subgroup compared to BTK-Low subgroup. DNA repair biomarker, i.e. phosphorylated H2AX was higher in BTK-Low subtype (Fig. 7C and Supplementary Fig. 10).
In contrast to replication and repair, genes for inflammatory response molecules were expressed mostly in BTK-Low cluster. In concert with DEGs, proteins belonging to these pathways were differentially expressed among subtypes. Inflammation-related proteins as well as proteins involved in glycolysis pathway were overexpressed in BTK-Low clusters. Lower DNA repair, increased DNA damage are consistent with high inflammation in BTK-Low cluster. Prospective studies need to evaluate increased incidences of second cancers in this subtype.
In conclusion, we describe unique consensus classification of CLL disease which is based on transcriptomic profile and is strongly associated with BTK gene expression levels. Protein profiling further validated this nosology. This is first report of such segregation and as such BTK-cluster subtypes provide precision therapeutic options. Our study demonstrated and reinforced the central role of BTK protein and BCR pathway in biology of CLL. This novel finding needs to be extended to a larger group in a prospective manner.
Responses