Transcriptomic profiles link corticostriatal microarchitecture to genetics of neurodevelopment and neuropsychiatric risks

Introduction
The macroscale cortical organization of microstructure in the adult brain is established by neurodevelopmental gradients, which arises from the temporal sequence of neurogenesis [1, 2]. For example, neurogenesis begins uniformly across the cortex but terminates earlier in rostral regions than in caudal regions [1]. Caudal regions undergo a greater number of neural cell cycles to form greater numbers of neurons in these areas, but neurons in rostral regions are devoted to growing larger to generate more connections [3]. This forms a spectrum of cognitive functions for the human brain [4]. Furthermore, dysregulation of neurogenesis results in changes in macroscale cortical organization [5], which ultimately affects several neuropsychiatric disorders [6], such as depression [7], bipolar disorder [8] and schizophrenia [9]. Advancements in high-throughput transcriptomes, which provide spatially distributed gene expression profiles, have also revealed a transcriptional architecture across the cerebral cortex [10, 11] that is closely linked to the macroscale cortical organization of anatomical properties [12]. Similarly, both functional magnetic resonance imaging (fMRI) and quantitative magnetic resonance imaging (qMRI) studies have indicated that hierarchical organizations are manifested in subcortical regions [13,14,15], particularly the striatum, and that the molecular-genetic properties dispersed throughout the striatum contribute to shaping these hierarchical organizations [16, 17]. However, existing studies linking gene expression to microstructural hierarchy have primarily focused on the cerebral cortex or the striatum, neglecting the microstructural relationships between the striatum and the cerebral cortex. The gene expression patterns observed in the corticostriatal networks demonstrated that within-network gene expression was more pronounced than expression outside of the network [18], suggesting the potential influence of transcriptional specialization on the microarchitecture of the corticostriatal network. Therefore, a fundamental question arises: is the microarchitecture of corticostriatal covariance shaped by transcriptomic specialization?
The human striatum, consisting of the caudate and putamen, receives extensive inputs from the cerebral cortex, generating corticostriatal projections that play crucial roles in learning, goal-directed behavior and movement [19,20,21]. Along the anatomical axes (anterior to posterior), different parts of the striatum exhibit variations in dopaminergic, GABAergic and cholinergic expression, as well as variations in tissue distribution [22,23,24], influencing a wide array of corticostriatal connections [25, 26]. Therefore, the striatum receives projections from hierarchical regions of the cortex along the anterior-posterior axes, with the dorsolateral striatum connecting to the sensorimotor cortex, the central striatum connecting to the associated cortex and the ventromedial striatum connecting to the ventromedial and orbital frontal cortex [13, 27, 28]. Studies combining MRI with gene expression profiles have emphasized that the structural hierarchical organization of the cortex is linked with spatial transcriptional profiles [12]. Additionally, genetic factors have been shown to have a significant impact on the corticostriatal circuit, as evidenced by common genetic variations contributing to subtle changes in striatal reactivity and associated behaviors [18, 29, 30]. Therefore, disruptions in the structural integrity of corticostriatal connections are believed to increase susceptibility to neuropsychiatric disorders, primarily stemming from genetic variations in genes linked to such conditions [31,32,33]. Hence, the corticostriatal microstructural architecture is needed for a comprehensive understanding of the underpinnings of neuropsychiatric disorders characterized by dysregulated corticostriatal circuits.
Here, we segmented the caudate and putamen into different parts along the anterior-posterior axes. Utilizing MRI-derived T1-weighted/T2-weighted (T1w/T2w) maps [34], we computed the microstructural covariance of each subregion with the cerebral cortex to identify the microstructural gradient of corticostriatal covariance. In parallel, we performed spatial correlation analysis between the microstructural gradient of corticostriatal covariance and cell type-specific gene expression data from the Allen Human Brain Atlas (AHBA) [10, 11] to explore the gradient of cortical microcircuit specialization. Considering that cortical and striatal structural organization is established during neurodevelopment processes, we hypothesized that the trajectory of corticostriatal microstructural covariance evolves across different stages of neurodevelopment. Therefore, we further evaluated spatiotemporal gene expression of corticostriatal microstructural covariance dynamics from prenatal to adulthood stages using a developmental genetic dataset from BrainSpan [35, 36]. Last, targeted spatial correlation analysis probed the transcriptomic associations for known pathogenic neuropsychiatric variants, such as depression, schizophrenia and bipolar disorder, to evaluate the neuropsychiatric risks related to corticostriatal circuits.
Methods
MRI dataset
T1w/T2w dataset
This study included data from 1206 healthy young adults (age range, 22 to 37 years) from the publicly released Human connectome project (HCP) Young Adult dataset (https://www.humanconnectome.org/study/hcp-young-adult) [37]. The subjects who meet the following the criteria such as history of psychiatric disorder, substance abuse, cardiovascular disease or any other severe health conditions were excluded in present study. In addition, the subjects who did not have high-resolution cortical T1W/T2W maps (0.7 mm3 isotropic) were removed from the current study. Finally, the 1113 subjects were remained in the following analyses. All procedures of this study were approved by the local institutional review board and the informed content were obtained from all subjects. The T1w, T2w and T1w/T2w maps for each subject were normalized to the MNI_ICBM152 standard space. Subsequently, T1w/T2w maps of the left hemisphere were parcellated into 180 areas using HCP multimodal parcellation [38] (HCP_MMP1.0). Subcortical segmentation for each subject was acquired based on a subcortical mask in the MNI_ICBM152 standard space. Furthermore, the T1w/T2w maps of the striatum were acquired by dividing the T1w image by the T2w image [34], resulting in a semiquantitative contrast that minimizes the shared bias of the weighted images.
Striatum segmentation
The caudate and putamen were segmented along the anterior-posterior axis using an automatic segmentation tool (https://github.com/MezerLab/mrGrad), with detailed procedures available in a recent study [15]. In this process, two hyperplanes were defined for the two extreme data points located at both ends of the anterior-posterior axis. These hyperplanes are perpendicular to the anterior-posterior axis, and the data are segmented by n-1 parallel hyperplanes equally spaced between two data edges (Supplementary Fig. 1A). Therefore, the caudate and putamen were segmented into n segments, and voxels were then assigned to each segmentation based on the distance from the hyperplanes. This study chose n = 7, which is consistent with a previous study [15].
Corticostriatal microstructural covariation
The corticostriatal microstructural covariation was calculated as the microstructural correlations between cortical regions and striatal subregions across a large cohort of 1113 subjects from the HCP dataset. Specifically, we calculated correlations across subjects between the T1w/T2w ratio of each segment of both the caudate and putamen and that of each cortical region (Supplementary Fig. 1B). The corticostriatal covariation matrix was normalized using the Fisher Z-transform. Therefore, we acquired a matrix of 7 corticostriatal covariations for each of the caudate and putamen along the anterior-posterior axis. Additionally, the HCP_MMP1.0 parcels were assigned to six functional networks [38]. Correlations across parcels within the same network were averaged based on the six functional networks.
Corticostriatal covariation associated with geodesic distance
We calculated the Euclidean distance between each cortical parcel and the polar frontal cortex. The coordinates of each cortical parcel were acquired from the website at https://neuroimaging-core-docs.readthedocs.io/en/latest/pages/atlases.html. Then, the spatial correlation between corticostriatal covariation and geodesic distance was calculated.
Gene expression data and preprocessing
We utilized left hemisphere microarray-based gene expression data from the Allen Human Brain Atlas [10, 11] (AHBA) (http://human.brain-map.org, RRID: SCR_007416). The microarray gene expression data were obtained from six donors (mean age: 42.5 years, 5 males and 1 female), including two complete brains and four left hemispheres. The gene expression of each sample from all donors was quantified across 58692 probes, resulting in 20,737 gene expression levels per sample. The gene expression data of the brain samples were preprocessed using an AHBA processing pipeline [39] (https://github.com/BMHLab/AHBAprocessing) with the recommended default setting. Next, each sample was assigned to its nearest cortical parcel of HCP_MMP1.0 parcellation (left hemisphere) with 180 parcels and striatal parcellation with 28 subregions. These procedures yielded 1290 cortical tissue samples covering 176 regions within the left cortex and 86 striatal tissue samples covering 26 regions within the striatum, with each sample containing the expression data of 10,027 genes.
Categorical gene sets
We conducted analyses of cell type-specific gene sets extracted from the existing neuroscientific literature. Genes with enriched expression in specific cell types were included in this study and were obtained from five single-cell studies of the human postnatal brain [40,41,42,43]. These cell type-specific genes were identified by Seidlitz [6] and are listed at https://static-content.springer.com/esm/art%3A10.1038%2Fs41467-020-17051-5/MediaObjects/41467_2020_17051_MOESM8_ESM.xlsx. Following the procedure of Seidlitz et al. [6], four cell types, namely, microglia (ngene = 1073), astrocytes (ngene = 1187), excitatory (ngene = 1270), and inhibitory neurons (ngene = 985), were selected for the present study.
Corticostriatal covariation associated with gene expression
We applied principal component analysis (PCA) to determine the dominant component of spatial variation in the transcriptional profiles of genes across the human cortex. For cell type-specific gene expression, we first performed PCA to acquire the dominant component and then calculated the correlations between this dominant component and each corticostriatal covariation of either the caudate or putamen along the anterior-posterior axis.
Cell type-specific transcriptomic difference analysis between anterior and posterior striatum
According to previous research on striatal segmentation [14], we categorized the first four striatal segmentations and the last three striatal segmentations as the anterior and posterior striatum, respectively. To further explore the differences in the transcriptomic signatures within the covariance of the anterior and posterior parts of the striatum across the human cortex, partial least squares (PLS) regression analysis [44] (https://github.com/KirstieJane/NSPN_WhitakerVertes_PNAS2016) was performed to investigate the spatial associations between the gene expression profiles and the anterior and posterior corticostriatal covariance, respectively. The first component of PLS (PLS-1) and second component of PLS (PLS-2) were calculated for both the anterior and posterior striatum. The detailed PLS regression analysis is provided in Supplementary methods. The top 10% of PLS genes from either the anterior or posterior striatum that overlapped with cell type-specific genes were analyzed, followed by a comparison of the overlapping gene numbers between the anterior and posterior striatum.
Gene enrichment analysis
The top 10th percentile of 10,027 ranked genes was analyzed using a web-based gene set analysis toolkit34 [45] (https://www.webgestalt.org) to uncover biological processes enriched in the list of genes. The enrichment ratio was calculated as the number of PLS-derived genes overlapping with each biological process or disease risk gene divided by the expected number of overlapping genes through random permutations. Significant enrichment was determined based on Bonferroni FDR correction with q < 0.05.
Spatiotemporal gene expression profiles
Here, we used the PsychENCODE BrainSpan dataset [35, 36] to calculate the spatiotemporal profile for each PLS component of either the bilateral caudate or putamen obtained in the PLS regression analysis. BrainSpan is a gene expression database of brain tissue across development (https://www.brainspan.org/static/download.html) covering the period from 8 postconception weeks to 40 years of age. The ages were binned into nine-time windows (W1 to W9), encompassing the embryonic period, fetal development, infancy, childhood, adolescence, and adulthood. The detailed information is available in a previous study [35]. In the current analysis, we used the gene expression data from 16 cortical regions across all nine-time windows to calculate the spatiotemporal profile. This profile is defined as the regional average of each BrainSpan gene expression level, weighted by its PLS analysis-defined weights.
Neuropsychiatric risks related to corticostriatal neurocircuits
We performed Pearson correlation analysis between corticostriatal covariance and gene expression related to neuropsychiatric disorders such as depression and schizophrenia to identify the neuropsychiatric risks associated with corticostriatal neurocircuits. The neuropsychiatric risk genes were provided by the AHBA (https://help.brain-map.org/display/humanbrain/Documentation). For each neuropsychiatric disorder, we applied PCA to determine the dominant component of spatial variation in the transcriptional profiles of genes across the striatum. Then, a 1 × 26-dimensional vector of microstructural covariance from each cortical parcel to the striatum (1 representing each cerebral parcel and 26 representing 26 out of the total number of striatal subregions) was employed for correlation analysis with gene expression profiles in the striatum (including 28 subregions, with 2 subregions excluded due to a lack of brain tissue samples). This process yielded a correlation coefficient (R) and a P value for each cortical parcel. The significance level was set using the false discovery rate (FDR) method for multiple comparisons corrections.
Furthermore, we used two fMRI datasets (see Supplementary methods) to validate the corticostriatal circuits involved in neuropsychiatric disorders. We first calculated the correlation between the time series of each striatal subregion and that in each parcel of the cerebral cortex to construct the functional connectivity (FC) matrix. Then, we extracted the FC related to the corticostriatal circuits of patients with neuropsychiatric disorders (FC_CSN) from the FC matrix as features. These features were then applied to support vector machine (SVM) classification (https://www.csie.ntu.edu.tw/~cjlin/libsvm/) to distinguish patients with neuropsychiatric disorders from healthy controls. Here, we opted for a linear function kernel for the SVM model and employed a grid search function to determine the optimal cost parameter (C) for the SVM hyperparameters. The performance of the SVM model was evaluated using a 10-fold cross-validation strategy, where the data were divided into 10 partitions. The SVM model was trained using data from 9 partitions and tested on the remaining partition, and this process was repeated 10 times. The final performance assessment was determined by combining the results from these 10 models, and accuracy was calculated based on the correct labeling assessments. Additionally, we randomly selected training features with the same dimensions as FC_CSN to retrain the SVM classification. This procedure was repeated 1000 times to generate a null distribution of accuracy. The observed accuracy was then compared with the null distribution to ascertain whether the corticostriatal circuits associated with neuropsychiatric disorders are influenced by random effects and/or confounding factors.
Split-half validation analysis
To assess the stability of the microstructural gradient of corticostriatal covariance, we randomly split the data into two equal parts. We compared the similarity of the pattern of corticostriatal covariance between two randomly split-half groups.
Statistical analyses
The spatial correlations between the pattern of corticostriatal covariance and geodesic distance and cell specific-type gene expression profiles were determined using Pearson correlation analysis, and the spin test (https://github.com/spin-test/spin-test) with spatial autocorrection correction (10,000 times) was used to determine the statistical significance. The similarity in corticostriatal covariance patterns between two randomly split-half groups was assessed using Pearson correlation analysis, with statistical significance determined through the spin test. The differences in the number of overlapping genes between the anterior and posterior striatum were assessed using permutation tests (10,000 times). To examine whether the corticostriatal neurocircuits are significantly related to neuropsychiatric risk in SVM analysis, the observed accuracy was compared using a permutation test (1000 times). A two-tailed P < 0.05 after FDR correction for multiple comparisons or correlations was considered significant for all analyses.
Results
Microstructural gradient of corticostriatal covariance
The anterior parts of the caudate and putamen demonstrated significant positive correlations with the frontal and anterior temporal cortex but exhibited significant negative correlations with posterior cortical regions, including the sensorimotor and visual cortex (Supplementary Fig. 2). The strength of corticostriatal covariance is decreased along anterior-posterior axis of the striatum (Supplementary Fig. 2). Moreover, we further parcellated the T1w/T2w map into six networks (Fig. 1A) and calculated the covariance between each network and each subregion of the striatum. We also found that the strength of corticostriatal covariance is attenuated along the anterior-posterior axis of the striatum across human cortical areas, especially the anterior, posterior and visual cortices (Fig. 1B, Supplementary Table 1).

A Six functional networks were defined along anterior-posterior axis of the cortex. B Covariance gradients along anterior-posterior axis of the striatum within 6 cortical networks. Black-to-yellow color represents the location of each network along the cortical anterior-to-posterior axis. C Profiles of corticostriatal microstructural covariance gradient are associated with geodesic distance along anterior-posterior axis of striatum. LCAU left caudate, RCAU right caudate, LPUT left putamen, RPUT right putamen.
To assess whether corticostriatal covariance can capture anatomical hierarchical properties, we performed a spatial correlation analysis between corticostriatal covariance and a geodesic distance map from the most anterior frontal cortex, which defines an anterior-posterior gradient. We revealed strong correlations between the corticostriatal covariance of the anterior parts of striatum and the geodesic distance map. However, the strength of the correlations is gradually attenuated along the anterior-posterior axis of the striatum (Fig. 1C and Supplementary Table 2).
Corticostriatal covariance relates to cell type-specific gene expression profiles
Here, the cell type-specific gene expression profiles, defined as the first principal component (PC1) of the cell type-specific gene expression (Fig. 2A), was further subjected to spatial correlation analysis with a map of corticostriatal covariance. Notably, corticostriatal covariance was negatively correlated with the gene expression profile across all genes, which decreased along the anterior-posterior axis of the striatum (Fig. 2B and Supplementary Table 3). This pattern was also evident in the gene sets of excitatory and inhibitory neurons (Fig. 2C and Supplementary Table 3). However, the corticostriatal covariance was positively correlated with the gene expression profiles of astrocytes and microglia, which similarly diminished along the anterior-posterior axis of the striatum (Fig. 2C and Supplementary Table 3).
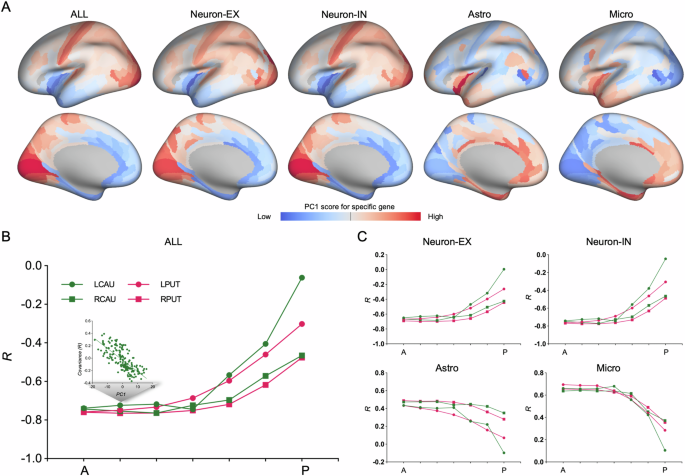
A PC1, here for describing a set of cell type-specific gene expression profiles, is the areal map that linearly captures the maximum variation in gene expression. B Profiles of corticostriatal microstructural covariance gradient are associated with gene expression profiles of the whole genes along anterior-posterior axis of striatum. C Profiles of corticostriatal microstructural covariance gradient are associated with cell type-specific gene expression profiles along anterior-posterior axis of striatum. ALL gene expression profile of the whole genes, Neuro-EX gene expression profile of excitatory neurons genes, Neuro-IN gene expression profile of inhibitory neurons genes, Micro gene expression profile of microglia genes, Astro gene expression profile of astrocytes genes, LCAU left caudate, RCAU right caudate, LPUT left putamen, RPUT right putamen.
Transcriptomic specialization differs between anterior and posterior corticostriatal covariance
For anterior and posterior striatum, two PLS components explained of the covariance between the microstructural covariance and gene expression are statistical significance when compared with 10,000 randomly permutations of the response variables (Supplementary Fig. 3). The top 10% of PLS-1 genes that overlapped with excitatory neuron genes exhibited significant differences between the anterior and posterior parts of the left caudate (P < 0.001), right caudate (P < 0.001) and left putamen (P = 0.039, Fig. 3A and Supplementary Table 4). The top 10% of genes of PLS-2 that overlapped with cell type-specific genes showed significant differences between the anterior and posterior parts of the left caudate (astrocytes: P < 0.001; excitatory neuron: P < 0.001), right caudate (astrocytes: P < 0.001; microglia: P = 0.025; inhibitory neuron: P < 0.001), left putamen (astrocytes: P < 0.001; excitatory neuron: P = 0.015,) and right putamen (astrocytes: P < 0.001; excitatory neuron: P < 0.001, Fig. 3B and Supplementary Table 4).
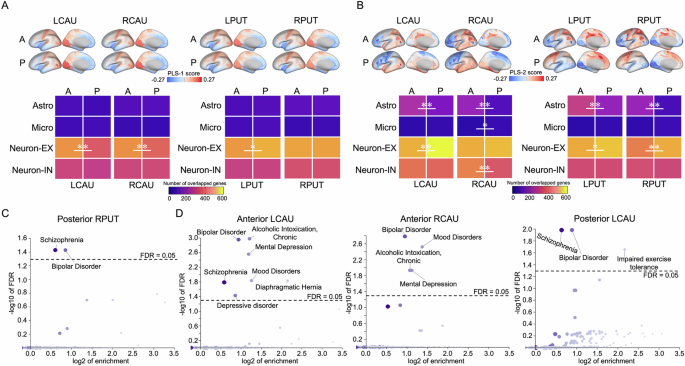
The number of overlapped genes were defined as that cell type-specific gene are overlapped with top 10% genes of PLS-1 and PLS-2. The difference in the number of overlapped genes between anterior and posterior striatum for each cell type-specific genes was analyzed using permutation test (10,000 times). A Cell type-specific transcriptional variations of PLS-1. Top: gene expression of PLS-1; Bottom: The number of overlapped genes differs between anterior and posterior striatum. B Cell type-specific transcriptional variations of PLS-2. Top: gene expression of PLS-2; Bottom: The number of overlapped genes differs between anterior and posterior striatum. C PLS-1 of posterior RPUT is enriched in neuropsychiatric risks. The dotted lines indicate FDR = 0.05. D PLS-2 of anterior LCAU and RCAU and posterior LCAU are enriched in neuropsychiatric risks. The dotted lines indicate FDR = 0.05. All permutated P values were adjusted by FDR, and were determined based on one-sided tests. *, P < 0.05; **, P < 0.01. LCAU left caudate, RCAU right caudate, LPUT left putamen, RPUT right putamen.
Enrichment in risk genes
Furthermore, PLS-1 for the posterior right putamen was enriched for risk genes related to schizophrenia and bipolar disorder (FDR < 0.05, Fig. 3C). PLS-2 for the caudate exhibited enrichment for risk disease genes, including those related to schizophrenia, bipolar disorder, mental depression, depressive disorders, mood disorders and alcoholic intoxication (FDR < 0.05, Fig. 3D).
Enrichment in biological processes
For biological signatures, PLS-1 for the anterior striatum was mainly involved in ion transport, transmembrane transport and cation transport. However, PLS-1 in the posterior striatum was not only engaged in ion transport and transmembrane transport but also associated with the regulation of neurotransmitter levels and chemical synaptic transmission (FDR < 0.05, Supplementary Fig. 4). PLS-2 in the anterior striatum was primarily involved in behavior, synaptic signaling, learning or memory and chemical synaptic transmission, whereas PLS-2 in the posterior striatum was primarily associated with the regulation of transport, transsynaptic signaling and neurodevelopment (FDR < 0.05, Supplementary Fig. 5).
Spatiotemporal trajectories of transcriptomic signatures in corticostriatal covariance
For PLS-1, the weighted gene expression decreased during embryonic and early to middle fetal ages (W1-W3), followed by an increase across late fetal ages (W4-W5) and subsequent stages of late childhood (W6-W7), adolescence (W8) and adulthood (W9). This revealed a cup-shape and signature of transcriptomic development for corticostriatal covariance (Fig. 4). For the anterior caudate and the anterior and posterior putamen, PLS-2 weighted gene expression decreased during embryonic and early to middle fetal ages (W1-W3), followed by an increase from late fetal ages to late childhood (W4-W7) and a subsequent decrease from late adolescence to adulthood (W8-W9), exhibiting an S-shaped pattern in brain development (Fig. 4). Moreover, for the posterior caudate, PLS-2 weighted gene expression decreased across the whole development stage (W1-W9, Fig. 4A, B).
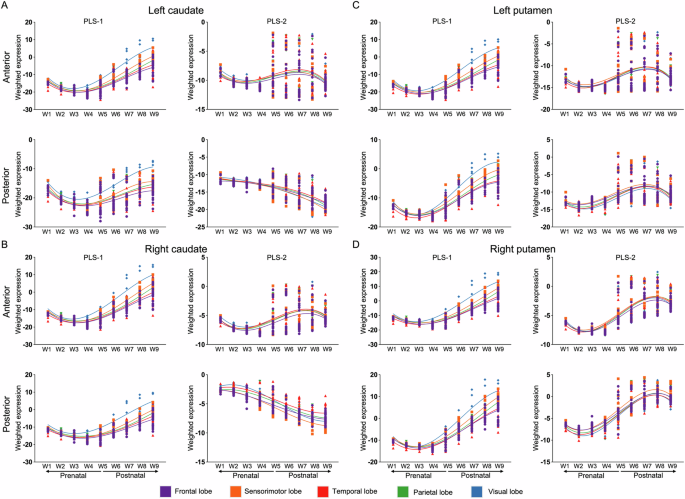
A Developmental spatiotemporal trajectory for left caudate. B Developmental spatiotemporal trajectory for right caudate. C Developmental spatiotemporal trajectory for left putamen. D Developmental spatiotemporal trajectory for right putamen. Dots represent cortical samples at a given time point colour-coded by lobes; The coloured lines are the third order polynomial regression across time window, thereby showing the overall trajectory.
Corticostriatal circuits related to neuropsychiatric risks
We observed that the pathway from the medial frontal cortex to the striatum was positively correlated with depression (Fig. 5A) and bipolar disorder (Fig. 5C) gene expression, while the pathway was negatively correlated with schizophrenia gene expression (Fig. 5B). Moreover, the pathways from the limbic and visual cortex to the striatum were negatively correlated with depression (Fig. 5A) and bipolar disorder (Fig. 5C) gene expression, while these pathways were positively correlated with schizophrenia gene expression (Fig. 5B). These findings demonstrated that pathways from the medial frontal, limbic and visual cortex to the striatum were involved in neuropsychiatric risks.
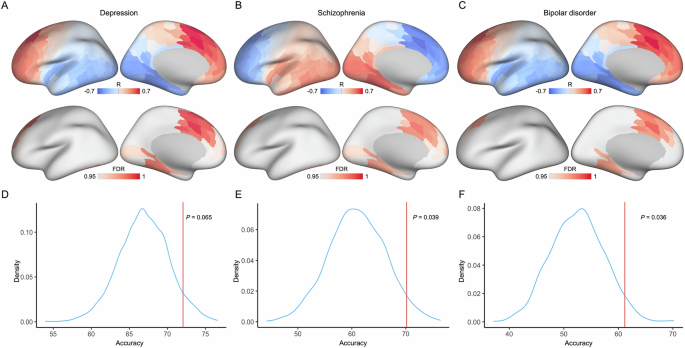
The genetic correlation profile between striatum and the cortex shows that pathways from medial frontal and limbic cortex to striatum significantly relate to depression A, schizophrenia B and bipolar disorder C. The statistical significance is considered as P < 0.05 after FDR corrected. The corticostriatal circuits are validated using SVM classification model, and the classification accuracy is compared with null model for depression D, schizophrenia E and bipolar disorder F. The null model generated using a randomly permutation procedure (1000 times).
Furthermore, we utilized two fMRI datasets (including depression, schizophrenia and bipolar disorder) to validate the corticostriatal circuits using SVM analysis. We found that the classification accuracy of depression was 72.2%, which was not significantly different (P = 0.065) from that of the null distribution (Fig. 5D). For schizophrenia patients, the accuracy was 70.2%, which was significant compared with the null distribution (P = 0.039, Fig. 5E). Moreover, the accuracy for detecting bipolar disorder was 61.36%, which was significant compared with the null distribution (P = 0.036, Fig. 5F). These findings indicated that the corticostriatal circuits obtained from gene expression analysis were related to neuropsychiatric risks.
Split-half validation
We observed a high degree of similarity in the pattern of the anterior parts of the striatum between the two randomly groups, while we noted a decrease in similarity in the posterior parts of the striatum (Supplementary Fig. 6 and Supplementary Table 5). Specifically, for the putamen, the pattern of microstructural covariance exhibited significant similarity between the two groups in both the left (spatial correlation range: 0.821–0.942) and right (spatial correlation range: 0.907–0.961) anterior parts and not showed a distinct decrease in both the left (spatial correlation range: 0.788–0.874) and right posterior parts (spatial correlation range: 0.903–0.909). For the caudate, the pattern of microstructural covariance displayed significant similarity between the two groups in both the left (spatial correlation range: 0.836–0.955) and right (spatial correlation range: 0.888–0.966) anterior parts but exhibited a rapid decrease in both the left (spatial correlation range: 0.266–0.623) and right (spatial correlation range: 0.322–0.837) posterior parts.
Discussion
Taken together, our findings reveal a microstructural gradient of corticostriatal covariance that potentially underlies the functional specialization of corticostriatal neurocircuits. First, the corticostriatal microstructural covariance derived from the T1w/T2w map provides a microstructural gradient along the anterior-posterior axis of the striatum. Second, the anterior parts of the corticostriatal microarchitecture highly align with anatomic properties and the cell type-specific gene expression profiles across the human cortex, whereas these relationships diminish rapidly in posterior parts of the corticostriatal hierarchy. Third, the notable transcriptomic distinctions between the anterior and posterior parts of corticostriatal microstructural covariance indicate the critical roles of microstructural gradients in the specific functions of corticostriatal networks. The spatiotemporal trajectories of transcriptomic signatures revealed that corticostriatal neurocircuits are affected by neurodevelopment. Additionally, the concordance between transcriptomic-level analyses and fMRI assessments suggests that corticostriatal neurocircuits are implicated in neuropsychiatric risks.
Recent MRI study have reported that the myelin content in the striatum shows a spatial gradient along the anterior-posterior axis, showing associations with cortical hierarchy demonstrated by corticostriatal microstructural covariation [15]. This finding is consistent with our observations that the myelin content in the anterior part of the striatum highly covaried with that in anterior parts of the cerebral cortex, such as the prefrontal, insular and limbic cortex. However, this covarying relationship attenuated in the posterior part of the striatum. Indeed, the myelin content in the human cortex follows a rostrocaudal gradient, indicating that the anterior cortex exhibits lower myelin content and more complex intracortical circuits [46]. This finding suggested that the anterior striatum is more likely to structurally connect to the anterior cortex, which supports functional specialization in the human brain. Notably, task fMRI studies have reported that the dorsomedial striatum, which is enhanced with rostrocaudal hierarchical organization within the lateral prefrontal cortex, supports increased levels of cognitive processing [47]. Furthermore, resting-state functional connectivity studies recapitulated the striatal functional hierarchy, indicating that the striatum contributes to processing motor, limbic, and heteromodal information through multiple large-scale corticostriatal circuits [13]. We also revealed that the patterns of corticostriatal microstructural covariation show gradient associations with cortical geodesic distance, demonstrating that gradient of corticostriatal microarchitecture may be constrained in anatomic properties. Thus, these findings suggest that the corticostriatal microarchitecture depends on human anatomic properties and could potentially play a significant role in shaping cognitive behaviors in humans.
The specific function of the corticostriatal circuitry may derive from neural projections between the cortex and striatum. For instance, excitatory neurons projecting to the striatum are predominantly located in the sensorimotor, associative and limbic cortical regions and play roles in motor functions, sensory processing and reward pathways [48,49,50]. Cerebral inhibitory interneurons can also shape corticostriatal function via synaptic connectivity [51], such that GABAergic interneurons in primates can establish long-range corticostriatal projections to affect physiological function [52]. On the other hand, the neural pathway from the prefrontal cortex to the dorsal striatum has been implicated in inhibitory control, suggesting a potential role in mediating cognitive behavioral control [53]. In the present study, we found that the anterior parts of corticostriatal covariance are positively correlated with the cell type-specific gene expression profiles, such as excitatory and inhibitory neurons. Thus, the present findings provide evidence that excitatory and inhibitory neurons may positively regulate corticostriatal pathways at the genetic level. Notably, we also observed that the anterior parts of corticostriatal covariance are negatively associated with the gene expression of astrocytes and microglia, indicating that these specific cell types may negatively mediate cortical architecture via corticostriatal circuitry. Consistent with our findings, a previous study reported that astrocytes are a potential source of new neurons in the adult mammalian brain and may engage in a neurogenic program to provide excitatory input to the striatal circuitry [54]. In addition, microglial neurons have been suggested to be involved in the regulation of ongoing structural and functional processes though corticostriatal neural circuits [55]. Therefore, these findings suggested that cell type-specific neurons shape specific functions and contributes to the formation of hierarchical gradients in corticostriatal connectivity.
Distinct compartments of striatal tissue exhibit variations in dopaminergic and cholinergic expression along the main axes of the striatum [22,23,24], which are believed to underlie the organization of striatal connectivity [23, 56, 57]. Remarkably, our PLS analysis revealed significant differences in transcriptomic specialization, particularly in gene expression among excitatory, astrocytic, and inhibitory neurons, between the anterior and posterior striatum. These differences may explain why differences in neural projections along the anterior-posterior axis of the striatum are responsible for different aspects of human behaviors [58] and brain diseases [59]. In addition, PLS-1 in both the anterior and posterior striatum was mainly involved in ion transport and transmembrane transport, while PLS-1 in the posterior striatum was also related to the regulation of neurotransmitter levels and chemical synaptic transmission. Ion transport plays a critical role in maintaining ion homeostasis in the human body [60] and is implicated in neuropsychiatric disorders [61,62,63]. Dysfunctions in neurotransmitter regulation and chemical synaptic transmission in the brain are also considered to affect cognitive function in humans [64, 65]. For PLS-2, transcriptional specializations in the anterior striatum are primarily involved in behavior, synaptic signals, learning or memory, whereas those in the posterior striatum are mostly related to the regulation of transport, transsynaptic signaling and neurodevelopment. Our results further underscored the enrichment of both PLS-1 and PLS-2 in neuropsychiatric conditions, including schizophrenia, bipolar disorder, depressive disorders and mood disorders. Additionally, neural pathways from the medial frontal and limbic cortex to the striatum have been found to be associated with neuropsychiatric risks, such as depression, schizophrenia and bipolar disorders, as supported by both transcriptional correlation and fMRI analyses in the present study. Overall, these findings confirmed that circuits originating from distinct compartments of the striatum to the cerebral cortex may contribute to different functions and affect neuropsychiatric diseases.
The structural development of the brain extends into adulthood, followed by gradual aging of both cortical and subcortical structures [66]. Interindividual differences in brain development, particularly during periods from childhood to adulthood, have been linked to cognitive function [67, 68] and the risk of neuropsychiatric diseases [66, 69, 70]. Moreover, advancements in myelin-sensitive MRI study have revealed that the psychiatric traits of compulsivity and impulsivity are associated with attenuated developmental fronto-striatal myelination trajectories [71]. Task fMRI studies have also shown that the development of corticostriatal connectivity is associated with cognitive behaviors, such as goal-directed and reward-driven behaviors [72, 73]. Our findings illustrated both PLS-1 and PLS-2 weighted gene expression changes during neurodevelopment, revealing the spatiotemporal trajectories of transcriptomic signatures in corticostriatal microstructural covariance. Specifically, the analysis of PLS-1 weighted gene expression revealed a developmental cup-shaped pattern. This discovery aligns with a functional genomic analysis of human brain development which proposed a cup-shaped pattern of interregional transcriptomic variances [35]. Moreover, it is intriguing to note that PLS-2 weighted gene expression decreases in both the left and right posterior caudate throughout neurodevelopment, which diverges from the S-shaped pattern observed in other parts of the striatum. Previous studies have suggested that neurodevelopment in the anterior part of the caudate nucleus may begin earlier than in other brain regions, which undergo rapid growth and differentiation in the early stages of development. In contrast, neurodevelopment in the posterior part of the caudate nucleus may be slower and more prolonged [74, 75]. Thus, PLS-2 weighted gene expression may explain the difference in neurogenesis between the anterior and posterior caudate. Taken together, these findings collectively suggested that corticostriatal circuits may be influenced by interregional transcriptomic differences and may play a role in neuropsychiatric risk during the course of human brain development.
Several limitations of the present study should be noted. First, the current findings are based on small samples of donor brains. More comprehensive microarray gene expression datasets are necessary for future studies to ensure a more robust and reliable understanding of the genetic underpinnings of the observed phenomena. Second, spatiotemporal trajectories of corticostriatal microstructural covariance were analyzed based on BrainSpan data, which are limited by small cortical genetic samples. Last, in the split-half validation analysis, large deviations were observed between two random groups in the posterior caudate, possibly due to the extremely attenuated covarying relationships between the posterior striatum and the entire cerebral cortex compared to the anterior striatum. Thus, resting-state fMRI data should be used to further validate this phenomenon in future studies.
In summary, our study revealed a microstructural gradient in corticostriatal covariance. By utilizing cell type-specific transcriptomic profile data, we illustrated that the corticostriatal circuits is influenced by transcriptomic specialization, undergoes alterations during neurodevelopment, and ultimately plays a role in neuropsychiatric risks. These collective findings underscore the potential mechanism by which alterations in the microstructural gradient of the corticostriatal network during neurodevelopment may be associated with neuropsychiatric risks.


Responses