Transcutaneous auricular vagus nerve stimulation improves cortical functional topological properties and intracortical facilitation in patients with Parkinson’s disease
Introduction
Parkinson’s disease (PD), a threatening neurodegenerative disorder, causes severe disabilities and conveys a rapidly increasing socioeconomic burden1. Motor symptoms, including rigidity, progressive asymmetric bradykinesia, tremor, and gait disturbance, are the core clinical manifestations of PD and challenges to be faced in treating PD2. Currently, dopamine replacement therapy remains the pivot for alleviating PD motor symptoms, but its limitations cannot be ignored, such as inducing motor fluctuations and dyskinetic movements, limited therapeutic effect on PD non-motor symptoms, and no impact on the rate of disease progression2. Thus, it is imperative to find new alternative treatment strategies for PD.
Non-pharmacological alternatives, such as electrical stimulation, primarily used as a supplementary therapy, have garnered significant attention. Vagus nerve stimulation (VNS), a well-established neurostimulation therapy used in epilepsy3 and depression4, has attracted researchers’ interest in treating PD5,6,7,8,9,10,11,12,13,14. Recently, a succession of animal experiments uncovered that cervical or auricular VNS could effectively improve the motor function of PD model rats15,16,17,18,19. Two independent preliminary studies also demonstrated that transcutaneous auricular vagus nerve stimulation (taVNS), which stimulates the afferent auricular branch of the vagus nerve through the ear’s surface, could enhance walking ability in PD patients without surgical intervention6,14, suggesting that taVNS was a promising and safe10 neural modulation tool in PD. Although our previous research has preliminarily explored the neural mechanism of taVNS regulating PD gait6, the neuropathological underpinnings of taVNS regulating PD motor disorders remain poorly understood.
Compelling evidence confirmed that taVNS could transmit regulatory signals upwards through the nucleus tractus solitarius (NTS) and locus coeruleus (LC), thereby triggering diffuse changes in cortical BOLD signal response and excitability20,21. Moreover, a recent study utilizing transcranial magnetic stimulation (TMS) evaluation has found that taVNS can regulate cortical facilitation in the primary motor cortex (M1) of healthy individuals22. Intriguingly, motor deficits have been consistently linked to alterations in the neural activity of the motor cortex, both in PD animal models and patients23. Furthermore, the steady-state excitability of the M1 is the crucial regulator of cortical motor output23. Hence, we speculated that taVNS could ameliorate PD motor disorders by remodeling abnormal excitability in the M1.
Functional near‐infrared spectroscopy (fNIRS) is a neuroimaging technique that can capture cortical BOLD signal response with high temporal resolution to inspect brain activation, which has been widely used in discovering brain mechanisms in neurological and psychiatric disorders24,25. Meanwhile, with advances in graph theory, growing studies have integrated resting-state fNIRS with graph-based network theory analysis to decode the characteristics of brain network functional topological properties in various diseases26,27,28,29. Besides, TMS can noninvasively assess the inhibition and facilitation of intracortical neural activities through different protocols30. We used fNIRS and TMS to investigate the underlying neuropathological mechanisms of taVNS in treating PD patients, focusing on the topological properties of cortical functional networks and cortical excitability.
Results
Demographic and clinical characteristics
Table 1 shows the demographics and clinical outcomes of the participants. One PD patient lost follow-up due to poor compliance, and another PD patient had poor-quality fNIRS data. Consequently, their data was excluded from further analysis, leaving 30 PD patients and 20 healthy controls (HCs). Overall, PD patients had mild to moderate disease severity, were not severely cognitively impaired, and had no emotional disorders. Meanwhile, all groups of participants were well-matched at baseline. Moreover, compared with the sham stimulation group (SS) group, PD patients in the real taVNS stimulation group (RS) group showed more significantly decreased ΔUnified Parkinson’s Disease Rating Scale section III (UPDRS-III) scores, indicating that taVNS treatment improved PD motor deficits (Table 1).
Differences between PD and HCs
Cortical functional network topology analyses
Small-world network characteristics of cortical functional networks were confirmed in PD and HCs using fNIRS. For global parameters, we found no significant difference in small-worldness (Sigma), global efficiency (Eg), and local efficiency (Eloc) between PD and HCs (Fig. 1A–C and Supplementary Table 2). At the nodal level, PD patients exhibited significantly decreased Ne values in the CH32 (p = 0.000008 <0.05/63, corresponding to the right M1, Fig. 1D, F and Supplementary Table 2) and increased Ne values in the CH40 (p = 0.0000000788 <0.05/63, corresponding to the left pre‐motor area and supplementary motor area, Fig. 1E, F and Supplementary Table 2). Moreover, partial correlation analysis showed a negative correlation between Ne values in the CH32 and UPDRS-III scores in PD patients (r = −0.420, p = 0.046, Fig. 1G). Besides, a negative correlation trend was observed between Ne values in the CH40 and UPDRS-III scores (r = −0.317, p = 0.186, Fig. 1H).
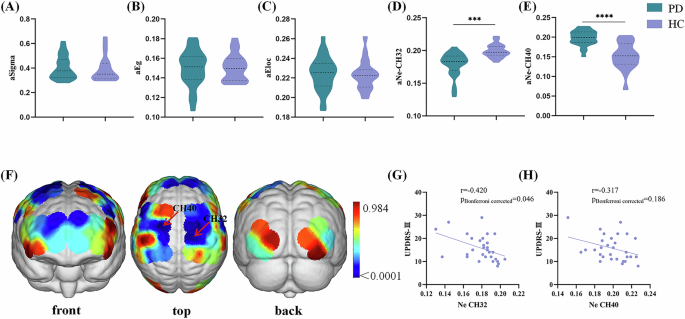
A–C Difference of global parameters between PD and HCs. Violin chart in which dotted lines represent the median and quartile, respectively. No significant difference was found in Sigmma, Eg, or Eloc between PD and HCs. D, E Difference of Ne values in the CH32 and CH40 between PD and HCs. Violin chart in which dotted lines represent the median and quartile, respectively. PD patients had significantly lower Ne values in the CH32 and higher Ne values in the CH40 than HCs. F p value diagram. The brain regions labeled with cold colors represent the more significant difference between groups. The Ne of the right primary motor cortex (CH32), left pre‐motor area, and supplementary motor area (CH40) in the PD patients were significantly different from those in the HCs. The statistical threshold was set at p < 0.05 (Bonferroni corrected). G Correlations between Ne values in the CH32 values and UPDRS-III scores in PD patients. Scatterplots demonstrated that there was a significant negative correlation between the Ne values in the CH32 and UPDRS-III scores in PD patients. H Correlations between Ne values in the CH40 and UPDRS-III scores in the PD patients. Scatterplots demonstrated that there was significant no correlation between the Ne values in the CH40 and UPDRS-III scores in PD patients. PD Parkinson’s disease, HCs healthy controls, Ne area under the curve of the nodal efficiency, Sigma area under the curve of the small-worldness, Eg area under the curve of the global efficiency, Eloc, area under the curve of the local efficiency, CH channel, UPDRS Unified Parkinson’s disease rating scale. ***p < 0.001, ****p < 0.0001.
TMS data analyses
Although the intracortical facilitation (ICF, both ICF10 ms and ICF15 ms) of PD patients showed a downward trend compared to the HCs group, no statistical difference was observed (Fig. 2, Supplementary Table 3). Moreover, the resting motor threshold (RMT) and cortical silent period (CSP) did not differ between PD and HCs groups.
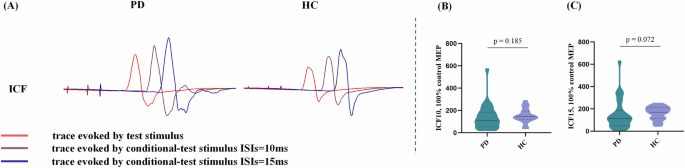
A Actual trace of ICF recorded in 2 participants. B, C Difference of ICF1’0 ms, and ICF15 ms values between PD and HCs. Violin chart in which dotted lines represent the median and quartile, respectively. ICF at 10 ms and 15 ms ISI in the PD patients showed a downward trend compared to the HCs without any statistical significance. PD Parkinson’s disease, HCs healthy controls, ISI interstimulus intervals, ICF intracortical facilitation, UPDRS Unified Parkinson’s disease rating scale. *p < 0.05.
The effect of taVNS on excitation and inhibition in the M1 in PD patients
Cortical functional network topology analyses
For global parameters, two-way analysis of variance (ANOVA) revealed no statistical differences. For nodal efficiency (Ne), two-way ANOVA showed noticeable group*condition interaction effect on the CH32 corresponding to the right M1 (F = 13.400, p = 0.000559, η2 = 0.193, Fig. 3C and Supplementary Table 4). No difference was detected in the group or condition main effect (Fig. 3A, B). Bonferroni post hoc tests clarified that, in the RS group, the Ne in the CH32 of PD patients in the post-treatment condition was significantly increased compared to the baseline condition (p = 0.001, Fig. 3D). In addition, in the post-treatment condition, the Ne in the CH32 of PD patients in the RS group was higher than that in the SS group (p = 0.001, Fig. 3D).
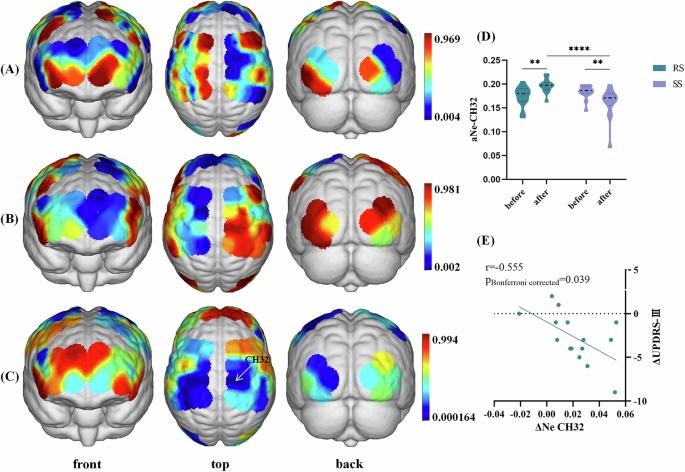
A Main effect of group (RS vs. SS). No significant differences were obtained from the main effect of group. B Main effect of stimulation condition (baseline vs. post-treatment). No significant differences were obtained from the main effect of condition. C Interaction between-group and condition effect. p value diagram in whi+ch the brain regions labeled with cold colors represent the more significant difference between groups. Interaction between-group and stimulation effect was found in the CH32 (corresponding to the right primary motor cortex). The color bar indicates p values from two-way ANOVA, with group (RS vs. SS) and condition (baseline vs. post-treatment) as the factors. The statistical threshold was set at p < 0.05 (Bonferroni corrected). D Post hoc tests in the CH32. Violin chart in which dotted lines represent median and quartile, respectively. A Bonferroni-corrected threshold was set at p < 0.05 for multiple comparison. E Correlations between ΔNe values and ΔUPDRS-III scores within PD patients in the RS group. Scatterplots demonstrated that there was a significant negative correlation between the ΔNe values of CH32 and ΔUPDRS-III scores in PD patients receiving real taVNS treatment. PD Parkinson’s disease, taVNS transcutNeous auricular vagus nerve stimulation, RS real taVNS stimulation group, SS sham stimulation group, UPDRS Unified Parkinson’s disease rating scale, ANOVA analyses of variance, CH channel, Ne area under the curve of the nodal efficiency. **p < 0.01.
No difference was found in group main effect, condition main effect, or group*condition interaction effect on the CH40 (Supplementary Table 4).
TMS data analyses
Two-way ANOVA showed significant group*condition interaction effect on the ICF10 ms (F = 4.190, p = 0.045, η2 = 0.070, Fig. 4A, B and Supplementary Table 5) and ICF15 ms (F = 5.591, p = 0.022, η2 = 0.091, Fig. 4A, C and Supplementary Table 5). No difference was found in group or condition main effect (Supplementary Table 5). Bonferroni post hoc tests showed that PD patients in the RS group exhibited increased ICF10 ms (p = 0.015, Fig. 4B) and ICF15 ms (p = 0.012, Fig. 4C) in the post-treatment condition compared to the baseline condition. Meanwhile, in the post-treatment condition, PD patients in the RS group had higher ICF10 ms (p = 0.011, Fig. 4B) and ICF15 ms (p = 0.004, Fig. 4C) than those in the SS group.
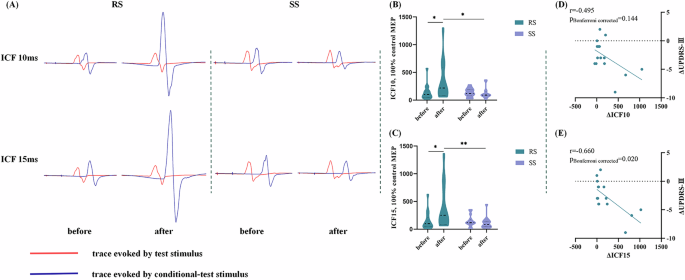
A Actual trace of ICF recorded before and after receiving real taVNS/sham taVNS in 2 PD patients. In the RS group, 14-day real taVNS treatment significantly enhanced ICF at 10 ms and 15 ms ISI. In the SS group, 14-day sham taVNS showed no significant impact on ICF at 10 ms and 15 ms ISI. B, C Post hoc tests of the ICF10 ms and ICF15 ms. Violin chart in which dotted lines represent median and quartile, respectively. A Bonferroni-corrected threshold was set at p < 0.05 for multiple comparison. D Correlations between ΔICF10 ms values and ΔUPDRS-III scores within PD patients in the RS group. Scatterplots demonstrated that there was no significant correlation between the ΔICF10 ms values and ΔUPDRS-III scores in PD patients receiving real taVNS treatment. E Correlations between ΔICF15 ms values and ΔUPDRS-III scores within PD patients in the RS group. Scatterplots demonstrated that there was a significant negative correlation between the ΔICF15 ms values and ΔUPDRS-III scores in PD patients receiving real taVNS treatment. PD Parkinson’s disease, taVNS transcutNeous auricular vagus nerve stimulation, RS real taVNS stimulation group, SS sham stimulation group, UPDRS Unified Parkinson’s disease rating scale, ICF intracortical facilitation, ISI interstimulus interval. *p < 0.05, **p < 0.01.
Partial correlation analyses
We found a negative correlation between the ΔNe values in the CH32 and the ΔUPDRS-III scores in PD patients after adjusting for Levodopa equivalent daily dose (LEDD) (r = −0.555, p = 0.039, Fig. 3E). Simultaneously, partial correlation analysis also showed that the ΔICF15 values were negatively correlated with the ΔUPDRS-III scores in PD patients after adjusting for LEDD (r = −0.660, p = 0.020, Fig. 4E). Besides, ΔICF10 values and ΔUPDRS-III scores showed a negative correlation trend without statistical significance (r = −0.495, p = 0.144, Fig. 4D).
Considering that one subjects had discrete high ΔICF10 and ΔICF15 value, we further performed sensitivity analysis assess the robustness of the correlation. The analysis results showed that our conclusion was reliable (ΔICF10: r = −0.557, p = 0.096; ΔICF15: r = −0.726, p = 0.01).
Discussion
This trial explored the regulatory mechanisms of taVNS on cortical excitability in PD motor symptoms using multiple modalities. For cortical functional topological properties, we observed that PD patients exhibited decreased Ne in the right M1 and increased Ne in the left pre‐motor and supplementary motor area compared with HCs. Further analysis suggested that the disrupted functional topological properties in the M1 in PD patients were closely correlated with the severity of motor symptoms. Interestingly, two-week taVNS treatment improved PD motor symptoms by increasing Ne in the right M1 and enhancing ICF. These findings indicate that taVNS can help restore the excitability in the M1, thereby improving PD motor deficits.
The cerebral cortex plays a cardinal role in controlling and regulating locomotor activities. In contemporary models of the cortico-basal ganglia (BG)-cerebellar connectome, the outflow from the motor cortex can be transmitted to subcortical regions by three major streams, which work in conjunction to model the dynamics of action initiation and selection31. First, the direct and indirect pathways transmit cortical inputs to the BG via segregated populations of striatal neurons, which are believed to have opposed (promote/inhibit) effects on the BG output31. Additionally, the hyper-direct pathways from the frontal cortex to the subthalamic nucleus can rapidly inhibit action suppression31,32. Under this framework, the motor cortex not only affects subcortical nuclei but is also regulated by subcortical nuclei in turn31,33. Recently, motor symptoms in PD have been interpreted as resulting from a broad network malfunction containing cortical sensorimotor regions34,35,36. Studies on primates34 and humans37,38 had implicated that the prevailing hypoactivation of M1 during active movement could lead to motor deficits in PD, particularly bradykinesia. Meanwhile, compelling evidence suggested that M1 excitability changes underlying motor deficits in PD23,36,39. In this context, the M1 plays a vital role, and its neurophysiological alterations are linked to motor deficits in PD patients.
The Ne characterizes the capacity of information communication between nodes of the cortical network. Consistent with the studies mentioned above34,37,38, the Ne values of the right M1 in PD were declined and negatively associated with UPDRS-III scores in our study, demonstrating its impaired efficiency of parallel information transmission and emphasizing its critical involvement in the neuropathological mechanisms underpinning PD. Meanwhile, ICF is a common measure triggered by paired-pulse TMS stimuli and used to reflect cortical excitatory transmission, which is primarily—but not only—mediated by glutamate40. An intracortical excitatory circuit in the motor cortex is mostly activated 6 to 30 milliseconds after a conditioned stimulus below the RMT, which facilitates the motor-evoked potentials (MEPs) generated by a suprathreshold test stimulus within the ISI41. In our study, the ICF of PD patients showed a significant downward trend compared to HCs. Previous studies have found that PD patients have reduced ICF in the M142,43, suggesting that facilitatory intracortical M1 circuits were aggrieved in PD patients. Based on a comprehensive analysis of Ne and ICF, we speculated that the decreased M1 information processing efficiency might be another manifestation of impaired excitability in the M1 region of PD. Our detected damaged functional topological properties and cortical excitability could be an indirect result of dopamine deficiency induced by diminished excitatory inputs from the ventrolateral thalamus to the M1 in reaction to chaotic BG output31,44,45. Additionally, the direct deactivation of dopaminergic neurons to the M146 and other non-dopaminergic processes could cause a notable margin in nodal information processing efficiency in M123.
The circuitry that mediates the impacts of VNS on the function of the central nervous system remains a contentious scientific topic. The afferent fibers of the auricular branch of the vagal nerve terminate in the NTS and then project widespread to numerous subcortical and cortical brain areas, such as the LC, thalamus, amygdala, hippocampus, and neocortex, which lays the anatomical foundation for the neuroregulatory role of taVNS47. Moreover, numerous existing studies have demonstrated from multiple perspectives that taVNS can regulate the excitability of the motor cortex48,49,50,51,52. An animal study combining optogenetics and in vivo calcium imaging technology discovered that VNS could accelerate motor refinement in M1 via regulating basal forebrain neuronal activity50. Alternatively, several neuroimaging researches uncovered that taVNS could influence basal ganglia-thalamo-cortical connectivity network53,54,55. A previous TMS study also found that taVNS may exert modulating effects through the cerebello-thalamo-cortical pathway by detecting cerebellar brain inhibition56. Besides, further research indicated that taVNS could regulate the excitability and plasticity of M1 through various neurotransmitter signals such as noradrenergic57, GABAergic49, and cholinergic58. Remarkably, our interaction analysis revealed that PD participants in the RS group had enhanced Ne and ICF (ISI 10 and 15 ms) in the right M1 region in the post-treatment condition relative to the baseline condition. Concurrently, in the post-treatment condition, PD patients in the RS group showed significantly higher Ne and ICF (ISI 10 and 15 ms) in the right M1 region than those in the SS group. Our results unveiled that a two-week taVNS could regulate cortical excitability in the right M1 region by improving information processing efficiency and increasing cortical facilitation. Considering that the facilitation effect of ICF was mainly influenced by N-methyl-D-aspartate receptor-mediated glutamate excitatory interneurons40,59, we speculated that taVNS might increase the excitability of right M1 by increasing the glutamate excitatory output of thalamo-M1 pathway. Furthermore, partial correlation analysis showed that the ΔNe and ΔICF (ISI 15 ms) values in the right M1 region in the active taVNS stimulation group were negatively related to ΔUPDRS-III scores, which constituted preliminary evidence that taVNS could help restore the excitability in the right M1 region to improve PD motor deficits.
Several limitations should be considered when dealing with our results. First, the sample size of this study was relatively small. However, we calculated the sample size from different perspectives and took a relatively larger one to increase the credibility of the results based on the existing conditions. Second, although the high sampling resolution of fNIRS made it convenient for capturing functional changes in the cerebral cortex, topological features of subcortical structures cannot be detected by the fNIRS system because of its shallow detection depth. Third, although our subjects (RS vs SS) were matched at baseline, our study did not correct baseline data, which could increase the risk of not adjusting for regression to the mean60. Fourth, our study could not determine the duration of neuromodulation due to a lack of follow-up. Fifth, we only used interstimulus intervals (ISIs) of 10 and 15 ms, which were commonly used in existing studies to access ICF. Considering that different ISI might induce ICF through different mechanisms, we need to add ISI intervals to better explore the regulatory mechanism of taVNS on PD. In the future, large-scale, multi-center studies should be conducted. Then, multimodal technical evaluation methods, especially functional magnetic resonance imaging, should be used to replicate and brace the certainty of our conclusions. Moreover, we need to further explore whether the continuous or periodic use of taVNS would be necessary to maintain improvements in motor symptoms of PD to better clarify the application in the field of PD neural regulation.
This study provides new insights into the involvement of M1 in PD and a more comprehensive understanding of the neural mechanisms by which taVNS regulates motor symptoms in PD. The results supported the hypothesis that taVNS might ameliorate PD motor disorders by remolding abnormal excitability in the M1. Namely, a two-week taVNS treatment could improve nodal information processing efficiency in the M1 region and enhance cortical facilitation, thereby improving PD motor disorders.
Methods
Study design and participants
Thirty-two PD patients were randomly assigned 1:1 to either the RS or the SS in this single-center, double-blind, randomized, and sham-controlled experiment. The First Affiliated Hospital of Nanjing Medical University’s ethical committee approved this study (2024-SR-235). The experiment was registered, and its full methodology disclosed at clinicaltrials.gov (NCT06409338, https://clinicaltrials.gov/study/NCT06409338) prior to the first participant being enrolled. In accordance with the Declaration of Helsinki, every participant completed a written informed consent form previous to the commencement of the study.
Righted-handed participants were eligible if they (1) diagnosed as idiopathic PD in accordance with the Movement Disorder Society Clinical Diagnostic Criteria for PD; (2) with the Hoehn and Yahr (H&Y) stage ≤2 (during dopaminergic medication ON phase); (3) received steady pharmacotherapy for PD, leastways one month before this investigation; (4) age between 40 and 80 years old; (5) signature written informed consent; (6) cooperate with the entire examine and taVNS therapy. Exclusion criteria were (1) had cognitive dysfunction (Montreal Cognitive Assessment [MoCA] < 24)61; (2) with symptoms that affect fNIRS and TMS data collection, such as intensive tremor or levodopa-induced dyskinesia; (3) currently taking anticholinergic drugs or any medication that might cause alterations in brain function; (4) with contraindications for taVNS therapy; (5) underwent VNS therapy within the past half year; (6) accompanied by intensive neurological, renal, cardiovascular, or hepatic disease. The inclusion and exclusion criteria referred to our team’s previous research6 to ensure consistency.
Concurrently, 20 age and gender-matched HCs were enrolled to better comprehend the neural regulatory mechanisms of taVNS. Inclusion criteria for HCs were as follows: (1) without cognitive dysfunction (MoCA ≥ 24); (2) without concomitant severe neurological, renal, cardiovascular, or hepatic disease; (3) willing to signature written informed consent.
Study procedure
Figure 5 shows the research procedure, where all qualified participants who had completed telephone screening came into the Neurology Department of the First Affiliated Hospital of Nanjing Medical University for the informed consent procedure and preliminary screening. When conducting screening visits (V0), we recorded each participant’s age, sex, education level, medical history, medication use, and family history. We also interviewed their eligibility based on inclusion and exclusion criteria. Especially, the disease onset age, course of disease, and the initial side of onset of motor symptoms were also recorded for each PD patient. Thirty-two eligible PD patients were randomized in a 1:1 ratio to either RS or SS group for a 14-day intervention period. Randomization was conducted with a random digital table based on SPSS v25. Within one week after the screening visit (V0), all participants (including HCs) were required to participate in the baseline visit (V1). Comprehensive neuropsychiatric examinations were conducted by two specialized neurologists unclear about the group assignments, followed by resting-state fNIRS and TMS examination during the morning dopaminergic medication ON stage. After 14-day real or sham taVNS stimulation, all PD patients returned to the outpatient service for the follow-up visit (V2), during which neuropsychiatric examinations (including clinical motor severity measures), resting-state fNIRS, and TMS examination were applied. Meanwhile, the experimenters responsible for randomization guided the participants to ensure that each subject was treated by the same experimenter. Patients were instructed not to disclose the information that will expose the grouping (such as the stimulation site) to the data collectors of this study at any time. All PD patients kept their normal medications throughout the trial.
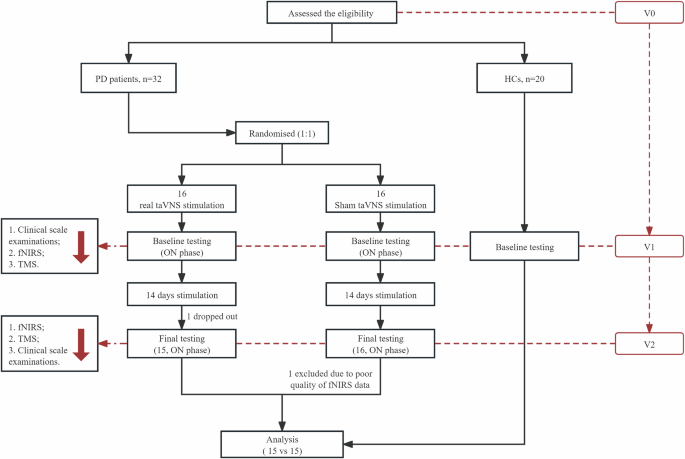
fNIRS functional near‐infrared spectroscopy, HCs healthy controls, PD Parkinson’s disease, taVNS transcutaneous auricular vagus nerve stimulation, TMS transcranial magnetic stimulation.
Intervention
Transcutaneous electrical stimulation therapy instruments (tVNS501, RISHENA, China) were used in this trial. Stimulation parameters were set according to our previous study of taVNS on PD6: frequency = 20 Hz; pulse width = 500 μs; lasting 60 s stimulations on, alternated with 10 s off. The stimulation intensity was set as the maximum value that the participants could bear without inducing ache. PD patient received stimulation twice daily, 30 minutes each time, for 14 consecutive days6,62. This set of parameters was used in our previous study and shown to improve gait disorders and the UPDRS-III scores in PD patients6,62. One previous fMRI study had found that the stimulation on the cymba conchae properly activated the vagal pathway and led to the strongest activation63. Referring to previous studies6,62, electrical stimulation was delivered via two modified dot-like electrodes placed near the auricular branch vagus nerve in the cymba conchae of the left ear in the RS group. In the SS group, the electrodes were fixed at the left earlobe. Prior to the experimental procedures, all equipment was calibrated to ensure accurate delivery of the stimulation parameters. Meanwhile, we provided training to each PD participant and their dependents to ensure their ability to use the taVNS stimulator correctly at home. Moreover, we dedicated researchers who contacted the subjects through chat software or phone calls every 3 days, to guarantee the correct and coherent implementation of taVNS treatment (real or sham).
Clinical assessment
The UPDRS-III and H&Y stage were applied to appraise the motor symptoms and disease severity of PD patients. Meanwhile, MoCA was applied to accessed cognitive function. Besides, we used the Hamilton Depression Rating Scale-24 (HAMD-24)64 and the Hamilton Anxiety Rating Scale (HAMA)65 to appraise the emotional conditions. LEDD was also calculated66.
Functional near infrared spectroscopy data acquisition and preprocess
A 63-channel fNIRS system with 24 sources and 24 detectors (NirScan, Huichuang, China) with a sampling frequency of 11 Hz and three wavelengths (730, 808, and 850 nm) was used. Based on the 10/20 electrode distribution system, the signal sources and detectors were designed to cover the cortex of bilateral cerebral hemispheres. The inter-probe distance was set to 30 mm to contact the scalp better. The specific correspondence between the channel and the Brodmann brain area overlap is shown in the Supplementary Table 1. Every participant underwent 10 min resting-state fNIRS examination, during which they were required to keep rest, closed their eyes but maintain awake. The data with channel signal missing (the channel on the device is gray) was judged as poor quality.
Resting-state fNIRS data was preprocessed in MATLAB 2018b using Homer2 toolbox (https://www.nitrc.org/projects/homer2). Preprocessing followed established standard procedures: (1) converted original light intensity to optical density; (2) identified and corrected motion artifacts based on the cubic spline interpolation method (parameters: tMotion = 1.0, tMask = 1.0, STDEVthresh = 30, AMPthresh = 0.5); (3) used band-pass filter (0.01–0.1 Hz) to extract spontNeous neural activity; (4) converted the filtered optical density signal into oxyhemoglobin (HbO2) and deoxyhemoglobin (HHb) using the modified Beer-Lambert law. The differential path-length factor was set as 6 to illustrate the true effective path length between the source and detector. HbO2 signals were chosen for further complex brain network analysis as they were more sensitive to cortical BOLD response67 and widely used in previous studies to construct functional connectivity matrix68,69.
To construct a cortical functional network, we denoted the channels as nodes and pairwise Pearson correlation coefficient between channels as edges, resulting in a 63 × 63 correlation matrix for each participant. All negative correlation coefficients were set to zero due to ambiguous biological meanings, so only positive correlations were applied to further analysis70. Fisher’s z-transformation was performed primarily to improve normality. Subsequently, the obtained functional correlation matrix was analyzed on the GRETNA software (https://www.nitrc.org/projects/gretna/node) to reveal changes in cortical functional topological properties at global and nodal levels. In this study, the range of sparsity was set from 0.06 to 0.39 (interval = 0.01). The minimum value (0.06) was calculated according to 2 log (63)/(63–1). The maximum value was set to the sparsity value when the Sigma value was just >1.1. We further computed the area under the curve (AUC) over the sparsity of each functional matrix, resulting in a generalized dimension for the topological properties of cerebral cortex functional networks independent from a single threshold selection. Ultimately, three typical global parameters named Sigma, Eg, and Eloc and one nodal parameter named Ne were calculated.
TMS data acquisition and preprocess
Single-pulse and paired-pulse TMS were used on participants to test excitatory and inhibitory cortical function. We recorded MEPs by surface electromyography (sEMG) recordings from the abductor pollicis brevis (APB) muscle. The selection of sEMG recording location was based on the more affected side of PD patients and the dominant side of HCs. The MEPs were amplified and filtered with bandwidth ranging from 20 Hz to 2000 Hz. TMS was performed using Neurosoft magnetic stimulators (Neurosoft Ltd., Ivanovo, Russia) coupled to a butterfly-8-shaped coil (diameter = 10 cm). The coil was delivered tangentially to the scalp overlying the M1-UL, with the coil handle positioned at 45° from the midline pointing backwards.
The hot spot of APB was identified by repositioning the coil in 1-cm increments while delivering magnetic pulses and detecting for contraction of the contralateral APB. The individual RMT was determined as the minimum stimulus intensity necessary to evoke an MEP peak-to-peak amplitude of at least 0.05 mV in five of ten successive trials in a resting muscle. Subsequently, the CSP was accessed by sEMG of the APB, which emits a single TMS pulse to the opposite M1-UL at 130% of RMT, while requiring participants to maintain active contraction of APB at 20% of maximum force. We repeated the protocol 10 times to calculate the average value of CSP. Then, paired-pulse TMS was applied to obtain ICF. Test stimulus intensity was set according to an unconditioned MEP with an amplitude of ~1 mV. For the conditioning stimulus of ICF, 80% of RMT was used. We tested ISIs of 10 and 15 ms for ICF. Each ISI was repeated 20 times to calculate the average value. ICF values were calculated as percentage ratios between the test and conditioning test MEPs.
Sample size and power calculations
No previous research had estimated the effects of taVNS-related treatments or sham stimulation on cortical excitability and inhibition in PD patients. Based on our preliminary study6, in which the cortical BOLD signal during walking tasks was detected, the total sample size of 32 PD participants was needed (calculated through G*Power software, test family: F tests; statistical test: ANOVA-fixed effects, special, main effects, and interactions; effect size: 0.681 [determined by partial η2 = 0.317]; power: 0.95; α error: 0.05; numerator df: 1). Additionally, the sample size was also calculated by G*power according to UPDRS-III scores. The mean UPDRS-III difference (value at post-treatment−value at baseline) in the RS group was 5.18 with an SD ± 4.167; the mean UPDRS-III difference in the SS group was 0.36 with an SD ± 1.206. The calculated effect size d equaled 1.5716. With an α level of 0.05 (two-tailed), a total of 24 PD patients was required to achieve a statistical power of 0.95 in the t tests (means: the difference between 2 dependent means [2 groups]). A relatively large sample size (32 patients) was selected for this study.
Outcomes
The primary outcome measures were (1) alterations in topological properties of cortical functional networks in both hemispheres of the brain and (2) changes in MEPs, RMT, CSP, and ICF values, which were proxies for cortical excitation and inhibition. Secondary outcomes included changes in UPDRS-III scores from the baseline.
Statistical analysis
Data were analyzed with SPSS V25 and checked for normality using the Shapiro-Wilks test. χ2 test was used for discrete variables. For continuous variables that followed a normal distribution, we used one-way ANOVA or two-sample t tests; otherwise, used nonparametric analysis methods.
When evaluating cortical excitability and inhibition, we first compared the differences in functional topological properties and TMS data between PD and HCs at baseline, providing a reference for seeking the neuro mechanism of taVNS in regulating PD motor symptoms. In addition, as the Ne was compared at the 63-channel level, we performed Bonferroni correction to reduce the false positive rate. Further, a partial correlation analysis of Ne-CH32 against the UPDRS-III scores was conducted in PD patients. Considering the cortical function in PD patients was detected during the dopaminergic medication “on” state, we used LEDD as a covariate.
We conducted the two-way ANOVA to appraise the impact of taVNS on the functional topological properties (Sigma, Eg, Eloc, and Ne) and TMS data (RMT, CSP, and ICF values), with the between-group factor “Group” (taVNS stimulation vs. sham stimulation) and the within-group factor “condition” (pre‐stimulation vs. post‐stimulation). Specifically, we performed a log10 transformation on ICF data due to its skewed distribution in PD patients. Subsequently, we conducted multiple comparisons on metrics with remarkable interaction effects using Bonferroni post hoc tests.
Meanwhile, we calculated the ΔUPDRS-III ([value at post-treatment−value at baseline]) of each participant in the RS and SS groups and evaluated the improvement of taVNS on motor symptoms in PD patients through two-sample t tests or Mann–Whitney U tests.
To further probe the relationship between the therapeutic impact of taVNS on PD motor disorders (ΔUPDRS-III) and cortical effects (ΔNe-CH32, ΔICF12, ΔICF15), we used partial correlation analysis with LEDD as the covariate. Bonferroni correction was conducted for partial correlation analysis. Statistical significance was defined as two‐tailed p < 0.05.
Responses