Transformer-based modeling of Clonal Selection and Expression Dynamics reveals resistance mechanisms in breast cancer

Introduction
While cancer is traditionally considered a disease of genetic alterations, studies have shown adaptive resistance to treatment often involves molecular differences in genetically identical cells1,2,3,4,5,6,7,8,9. The plastic nature of the response to treatments and its heterogeneity may even be a necessity to enable the emergence or selection of resistant clones10. Characterizing and understanding tumor heterogeneity and how it affects treatment response is critical to the development of new therapeutic strategies in oncology. Advances in single-cell technologies, such as the tracking of molecular states over time, can be used to address those questions8,11,12,13,14,15,16,17,18,19,20,21. In particular, transcriptional heterogeneity can be captured through clonal barcoding methods such as TraCe-Seq22. Studies have also shown that “twin” clones (i.e., sister cells with the same barcode) show a higher degree of transcriptional similarity than other clones23, suggesting that the transcriptional state of barcoded clones persists after multiple divisions. Leveraging this assumption, TraCe-Seq measures the fitness and transcriptional trajectory of clones in parallel pools of cells undergoing different treatments (Fig. 1A). To uncover differences associated with the selection process, the fitness of clones at the end of treatment can be mapped back to their transcriptional states pre-treatment or at intermediate time points.

A TraCe-Seq experiment includes single-cell RNAseq data from a series of pre-treatment and post-treatment time points that originate from the same pool of barcoded cells. In our case, the treatments include either giredestrant alone (0.1 µM), palbociclib alone (0.2 µM), or their combination (same concentration). Cell culture dish icons are credited to DataBase Center for Life Sciences through the Creative Commons Attribution 4.0 International license. B–D Baseline investigations begin by determining the “endpoint selection value” for each clone (circles or triangles) by dividing the fraction of the clone 26 days after treatment by the fraction of clones present pre-treatment relative to the population (B). These covariates are assigned to clones at baseline and combined with the single-cell RNAseq data to create a partial least squares regression (PLSR) dimension reduction (C). A majority of resistant cells are specific to a cluster, which is then compared to clusters with a majority of sensitive cells (D). E–G To model adaptive resistance the selection values of clones across a time course for the treated cells must first be determined. This is initiated by selecting a pseudotime cell-by-cell ordering inferred by slingshot which is consistent with the experimental time ordering (E). Clone selection values at a selected pseudotime are defined as the proportion of cells of a given clone among all cells ahead of the pseudotime point of interest devided by the same proportion prior to the pseudotime point (F). Finally, clone selection values are paired with gene or gene set features for the single cell to model the prediction of single-cell selection value (G). This prediction considers the temporal context as well as the feature values, such that downstream model interpretability analysis yields dynamic features important in resistance.
While experimental advances have been substantial, methodologies to interpret such multidimensional single-cell transcriptional datasets are still in their infancy. For example, clustering approaches can fail to distinguish resistant from sensitive cell states as recent clonal barcoding systems have shown that a few genes, or even a single gene, can determine a cell’s fate24. However, incorporating clonal information through a tunable parameter into the dimensionality reduction has been shown to benefit the identification of features associated with cell outcomes24. Innate resistance may play a major role as intrinsic cell states conferring resistance could be encoded prior to external stimuli23,25. Additional forms of non-genetic response may also contribute to resistance. For example, altering epigenetics or rewiring signaling networks could underlie adaptive resistance that emerges after treatment has begun26. Because traditional methods rarely integrate longitudinal data as a continuum and associate them with an outcome, they yield limited understanding of adaptive resistance, its underlying gene programs, and the time at which such changes occur.
To address those shortcomings, we first developed a semi-supervised approach with partial least squares regression (PLSR) to identify pre-treatment markers of innate resistance in TraCe-Seq datasets (Fig. 1A–D). This approach incorporates the transcriptional similarities of cells together with a phenotypic response to reveal signatures that might otherwise be hidden from traditional methods. PLSR uncovers single gene markers of innate resistance in breast cancer, such as SNHG25 and CLDN1, which were missed by PCA-based clustering and differential expression (DE) methods.
Next, to identify gene programs associated with adaptive resistance, we introduce TraCSED (Transformer-based modeling of Clonal Selection and Expression Dynamics). TraCSED learns a dynamical process of clonal selection using a clone trajectory’s inferred pseudotime from TraCe-Seq single-cell RNA-seq data as the time series input for model fitting (Fig. 1E–G). Using pseudotime allowed for a continuous trajectory that captured the temporal heterogeneity of the response. TraCSED uncovers interpretable gene programs that are directly related to the selection process and estimates time periods at which these may be critical for resistance.
We applied PLSR and TraCSED to infer resistance mechanisms for palbociclib, an approved CDK4/6 inhibitor used in the clinic, and, giredestrant, an investigational selective estrogen receptor (ER) antagonist and degrader27. We compared the results of single-agent treatments to combination therapy in which we observed different factors associated with resistance. In particular, all clones that resisted the single-agent treatments became sensitive to the combination except one that was still resistant to the combination. This demonstrates the value in TraCSED in finding important features associated with a phenotypic variable, in this case clone fitness, and how this information can guide our biological understanding of drug response.
Results
Treatments induce different clonal selection and transcriptional responses
We performed a TraCe-Seq experiment with T-47D cells treated with giredestrant, a selective ER antagonist and degrader, or palbociclib, a CDK4/6 inhibitor, for 1, 4, 8, or 26 days (Fig. 1A). The acute response from T-47D cells to either drug is cytostatic, as shown by the normalized growth rate (GR) values being close to zero (Supplementary Fig. 1A)28. Both treatments induced a decrease in clone diversity, as quantified by a reduction in the number of unique clonal barcodes in the cell population (Fig. 2A). We classified clones as either positively selected (PS) or negatively selected (NS) based on the ratio of clonal frequency in the overall population at day 26 versus day 0, which we termed the “endpoint selection value”, as surrogate for clone fitness (Fig. 1B). Clones with a greater clonal frequency after 26 days of treatment had an endpoint selection value greater than 1 and were considered PS, whereas clones with lower frequency had a value less than 1 and were labeled NS. As an illustration, when we selected the 11 clones with at least 200 cells across all time points, we observed differences as to which clones were PS for giredestrant compared to palbociclib treatment (Fig. 2B).
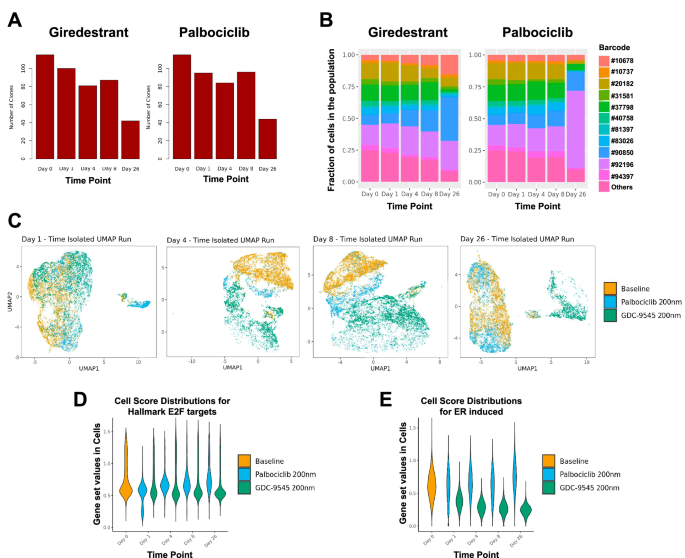
A Overall number of clones detected in samples of T-47D cells treated with either giredestrant (left) or palbociclib (right) at different time points. B Fraction of cells for clones with a minimum of 200 cells for giredestrant (left) or palbociclib (right) treatments at different time points. C UMAP of cells from the baseline sample and each time point individually for both giredestrant or palbociclib treatments. Values for the E2F targets (D) and ER (E) gene sets for baseline cells and cells treated with either palbociclib or giredestrant at different time points.
UMAP based on PCA showed that both treatments induced a strong transcriptional response with clear separation of the cells in each treatment group, suggesting the dynamics of response are characteristic of each treatment (Fig. 2C, Supplementary Fig. 1B). By day 26, the separation in transcriptomes between treatments was clear with cells from the palbociclib-treated sample overlapping in UMAP space with baseline cells. In contrast, the giredestrant-treated cells formed a separate UMAP cluster, reflecting a more pronounced shift in the transcriptional state. Reduction of ER activity, evaluated using a highly curated gene expression signature29, is sustained throughout the time points of the giredestrant-treated samples (Fig. 2E), but the fraction of cells with E2F positive scores returned to baseline levels in both giredestrant- and palbociclib-treated samples (Fig. 2D). Giredestrant’s inhibition of ER activity was maximal around 4–8 days and aligned with its effect on cell cycle (Fig. 2E). Consistent with this result, we observed by Western Blot a downregulation of ER and its target, the progesterone receptor (PR) in the giredestrant-treated sample (Supplementary Fig. 1C) and a regain of pRb, a marker of proliferation, in both PS populations. The PS populations for each treatment were, as expected, more resistant than the parental population to the treatment used for selection as shown by the positive GR values reflecting partial growth inhibition (Supplementary Fig. 1A, C). PS cells were able to proliferate, albeit slower when rechallenged with palbociclib treatment, whereas the PS cells in the giredestrant treatment became completely insensitive to giredestrant. We also observed a partial cross-resistance between the two drugs (Supplementary Fig. 1A): the palbociclib-PS population had higher GR values for the response to giredestrant than the parental population, and the reverse was also true.
PLSR identifies baseline signatures associated with selection of clones
The observed “rebound” in the E2F gene set value could be due either to an innate fitness advantage of some clones prior to treatment, which allowed those clones to outcompete other clones, or it could be due to an adaptive response induced by the treatment itself in the PS clones. In either case, we hypothesized that the initial transcriptional state influences the likelihood of a clone being PS under treatment. However, initial attempts using pseudobulk samples in which cells from clones of similar endpoint selection values were grouped revealed few differentially expressed genes for either treatment condition (Supplementary Fig. 2A). Alternatively, unsupervised clustering via PCA did not separate PS and NS clones for either treatment and showed a similar map between treatments due to high gene expression variability across cells from clones independent of the long-term outcome (Supplementary Fig. 2B). Thus, both pseudobulk DE analysis and PCA-based clusters failed to identify genes associated with resistance.
We therefore undertook a more sensitive approach to detect resistance genes using semi-supervised partial least-squares regression (PLSR) dimensionality reduction (see “Methods”; Fig. 1C). PLSR incorporates the transcriptional state as independent variables and the endpoint selection value as a dependent variable to search for a data projection in which PS and NS clones are well separated in the lower dimensional space. Using the PLSR-based UMAP, cells from PS clones were better separated from cells from NS clones (Fig. 3A, B). In this projection, we were easily able to define clusters that were strongly enriched in cells from clones that were PS across time (Supplementary Fig. 2C, D) revealing baseline markers of selection (Supplementary Fig. 2E) that were missed by traditional pseudobulk DE (Supplementary Fig. 2F).
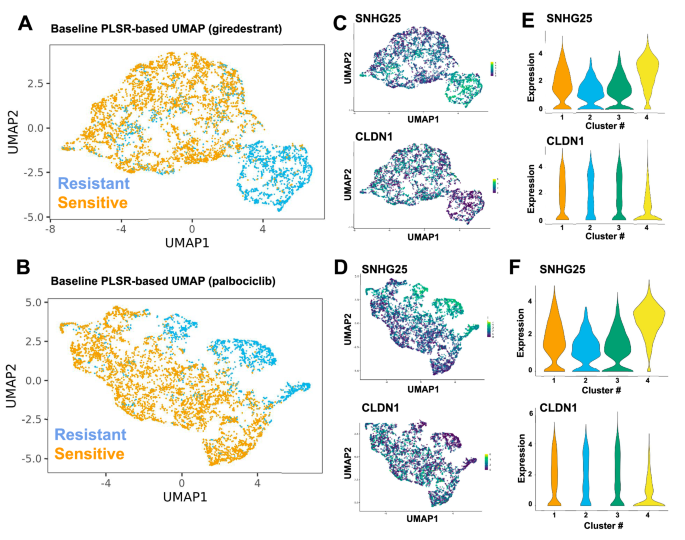
PLSR-based UMAP for baseline cells associated with outcome of either giredestrant (A) or palbociclib (B) treatment. Positively selected (PS) cells are in blue and negatively selected (NS) in orange. SNHG25 and CLDN1 expression levels are displayed in the UMAP (C, D) and violin plots (E, F) for giredestrant (C, E) or palbociclib (D, F). Cluster 4 contains most PS cells for both giredestrant and palbociclib (see Supplementary Fig. 2D).
The PLSR-based projection achieved a better separation of PS and NS cells compared to PCA (Supplementary Fig. 3A, B), such that PS cells were aggregated into a single PLSR cluster for giredestrant treatment (Fig. 3A), which enabled a pseudobulk differential gene expression analysis comparing expression observed in cells of the PLSR-based PS cluster to cells outside the cluster. Among the differentially expressed genes (DEGs), high SNHG25 and low CLDN1 expression were identified (Fig. 3C, E). Similarly, a PS cluster was also identified for the palbociclib-treated cells (Fig. 3B), with SNHG25 and CLDN1 identified as DEGs for the palbociclib PS cluster (Fig. 3D, F). CLDN1 is a known marker used for classifying subtypes of breast cancer, and low CLDN1 is a marker for aggressive triple-negative BRCA and is predictive of recurrence30,31,32,33. SNHG25 has been shown to be associated with tumor activity, but is poorly understood34,35,36,37,38.
TraCSED fits the adaptive resistance using a generative model
As both PS and NS clones had a strong transcriptional response as illustrated in the UMAP (Supplementary Fig. 3C–E), we extended our modeling framework to leverage the longitudinal transcriptional data and explore potential acquired resistance mechanisms. We therefore adopted a dynamical modeling approach to identify the transcriptional programs associated with the clonal selection process revealed by the TraCe-Seq data. We assumed that a population of cells can be ordered along a continuous cell trajectory capturing the progression from sensitivity to resistance of individual clones and the temporal heterogeneity of the response. We used the Slingshot method to estimate the cell trajectory and project the cells along a response curve, establishing a pseudotime ordering of the cells. We calculated selection values across the Slingshot pseudotime for each clone, where the selection value at each pseudotime point reflects the proportion of a clone’s cells relative to the total population surviving after that point relative to the proportion prior to that point (Fig. 4A, B, see “Methods”). To associate transcriptional changes with treatment response, we developed an interpretable generative model that predicts selection values based on a set of features, which we called TraCSED for Transformer-based modeling of Clonal Selection and Expression Dynamics. After the Slingshot pseudotime is established, we calculated the selection value along the trajectory for every cell belonging to a given clone (Fig. 1E, F). In brief, the selection value at the pseudotime point t is the proportion of cells from the clone of interest among all cells in the experiment ahead of t divided by the same proportion prior to t (Fig. 4A, B, see “Methods”). The transformer was then trained to predict the selection value of the cell at pseudotime t using the transformer’s features as well as the features and selection values of clone c cells in the context of the cell of interest (Fig. 1G). Model accuracy was tested over four pseudotime intervals (Fig. 4C). In this way, the model learned a conditional relationship between the features and selection values based on where the cell resided in pseudotime.
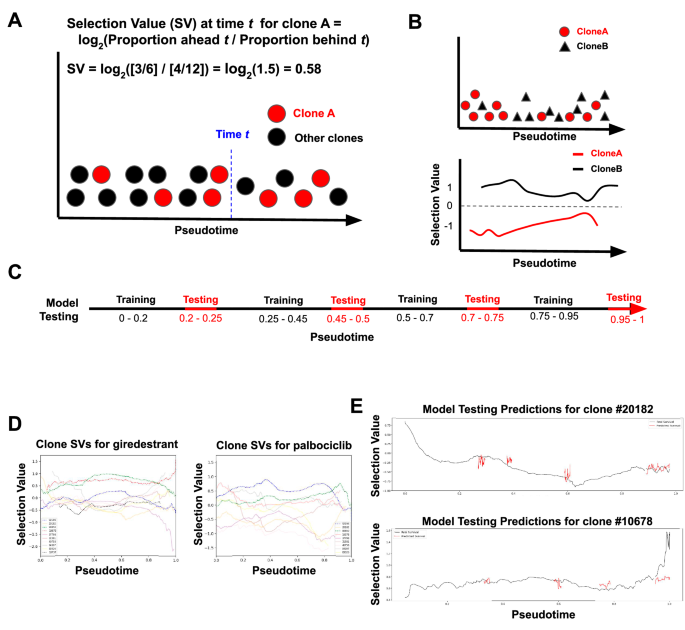
A–C An example clone (red) exists as part of a total population of cells (black) across a pseudotime progression. To determine the selection value at any given time (blue) for the clone in question, the proportion of cells of a given clone in the population ahead divided by the proportion behind a given pseudotime point is used (A, see “Methods”). This results in a continuous selection value curve for each clone across pseudotime (B). This model of dynamic selection is then tested in four different increments (red) along pseudotime to ensure a quality model fit at all time points (C). D The resulting transformation from raw data along pseudotime to selection value curves for each clone is shown for each clone in giredestrant (left) and palbociclib (right) experiments. E Example of the model testing (red) for two clones under giredestrant treatment is displayed.
We required a minimum number of cells (set to n = 200) to be present across the time course to model the selection process of a specific clone, as selection values were too noisy otherwise (see “Methods”). Eleven clones met this criteria for at least one treatment (Palbociclib—9, Giredestrant—10, Combination treatment—11) and this represents 77% of the total clonal population at day 0 and 89% by day 26 (See Fig. 2A, B and Fig. 6A). As features of the model, we used the Hallmark gene sets and calculated their activity at the single-cell level39. It should be noted that comparisons between clones might be biased by differences in the number of cells between clones, but all comparisons within a single clone remained unbiased. Across all testing periods (see “Methods”), the model had lower error than a multivariate regression (Supplementary Fig. 4), but the MSE values varied between testing periods. In general, the prediction was worse for the last testing interval as the selection value was noisier due to its dependence on the number of cells, which decreased at the end of the trajectory (Fig. 4E). When assessing the contribution of the attention and convolutional layers, we found that the combination of both sets of layers yielded the best compromise of fit quality and prediction accuracy (Supplementary Fig. 4). Thus, TraCSED can fit interpretable features associated with the positive or negative selection process of specific clones.
Model features reveal adaptive resistance mechanisms
Permutation of TraCSED’s input layer enabled the identification of features that induce changes to the predicted selection value, a procedure called permutation importance40. We calculated the Mean Average Error (MAE) as the error induced by randomly changing the feature values (see “Methods”) over the whole experiment independently for each clone. A reduced MAE indicates that a feature was less important in predicting the selection values of a given clone. In addition, by altering the inputs across pseudotime, an importance score was calculated for each feature at each pseudotime point for individual clones, enabling us to interpret when a feature is important for the survival outcome. Using this procedure, we found that permuting values for the “Epithelial Mesenchymal Transition” (EMT) gene set resulted in a substantial deviation from the original selection value (Fig. 5A, upper panel) for clone #92196 and an increase in feature importance score (Fig. 5A, middle panel) within a pseudotime range that aligns with the 4 to 8 day time points of giredestrant treatment (Fig. 5A, lower panel). We considered a feature to be important for positive selection if importance scores were higher for PS clones than NS clones and PS clones had a feature value differing from NS clones. To identify such features, we plotted the feature importance scores and values for PS and NS clones and found that the importance score for EMT was higher for the PS clones than the NS clones in the pseudotime range [0.5–0.9] for giredestrant treatment (Fig. 5B). In the PS clones, EMT gene set value was lower than for NS clones even if it changed over the course of the treatment (Supplementary Fig. 5A), suggesting that EMT remained relatively low upon giredestrant-treatment was associated with resistance.
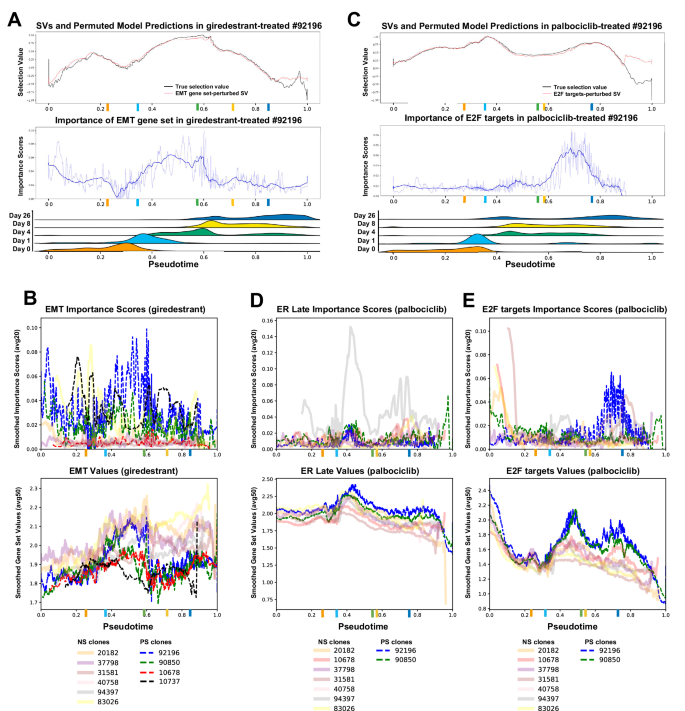
A Model predictions with permuted EMT values (red) were plotted against the original selection values (black) under giredestrant treatment (top) for a specific clone. (Middle) Feature importance scores for EMT with averaging smoothing of 20 (light blue) or 150 (dark blue) adjacent cells along pseudotime. (Bottom) Ridge plot of all cell distributions for each experimental time point along pseudotime. Straight vertical lines show the median pseudotime of cells for each experimental time point. B Smoothed model importance (averaging 20 adjacent cells, top) and smoothed gene set values (averaging 50 adjacent cells, bottom) plotted for PS clones (dashed lines) and NS clones (solid lines) in the giredestant treatment for EMT. C–E Same as (A, B) for palbociclib treatment. Originally calculated selection values (black) and model with permuted E2F targets (red) (C, top); feature importance scores for E2F targets (C, middle); and ridge plots of cell distributions for palbociclib treatment (C, bottom). Smoothed model importance (top) and smoothed gene set values (bottom) plotted for Estrogen Response Late (D) and E2F targets (E) in palbociclib treatment. Colored ticks on the x-axis show the median pseudotime of cells for each experimental time point (colors corresponding to A).
Similarly, we examined the feature importance scores for clones undergoing palbociclib treatment. For example, E2F targets had high importance scores in the pseudotime range [0.6–0.8] for #92196 (Fig. 5C). When looking at all clones together, the feature “Estrogen Response Late” (ER) had high importance scores for PS clones and ER activity was increased above NS clones in pseudotime range [0.35–0.5] corresponding to early time points (Fig. 5D). This ER activity in PS clones preceded an increase in the importance scores for the E2F targets gene set during the pseudotime ranges [0.6–0.8] (Fig. 5E). Other features were similarly noted as important for clone selection including “G2M checkpoint” in palbociclib and the AKT pathway in giredestrant (Supplementary Fig. 5B, C). Taken together, these findings suggested that single agent treatment was subject to adaptive resistance but the combination of palbociclib and giredestrant might be more effective due to giredestrant preventing the positive selection of high ER activity clones resulting from palbociclib treatment.
Adaptive resistance is reduced with combination treatment
Next, we treated cells with palbociclib and giredestrant as a combination to investigate our earlier finding. Combination therapy proved to be effective in suppressing proliferation and ER activity across the whole population, which was not previously achieved by palbociclib or giredestrant alone (Supplementary Fig. 6A, B). While most clones that were PS in either single agent treatments became NS in the presence of combination, one clone was PS in both single-agent treatments and remained PS in the combination treatment after 6 months (Fig. 6A). The selected population is indeed more resistant to treatment than the individual resistant populations (Supplementary Fig. 1B). Similar to the giredestrant-PS population, the surviving population lost ER and PR expression compared to the parental population suggesting ER activity independence (Supplementary Fig. 6C). In addition, surviving cells have lower cyclin D expression, while retaining high pRB, showing less dependency on CDK4/6-CyclinD activity to proliferate (Supplementary Fig. 6C). Our PLSR method identified two different clusters associated with PS clones (Fig. 6B and Supplementary Fig. 6D). Similar to the effect when individual treatments are applied, high SNHG25 was also associated with resistance in combination (Fig. 6C, E), but in contrast, CLDN1 no longer showed enrichment in the PS clusters. Additionally, SNCG was specifically associated with resistance in combination therapy (Fig. 6D, F). SNCG is a synuclein protein known as a marker for late-stage breast cancer41,42,43, implying that cells resistant to combination treatment reflect a cellular state found in tumors from late-stage patients.
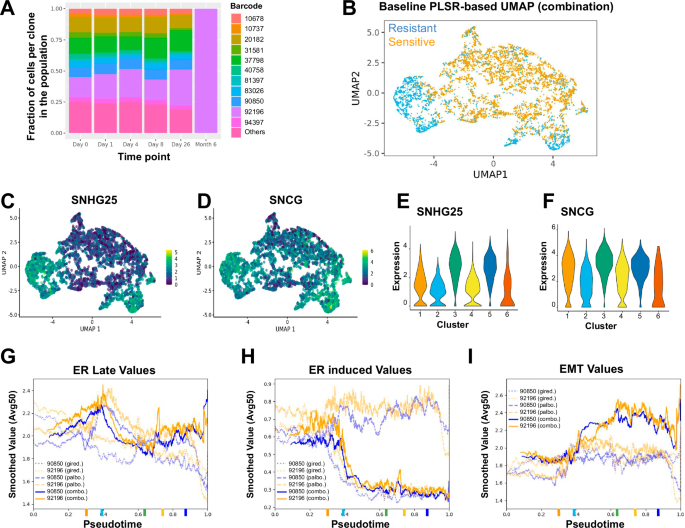
A Fraction of cells for clones with a minimum of 200 cells in the combination of giredestrant and palbociclib at different time points. B PLSR-based UMAP for baseline cells associated with outcome combination treatment. Positively selected (PS) cells are in blue and negatively selected (NS) in orange. C–D Gene expression in baseline cells was shown via UMAP from (B) for SNHG25 (C) and SNCG (D). E-F Violin plot of SNHG25 (E) and SNCG expression (F) in baseline cells. PS cells are in clusters 3 and 5 (see Supplementary Fig. 6C). G–I Gene set values for a PS clone (orange) and a stable clone (blue) plotted for palbociclib (faint, dashed lines), giredestrant (faint, dotted lines), and their combination (bold, solid lines) using sets Estrogen Response Late (G), ER induced (H), or Epithelial Mesenchymal Transition (I).
We then used TraCSED to characterize the dynamic selection process occurring in the combination treatment. Similar pseudotime distributions were observed across experimental time (Supplementary Fig. 6E), but there were differences in feature importance scores. Because the Estrogen Response gene set was important in the selection process for palbociclib alone and preceding higher E2F targets gene set value, we were curious to see the effect of suppressing ER signaling with giredestrant. In this combination treatment of palbociclib and giredestrant, we observed that both ER and E2F targets gene sets had lower values and showed reduced MAE values (MAE for ER gene set was 0.0278 for #92196 and 0.0306 for #37798; MAE for the E2F targets gene set was 0.0303 for #92196 and 0.0321 for #37798) in predicting the selection values of PS clones (Supplementary Fig. 6F, G) compared to what was observed for the palbociclib treatment (MAE for ER gene set was 0.0599 for #92196 and 0.0397 for #37798; MAE for the E2F targets gene set was 0.0663 for #92196 and 0.0406 for #37798). The decreased MAE in combination treatment from what was observed in palbociclib treatment shows that there is less dependence on the ER and E2F targets gene sets to predict selection. Similarly, EMT was low in PS clones under giredestrant treatment, but in the combination treatment all clones had similar EMT gene set value (Supplementary Fig. 6H).
While the combination treatment is overall more potent, one PS clone (#92196) still emerged after 6 months. Values for key gene sets such as “ Estrogen Response Late” (Fig. 6G), “ER induced” (Fig. 6H), or “EMT” (Fig. 6I) was not substantially different from a clone (#90850) that was outcompeted at 6 months. The lack of differentiation was consistent with our model. It indeed identified that the MAE for all features in either single-agent treatment was less important in the combination treatment (0.052) compared to the single-agent ones (0.062 for Giredestrant and 0.059 for Palbociclib). This suggests that the adaptive resistance was systemically decreased and not just limited to ER, E2F, and EMT features. Therefore, high baseline expression of the SNHG25 and SNCG genes found through PLSR-based clustering are the primary markers of positive selection for combination treatment and differentiate clone #92196 from the others (Supplementary Fig. 7A). While expression of SNHG25 and SNCG decreased at intermediate time points in cells from clone #92196, it remained higher than cells from other barcodes across all time points and fully recovered at 6 months, potentially reflecting an innate resistant state (Supplementary Fig. 7B). In conclusion, TraCSED is complementary to PLSR-based clustering for identifying different factors associated with adaptive and innate resistance. PLSR-based clustering highlighted markers of innate resistance that are consistent with late-stage cancer phenotypes, whereas TraCSED allowed us to identify vulnerabilities in adaptive resistance to single agent treatments that were addressed through combination treatment.
Discussion
Giredestrant and palbociclib, as single-agent, were partially effective in blocking proliferation of T-47D cells and resulted in a selection bottleneck as reflected by the reduction in the number of clones over time. This process was associated with changes in the transcriptomes of cells, in particular down-regulation of ER and proliferative signaling. However, some clones were PS, and differences were observed in the selection process between the two single-agent treatments (Fig. 2A–E). This positive selection can occur due to an innate resistance detectable in pre-treatment conditions or can be the result of an emerging adaptive resistance. To investigate these mechanisms, we developed a PLSR approach for finding markers of innate resistance (Fig. 1B–D), and a transformer-based model, called TraCSED, for finding dynamic markers of adaptive resistance (Fig. 1E–G).
We found that both unsupervised clustering and DE analysis comparing PS and NS clones of pseudobulked samples to study innate resistance were not effective in this study (Supplementary Fig. 2A, B). On the other hand, we found that a supervised clustering approach based on PLSR could properly balance intrinsic variability of the clone with phenotypic outcome and enabled us to isolate PS clones into a single cluster for giredestrant (Fig. 3A) and palbociclib (Fig. 3B). Clustering and pseudobulk analysis revealed markers unique to PS clones (Supplementary Fig. 2E) such as SNHG25 and CLDN1. In giredestrant and palbociclib treatments, SNHG25 was increased in the PS cluster and CLDN1 was decreased (Fig. 3C–F). SNHG25 is associated with a variety of cancers34,35,36,37, and is part of a family of long-noncoding RNAs (SNHGs) with multi-functional roles in cancer progression, particularly in EMT38. CLDN1 dysregulation is well-documented for its role in EMT and breast cancer, and has been used previously for subtyping different types of cancer such as the claudin-low basal subtype in breast cancer44. In addition, low CLDN1 levels correlate with breast cancer recurrence30,31,32,33. PCA-based clustering was not able to identify those genes (Supplementary Fig. 2F), and neither of these PS markers was found with pseudobulk DE (Supplementary Fig. 2F), demonstrating the value of PLSR in finding mechanisms of innate resistance.
In addition to innate mechanisms of resistance, we observed transcriptional changes in both PS and NS clones after treatment (Supplementary Fig. 3C–E). Because existing methods do not associate outcomes with temporal transitions, we developed TraCSED, a dynamic, context-aware and interpretable model composed of attention and convolution layers, to investigate mechanisms of adaptive resistance. The dynamic selection process is modeled for each clone across pseudotime (Fig. 1E–G; Fig. 4A, B) and highlights features important for the selection process. The EMT gene set had high importance and low value for PS clones in giredestrant treatment (Fig. 5B), suggesting EMT may be associated with resistance. In palbociclib treatment, there was high importance and increased value in the Estrogen Response Late feature (Fig. 5D) which preceded a subsequent increase in the E2F targets gene set value (Fig. 5E). Thus in both cases, TraCSED captured an adaptive resistance mechanism to each single-agent treatment. While our study may not identify all possible resistance mechanisms, TraCe-Seq and our analytical framework should highlight the most relevant ones. In particular, TraCSED can identify transient changes in the values of features linked to adaptive resistance, a dynamic insight that approaches based on DE between baseline and endpoint populations may not capture.
When combining giredestrant and palbociclib, only one PS clone survived after 6 months of combination treatment (Fig. 6A). Consistent with our hypothesis, the adaptive resistance mechanisms we identified with TraCSED in the single-agent treatments were no longer associated with a dynamic selection in the combination (Supplementary Fig. 6C–E). Additionally, the single surviving PS clone did not demonstrate ER activity or EMT differing from NS clones (Fig. 6G–I) as reflected by lower MAE values in the combination treatment than in the single-agent ones. Thus, only the high SNHG25 and high SNCG levels (Fig. 6C–F and S7) identified by the PLSR approach differentiated the PS clone from the NS ones suggesting that innate resistance mechanisms were driving resistance to the combination treatment. Increased SNCG is a known marker of resistance and late-stage breast cancer41,42,43, suggesting that the innate cellular state of these PS clusters may resemble a state found in late-stage tumors. While we elected to use the Hallmark gene sets as features for our modeling for compute efficiency, increased interpretability, and reduced noise, our modeling approach can also be applied at the gene level. In cases where data quality allows for gene-level analyses, TraCSED may be able to identify individual genes associated with resistance that may not be captured in gene set-level analyses.
Determining how a cell will respond to treatment and how it might develop resistance is an ongoing field of study. Here we developed a PLSR approach and the TraCSED model for determining markers of innate and, respectively, adaptive resistance. With PLSR, we were able to identify markers of positive selection, which were not found by traditional methods of pseudobulk and unsupervised clustering. Through TraCSED dynamic modeling we found gene sets associated with adaptive resistance, including increased ER activity in palbociclib treatment. We were then able to show that the adaptive resistance is reduced when palbociclib is combined with the ER antagonistic activity of giredestrant. Consistent with our hypothesis, our model identified that no feature was associated with an adaptive resistance in the combination treatment, leaving the innate resistance marker, SNHG25 and SNCG, found with the PLSR model, as the main features associated with PS cells. Altogether, our two complementary modeling approaches — PLSR-based clustering for innate resistance and TraCSED for adaptive mechanisms — contribute to study and characterize non-genetic sources of therapeutic resistance.
Methods
Datasets and dependencies
T-47D breast cancer cells were labeled with TraCe-Seq library as previously described22. A subculture was established from 300 cells to establish the input cell population. These 400 cells were expanded to 2 million cells total, and randomly distributed to the following treatment groups in replicates: 200 nM giredestrant treatment, 200 nM palbociclib treatment, and 200 nM giredestrant + 200 nM palbociclib combination treatment. Cells were trypsinized after 1, 4, 8, or 26 days of treatment and profiled by single cell RNA-sequencing using Chromium Single Cell 3’ Reagent Kits (10x Genomics). Baseline scRNA-seq profiling was obtained after 1 day of treatment in DMSO. In addition, for the combination treatment, cells were harvested and profiled after 6 months following exposure to both compounds.
Drug response
T-47D (female, adenocarcinoma from pleura) ER+ breast cancer cell lines were cultured using standard aseptic tissue culture techniques at 37°C in RPMI medium supplemented with 10% FBS, 2mM L-Glutamine (Catalog 10440, Sigma), 1X Minimum Essential Media, Non-Essential Amino Acids (MEM NEAA, Catalog No. 11140-0500, Thermo Fisher) and 1X Antibiotic-Antimycotic (Catalog No.15240-112, Thermo Fisher). Cell line ancestry was determined using Short Tandem Repeat (STR) profiling using the Promega PowerPlex 16 System. Cells were treated for 7 days with either 0.2 µM of giredestrant, 0.2 µM of palbociclib, or their combination and the relative number of viable cells was determined by CyQUANT (ThermoFisher, C7026). Growth rate normalization was performed28.
Single-cell analysis
For features, we used Hallmark gene sets39 and a select set of curated signatures. Single-cells were scored on their gene set value using the scuttle package in R45. Values across time and treatments are shown via violin plot. Additionally, PCA dimensionality reduction to 5 principal components, followed by UMAP plotting was used to view how cells’ transcriptomic features change throughout time in the different treatments.
Quality control
The number of clones present across time and treatment was plotted. Clones with 200 cells or more were displayed with a stacked barplot showing the various clones’ relative proportion across time and treatment (Fig. 2B). Clones were considered PS if the proportion of the cells increased relative to the population. All clones that did not have a total of 200 cells across time were combined and displayed as “other”. No bias in read counts between PS and NS clones or across treatments and time points was observed.
Partial least squares regression (PLSR)
Phenotypic comparison based on pseudobulk was performed with DESeq2 differential expression analysis46 on clonal response to treatment in which clones that increased over their baseline percentage by 26 days of treatment (resistant) were compared to those that were absent after 26 days (sensitive). Additionally, expression based PCA clustering was performed to group cells by similar transcriptomes.
For the PLSR method47, the endpoint selection value is included as a covariate for the dimensionality reduction of expression. The endpoint selection value is a ratio of the cells present after 26 days of treatment over the cells present at baseline. The first 5 components are then used to plot a UMAP representation of the data. Leiden clustering was then done at various resolutions. Pairwise distance of PS and NS cells was performed for both the PLSR and PCA methods to compare which is better at distinguishing the two states. To understand how the clones are distributed across the PLSR clusters, a heatmap displaying the fraction of the clone population in each cluster was plotted. Alongside the heatmap is included the increase (red) or decrease (blue) for each clone compared to pretreatment conditions for Days 1, 4, 8, and 26 after treatment (Supplementary Fig. 2D). Resistant clones were concentrated in a single cluster which was then compared to sensitive clusters via the findMarkers package by scran48. PS (blue) and NS cells (orange) were plotted as a UMAP. The top 10 PS markers were found by comparing the PS cluster vs all other clusters through findMarkers. These PS markers were then plotted via UMAP and violin plots.
Overview of the dynamic generative model
The fundamental steps of the generative modeling approach are (1) selecting an appropriate pseudotime trajectory representation of the data, (2) determining the selection values for each clone across pseudotime, (3) modeling the selection values of each clone, (4) evaluating the model for overfitting, and (5) assessing feature importance across time through permutations of the model. This method allows for the prediction of selection values, but its primary focus is to avoid overfitting and to create feature interpretability across time.
Selecting an appropriate trajectory representation
In order to model the single-cell selection value of a particular clone, cells must be ordered along a continuous trajectory with start and end points consistent with the experimental design. In this case the trajectory continuum is made using Slingshot pseudotime inference49. Selecting a representation that closely resembles the experiment is done through taking the TraCe-Seq data and (1) performing dimensionality reduction through PCA or PLSR, (2) producing Leiden clustered representations at various resolutions, (3) performing Slingshot inference with assigned start and end clusters and normalizing pseudotime, (4) selecting an appropriate pseudotime representation through a summation of KS statistics between TraCe-Seq time points. This results in a pseudotime representation that can be used for modeling clonal selection values.
The TraCe-Seq data is represented in both an unsupervised (PCA) and semi-supervised (PLSR) fashion for comparison. Leiden clustering is then performed on a series of resolutions between 0.2 and 1. Start and end clusters are then selected (based on consistency with the experiment and maximizing distance between start and end points) as input for each and used as input for Slingshot. The pseudotime inference produced by slingshot is then normalized on a 0–1 scale, where the first percentile of pseudotime is set as the minimum value, 0, and the ninety-ninth percentile of pseudotime is set as the maximum value, 1. Each of these normalized pseudotime series is then assessed via a KS statistic summation50, where the pseudotime distribution of Day 0 is compared to Day 1, Day 1 to Day 4, etc. The trajectory representation with the largest KS statistic summation is then selected and used for modeling clonal selection values.
Determining clonal selection values for modeling
Modeling resistance in an interpretable way begins with clonal selection values. With four different testing periods and a quality model fit being the utmost priority for interpretability, clones must have a minimum of 200 cells across time to be modeled. This left 11 clones across treatments which have sufficient cells. To make the selection value a dynamic metric, we map it across the pseudotime continuum. This is done by considering the proportion of cells for a clone A of interest within the population. At each pseudotime t that a cell exists, a calculation is made where the proportion of cells from clone A in the total population “ahead” of the cell of interest in pseudotime is divided by the proportion for A “behind” the pseudo time t (Fig. 4A) using the following equation:
The resulting selection value curve had strong variability at the beginning and end of the curve due to a smaller number of cells present at the extremes (Fig. 4B). To dampen the fluctuations, we fit a smoothing process through iteratively averaging 5 adjacent cells (Fig. 4D). Then, a boundary threshold is placed to preserve the regions of pseudotime with less than 0.15 max-normalized absolute change in selection value. For example, the proportion of cells from resistant clones increases over time, and the SV for such a clone is positive.
Framework and modeling design choices
Our primary objective is an interpretable model across pseudotime that avoids overfitting, whereas extrapolation beyond the experimental time is not of interest. Since the modeling is sequential and we want to evaluate the fit across the whole pseudotime, we decided to test our model on multiple intervals instead of only testing the end of the pseudotime. We withheld four intervals that represented 20% of the pseudotime for testing: [0.2–0.25], [0.45–0.5], [0.7–0.75], and [0.95–1] (Fig. 4C). Additionally, clones are trained and tested separate from each other to create individual models. This facilitates interpretability and keeps resistance mechanisms distinctive between clones.
Evaluation of the model
In order to evaluate the contributions of different aspects of the model, we employed three “control” approaches: regression, a transformer without convolutional layers, and a transformer without attention layers. Regression provides a simple baseline by which to assess whether the temporal context adds value to the model fit. Subtracting the convolution or attention aspects of the model, reveals the influence of these aspects’ importance to the architecture for generalizing an accurate learning rule from the data. These models are then assessed via mean squared error (MSE) on the testing data in the four time periods described above (Fig. 4E and S4). In addition, a metric of MAE was used to summarize the error for a given feature along a clonal selection curve through calculating the average error across the curves entirety when randomizing the values for the feature of interest.
Temporal importance of features through permutation
To assess the influence of features on the prediction of the selection value we used permutation feature importance40. In this approach we randomized a feature of interest 30 times and used the model with the altered feature to make a prediction. Changes in an important feature result in increased prediction error from baseline. For the 30 permutations of a feature, we compute the error at each pseudotime position to assess which features are important in predicting the selection value at specific pseudotimes. The mean error at each position is used in downstream analysis.
Interpretability of the model
As an example of how feature permutation provides interpretability to the model of dynamic selection in a particular clone, the true selection value curve was plotted (black) with the permuted model’s selection value prediction (Fig. 5A,C). Below this was the model importance scores for the permuted features with various smoothing factors (averaging the adjacent 20 or 150 scores). Ridge plots of the pseudotime distributions of real time were plotted to understand how the features found to be important can be attributed to periods within the experiment.
Mean error scores from each of the clone models were smoothed by averaging the adjacent 20 scores and plotted together. The value for the feature is also plotted along pseudotime with a similar smoothing process of averaging the adjacent 50 scores. In each of these plots, PS clones are shown in bold, dashed lines, and NS clones in faint, solid lines (Fig. 5B, D, E). This was done for the EMT, Estrogen Response Late, and E2F targets gene sets. To compare palbociclib, giredestrant, and combination treatment the values for a PS clone and a stable clone were plotted for EMT and ER gene sets. In these plots, the feature values of the PS clone (orange) is plotted for each of the three treatments across time with the value of the stable clone (blue) so that the two clones and treatments can be assessed (Fig. 6G–I).
Software availability
The code used for the TraCSED model and PLSR investigation of innate resistance in this paper can be found at https://github.com/Genentech/TraCSED.
Responses