Tumor suppressor BAP1 suppresses disulfidptosis through the regulation of SLC7A11 and NADPH levels

Introduction
BAP1 was originally discovered to be a protein that binds to BRCA1 and enhances its tumor suppressor activity, hence the name BRCA1-Associated Protein 1 [1]. Recent studies have shown that BAP1 is also involved in a variety of cell activities through its deubiquitination ability to achieve anti-tumor effects, which is independent of BRCA1 [2]. The ubiquitin carboxy-terminal hydrolase at the N-terminal of the BAP1 protein enables BAP1 to remove ubiquitin from the protein substrates. Based on this activity, BAP1 plays multiple roles in chromatin modification, DNA damage response, and regulation of cell cycle, cell proliferation, and cell death [3,4,5,6,7]. Mutations in BAP1 are frequently found in numerous human malignancies, such as uveal melanoma, malignant pleural mesothelioma, and clear cell renal cell carcinoma [8,9,10,11]. In addition, BAP1 germline mutations are closely associated with tumors such as mesothelioma and uveal melanoma, and such phenomenon is defined as “BAP1 cancer syndrome” [12].
Escaping cell death is the primary approach for tumor cells to achieve immortality, and BAP1 also exerts its tumor suppressor role by regulating cell death. Cell death can be divided into accidental cell death and regulatory cell death (RCD), of which apoptosis is the most widely studied type of RCD. In recently years, the discovery of new RCD types, including necroptosis, ferroptosis, etc., has provided strategies for the precision treatment of cancers [13]. BAP1 has been shown to initiate the apoptotic process by deubiquitinating IP3R3, or by interacting with protein 14-3-3 in neuroblastoma cells to promote Bax release [6, 14]. Our previous findings suggest that BAP1 is involved in the regulation of ferroptosis through deubiquitinating H2Aub at the promoter of the SLC7A11 [7]. The cystine/glutamate antiporter SLC7A11 is responsible for the import of cystine required for glutathione (GSH) biosynthesis. Ferroptosis is an iron-dependent form of cell death induced by the lethal accumulation of lipid peroxides in the cell membranes, and GSH detoxicates lipid peroxides to suppress ferroptosis [15]. Deubiqutinating of SLC7A11 by BAP1 leads to decrease SLC7A11 expression and ultimately to ferroptosis.
Recently, Liu et al. discovered a new mode of cell death regulated by SLC7A11, named disulfidptosis [16]. Distinguished from other known types of cell death, disulfidptosis is characterized by the aberrant accumulation of disulfide bonds within the cells. In cells with high SLC7A11 expression, high uptake rate of cystine requires large amounts of NADPH to provide reducing power to counteract disulfide stress and maintain cell survival. The cytosolic NADPH pool is mainly generated from glucose via the pentose phosphate pathway (PPP). And thus, glucose starvation leads to NADPH depletion, intracellular disulfide bond accumulation, and rapid cell death in SLC7A11 high-expression cells. In 2017, Dai et al. reported that BAP1 regulates apoptosis through endoplasmic reticulum stress (ER stress), and found that tumor cells with high expression of BAP1 were more resistant to glucose starvation-induced apoptosis [17]. But for now, BAP1 appears to be more likely to regulate disulfidptosis than apoptosis under glucose deprivation conditions.
Based on the above background, this study aimed to investigate and confirm if BAP1 has a regulatory effect on disulfidptosis upon glucose starvation, and whether the regulatory effect is controlled by SLC7A11-mediated cystine uptake. As the first study to report the regulation of BAP1 on disulfidptosis, the results in this article will expand the understanding of BAP1 in the regulation of cell death, and provide strategies for cell death-targeted tumor therapy.
Materials and methods
Cell culture study
The UMRC6 cell line was originally purchased from Sigma (#08090513, 2017), and has since been maintained and frozen in our laboratory. The HEK293T embryonic kidney cell line was obtained from the ATCC. Both cell lines were maintained in DMEM supplemented with 10% FBS, 100 units/ml penicillin, and 100 μg/ml streptomycin at 37 °C in a humidified incubator with 5% CO2. All cell lines used in this study were tested to be Mycoplasma-free annually. Special DMEM (glucose- and cystine-free) was customized from Quanxin Biotechnology (Xi’an, China). For glucose or cystine deprivation experiments, a certain amount of cystine or glucose was re-added to prepare the corresponding medium.
Reagents and antibodies
The following reagents were purchased from Sangon Biotech (Shanghai, China): D-Glucose (A501991), L-cystine (A610088), 2-Deoxy-D-glucose (2DG, A602241), N-Acetyl-L-cysteine (NAC, A601127). Z-VAD-FMK (T7020) and Necrostain 2 racemate (Nec-1s, S8641) were bought from TargetMol (Shanghai, China). Staurosporine (STS, HY-15141) was obtained from MedChemExpress (MCE, New Jersey, USA). Erastin (S7242), Liproxstain-1 (S7699), and Chloroquine (S6999) were obtained from Selleck (Huston, USA). The primary antibodies used for Western blotting were as follows: Drebrin (10260-1-AP) and β-Tubulin (66240-1-Ig) were bought from Proteintech (Wuhan, China). Filamin A (FLNA, A3738), FLNB (A2481), and MYH9 (A0173) were obtained from ABclonal Technology (Wuhan, China). BAP1 (#13271), PARP (#9532), Cleaved-Caspase-3 (#9661), LC3B (#3868), SLC7A11 (#12691) were purchased from Cell Signaling Technology (CST, Boston, USA).
Constructs and stable cell line generation
Human BAP1 and SLC7A11 cDNAs were cloned into the lentivirus vector pLVX-puro with N-terminal FLAG tag. The BAP1-C91A mutant was generated using PCR-based mutagenesis strategy. Gene knockout was performed by using sgRNAs and CRISPR/Cas9 technology. Guide RNA targeting human SLC7A11 was subcloned into lentiCRISPR v2 vector (#52961, Addgene). All constructs containing PCR fragments were confirmed by DNA sequencing. To generate stable cell lines, HEK293T cells were transfected with lentiviral constructs, together with packaging plasmids (Life Technologies, Carlsbad, USA) as the provider’s instruction. The lentivirus particles were collected and the target cell lines were then infected with polybrene transfection reagent (H8761, Solarbio, Beijing, China). Stable cell lines were screened out with puromycin (P8230, Solarbio) after virus infection.
Cell death/viability assays
To measure cell death, cells were seeded in a 12-well-plate before treatment. After designated treatment, cells were trypsinized and collected, washed with PBS once, and stained with 2 μg/ml PI reagent in PBS. Dead cells (PI-positive cells) were analyzed using a BD Accuri C6 flow cytometer (BD Biosciences). To measure cell viability, the Cell Counting Kit-8 reagent (CCK-8, K1018, APExBIO, Huston, USA) was used. In brief, cells were seeded in 96-well plates a day before treatment, after which the medium in each well was replaced with 100 μl of fresh DMEM containing 10% CCK-8 reagent. After 1-h incubation, the plates were read by a microplate reader (Thermo Scientific, Wilmington, USA) at an absorbance of 450 nm. The formula for calculating cell viability is shown below (AA: average absorbance): Cell viability (%) = [(AA of tested sample-AA of blank)/(AA of control-AA of blank)]*100.
Western blotting
Cell lysates were harvested by NP-40 buffer (150 mM sodium chloride, 1.0% NP-40, 50 mM Tris, pH 8.0). Subsequently, the cell lysates were treated by ultrasound, centrifugation, and the supernatants were collected to obtain protein samples. After protein concentration determination and denaturing (95 °C, 10 min), the same amount of protein was loaded on the SDS-PAGE gel, and the separated proteins were transferred to a PVDF membrane after electrophoresis for a period of time. Then, the membrane was blocked in 5% skim milk, followed by incubation of primary and secondary antibodies before visualization by an enhanced chemiluminescence system (Baygene Biotech, Shanghai, China).
For non-reducing Western blotting assays, protein samples were split into two aliquots after concentration determination. One of the aliquots was denatured with loading buffer without any reducing agent. Both of the two aliquots were incubated at 70 °C for 10 min.
NADP+/NADPH measurement
The NADP+/NADPH Assay Kit with WST-8 (S0179) was bought from Beyotime Biotechnology (Shanghai, China). The NADP+/NADPH measurement was conducted according to the manufacturer’s instructions. Briefly, Cells were treated and cell lysates were collected using extraction buffer followed by centrifugation. The supernatant was then divided into two parts, one of which was heated at 60 °C for 30 min to remove NADP+. Then both parts of the supernatant were transferred to a 96-well plate, and G6PDH working solution and chromogenic agent were added. NADP+ can be reduced to NADPH with the help of G6PDH, and NADPH can reduce WST-8 to formazan, so the amount of formazan produced can represent the amount of NADPH. The formazan amount was measured at 450 nm by a microplate reader. The formula for calculating NADP+/NADPH ratio is as follows (AA: average absorbance): NADP+/NADPH = (AA of unheated sample-AA of heated sample)/(AA of heated sample-AA of blank).
Real-time PCR
Cells were seeded in 6 cm plates and the total mRNA of each sample was extracted by using Trizol reagent (ABclonal, RK30129). Then, 2 μg of RNA was subjected to reverse transcription of cDNA by using ABScript III RT Master Mix for qPCR (ABclonal, RK21428). Real-time PCR was performed in a 20 μl reaction mixture system by using 2× Universal SYBR Green Fast qPCR Mix (ABclonal, RK21203). GAPDH was used to as internal control. The primer sequences used are listed in Supplementary Table 1.
Bioinformatic analysis
The gene expression and clinical data of kidney renal clear cell carcinoma (KIRC) used in the bioinformatic analysis of this study were obtained from the Cancer Genome Atlas (TCGA) database. Spearman’s correlation (two-sided) analysis was used to determine the expression correlation between BAP1 and NADPH-related genes, and the “ggplot2” R package was used to draw the plots. “ConsensusClusterPlus” R package was used for the consensus clustering analysis of 21 disulfidptosis-related genes (DRGs) based on the expression profiles. “Survival” R was used to analyze the survival differences between clusters. “maftools” R package was used to map the mutation profiles of BAP1 and DRGs.
Statistical analysis
Results consistently observed in at least three independent experiments were plotted as bar graphs with error bars representing mean ± SD. Comparisons between two groups were done with two-tailed Student t-test; comparisons among three or more groups were performed through Two-way ANOVA. Statistical analyses and graph plotting in this study were conducted by GraphPad Prism software, and significance was determined if P < 0.05.
Results
BAP1 suppresses disulfidptosis induced by glucose starvation
UMRC6, which is deficient in BAP1 gene expression, is an ideal cell line to study the role of BAP1 upon glucose deprivation. First, UMRC6 cell lines stably expressing BAP1, C91A mutant (lack of BAP1 DUB activity), and empty vector (EV) were constructed (Fig. 1A). As shown in Fig. 1B, C, UMRC6-EV cells died in a short period upon glucose starvation, and BAP1, rather than its mutant C91A, protected the cell death under this condition. Next, several known cell death inhibitors were used to figure out the cell death modality that BAP1-protected above. Apoptosis inhibitor Z-VAD, necroptosis inhibitor Nec-1s, ferroptosis inhibitor Liprox-1, and autophagy inhibitor CQ did not prevent cell death in UMRC6-EV and -C91A cells cultured in glucose-free medium, indicating that BAP1 protects a novel type of cell death upon glucose starvation (Fig. 1D). Dai et al. reported that BAP1 inhibited apoptosis under glucose starvation in UMRC6 cells [17]. We observed a similar phenomenon that the expressions of cleaved-PARP and cleaved-Caspase-3 were less upregulated in UMRC6-BAP1 cells than in UMRC6-EV and -C91A cells when they were treated with STS, an apoptosis inducer. While these apoptotic and autophagic markers were not found expressed in the three cell lines during a relative short period of glucose deprivation (Fig. 1E).

A Validation of the constructed BAP1 WT and BAP1-C91A overexpression in UMRC6 cell lines. B, C Restoring BAP1 WT instead of C91A protects cells from dying upon glucose deprivation. D, E Glucose deprivation induces a unique type of cell death in BAP1-low expression or C91A mutant UMRC6 cells. F Reducing and non-reducing Western blotting analysis of actin cytoskeleton proteins in UMRC6-EV, -BAP1, and -C91A cells upon glucose deprivation condition. The above treatments were terminated when glucose starvation caused significant death of UMRC6-EV cells. Z-VAD, 5 μM; Nec-1s, 2 μM; Liprox-1, 5 μM; CQ, 20 μM; NAC, 2 mM.
Recently, Liu et al. reported a novel cell death modality under glucose deprivation conditions regulated by SLC7A11, namely disulfidptosis [16]. Our previous study revealed that BAP1 could repress SLC7A11 expression by decreasing H2Aub occupancy on the SLC7A11 promoter in a DUB-dependent manner [7]. Here, we assumed that the cell death mode protected by BAP1 upon glucose starvation is disulfidptosis. To confirm our hypothesis, the non-reducing Western blotting assays were used to detect the tailing extent of actin cytoskeleton proteins. When the proteins are overloaded by disulfide bonds, their electrophoretic mobility will be affected under non-reducing conditions, which exhibits a slower migration and trailing band. In addition, the accumulation of disulfide bonds leads to excessive molecular weight of the protein and the inability to transmembrane. Therefore, if there is no trailing band, the reduces basal expression level of protein under non-reducing conditions also suggests excessive disulfide pressure. Under non-reducing conditions, following glucose starvation for about 6 h, actin cytoskeleton proteins including Drebrin, MYH9, FLNA, and FLNB showed significantly slower migration with smears in all the three UMRC6 cell lines. However, band trailing of these actin cytoskeleton proteins were less severe in UMRC6-BAP1 cells than in the other two cell lines (Fig. 1F). Together, BAP1, rather than its DUB-deficient mutant C91A, can rescue glucose starvation-induced disulfidptosis in UMRC6 cells, further demonstrating the importance of BAP1’s DUB activity in regulating disulfidptosis.
BAP1 regulates disulfidptosis through the inhibition of SLC7A11-mediated cystine uptake
We further studied the role of SLC7A11 in BAP1-mediated protection against disulfidptosis. First, we attempted to construct a stable cell line overexpressing SLC7A11 based on the UMRC6-BAP1 cell line. However, the BAP1 level decreased with the increase of the SLC7A11 expression level, indicating that SLC7A11 may also have a regulatory effect on BAP1 (Fig. 2A). SLC7A11 overexpression restored the sensitivity of UMRC6-BAP1 cells to glucose deprivation-induced cell death (Fig. 2B, C). Compared to BAP1 cells, the SLC7A11 overexpressed BAP1 cells showed an enhanced band trailing under non-reducing Western blotting condition upon glucose starvation (Fig. 2D). Subsequently, the SLC7A11 was knocked out in UMRC6-EV, -BAP1 and -C91A cell lines (Fig. 2E). With the knockout of SLC7A11, the inherent sensitivity of UMRC6-EV and -C91A cells to glucose starvation also disappeared (Fig. 2F). These results suggest that the protective role of BAP1 against disulfidptosis is through SLC7A11.
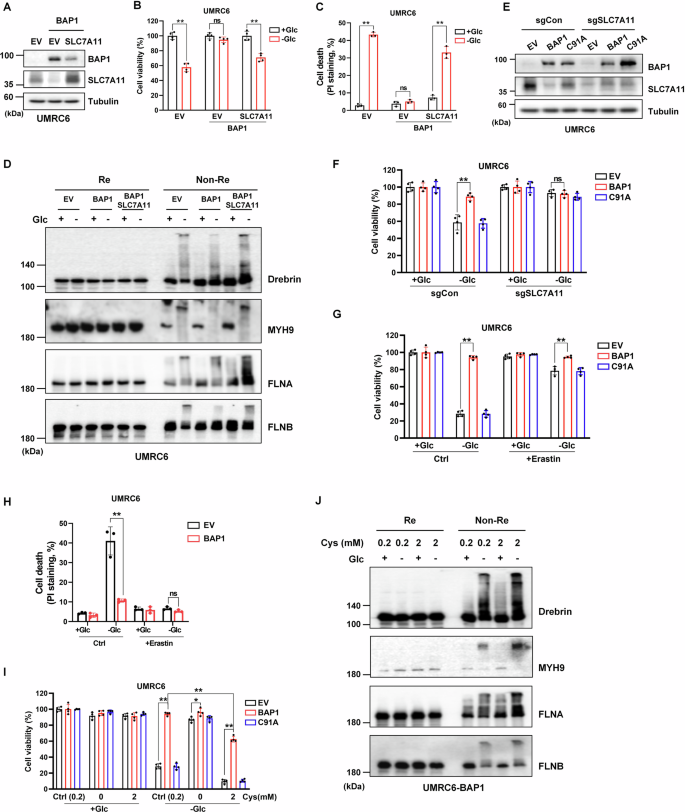
A Validation of BAP1 and SLC7A11 dual-overexpressed UMRC6 cell line. B, C SLC7A11 overexpression counteracts the protective role of BAP1 on UMRC6 cells upon glucose deprivation. D SLC7A11 overexpression enhances the actin cytoskeleton proteins tailing under non-reducing conditions in UMRC6-BAP1 cells upon glucose starvation. E Validation of SLC7A11 knockout in UMRC6-EV, -BAP1, and -C91A cells. F Knockout of SLC7A11 saves glucose starvation-induced cell death in UMRC6-EV and -C91A cells. G, H Erastin (10 μM) treatment saves disulfidptosis in UMRC6-EV and C91A cells upon glucose deprivation. I Cystine deprivation saves glucose starvation-induced cell death in UMRC6-EV and -C91A cells, while 2 mM cystine treatment enhances cell death in UMRC6-EV, -BAP1, and -C91A cells. J Cystine at 2 mM aggravated disulfide stress in UMRC6-BAP1 cells cultured in glucose-free and glucose-containing medium. The above treatments were terminated when glucose starvation caused significant death of UMRC6-EV cells.
SLC7A11-mediated cystine uptake plays a crucial role in promoting glutathione biosynthesis and suppressing ferroptosis. However, high rates of cystine uptake can cause aberrant accumulation of disulfide, leading to disulfide stress and even worse disulfidptosis [16]. It was mentioned in our previous work that restoration of BAP1, but not C91A, inhibits cystine uptake [7]. Thus, we sought to clarify the role of SLC7A11-mediated cystine uptake in BAP1-regulated disulfidptosis. As shown in Fig. 2I, J, cystine depletion rescued UMRC6-EV and -C91A cells from disulfidptosis upon glucose deprivation. While, cystine treatment at 2 mM enhanced disulfidptosis in both cell lines, and even induced disulfidptosis in UMRC6-BAP1 cells under glucose-free condition. High concentration of cystine not only aggravated disulfidptosis of UMRC6-BAP1 cells in glucose deficiency state but also increased the disulfide stress in the state of glucose supplementation. In addition, erastin, a selective inhibitor of SLC7A11 that is able to block SLC7A11-mediated cystine uptake, also saved UMRC6-EV and -C91A cells from disulfidptosis upon glucose starvation (Fig. 2G, H). Together, our data indicate that cystine uptake by SLC7A11 is indispensable in the BAP1-mediated disulfidptosis regulation.
BAP1 decreases NADP+/NADPH ratio within cells
Liu et al. highlighted the close relationship between NADPH depletion and disulfidptosis occurrence [16]. In SLC7A11 high-expression cells, the cystine uptake rate is increased, and the reduction of cystine to cysteine requires the consumption of NADPH. The PPP is the main source of intracellular NADPH. Upon glucose deprivation, the supply of NADPH in SLC7A11 cells was insufficient and the consumption remained high, resulting in the aberrant accumulation of intracellular cystine leading to increased disulfide stress and ultimately disulfidptosis. 2DG, a glucose analog, can mitigate SLC7A11-mediated disulfidptosis by supplying NADPH through PPP. In our study, 2DG reduced the NADP+/NADPH ratio upon glucose deficiency and correspondingly rescued cell death of UMRC6-EV and -C91A cells (Fig. 3A, B). Notably, the NADP+/NADPH ratio was less upregulated in UMRC6-BAP1 cells than in the other two cells lines upon glucose starvation, suggesting that its protective effect against disulfidptosis is partly achieved by regulating the NADP+/NADPH ratio (Fig. 3B). As exhibited in Fig. 3C, band trailing phenomenon was also reduced in 2DG-treatment groups. Notably, UMRC6 cells with high BAP1 expression showed lower NADP+/NADPH levels at a basal level, which may also help them resist disulfidptosis (Fig. 3A, D).
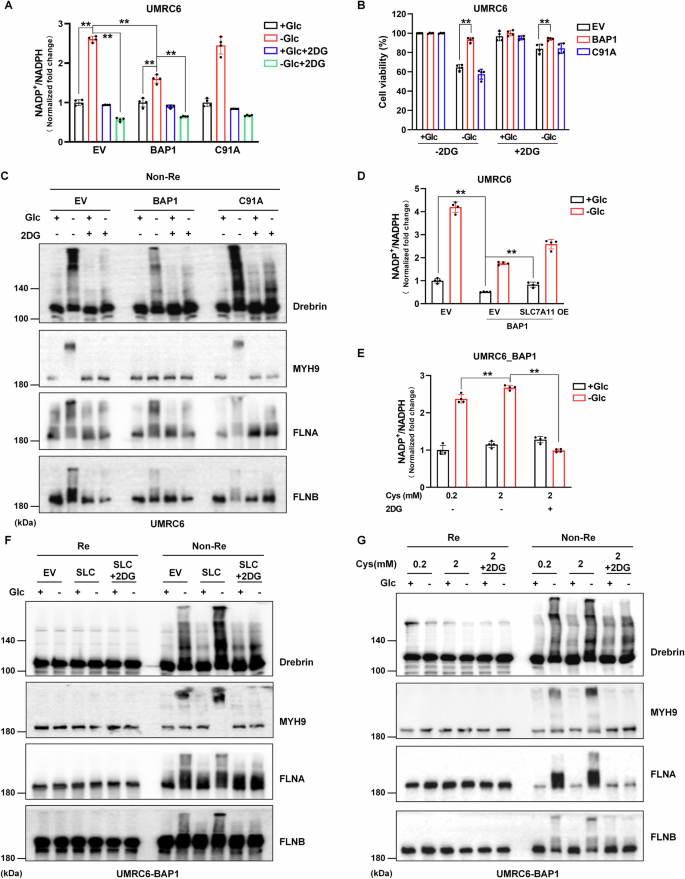
A Glucose deprivation upregulates NADP+/NADPH ratio in three UMRC6 cell lines (but to a lesser extent in BAP1 cells), and 2DG reverses the upregulation in this case. B 2DG rescues cell death in UMRC6-EV and -C91A cells upon glucose deprivation. C 2DG alleviates the actin cytoskeleton proteins tailing under non-reducing conditions in all three UMRC6 cell lines upon glucose starvation. D–G SLC7A11 overexpression (D, F) and 2 mM cystine stimulation (E, G) upregulate NADP+/NADPH ratio and intensify actin cytoskeleton proteins tailing in UMRC6-BAP1 cells upon glucose starvation, which can be rescued by 2DG treatment.
Subsequently, we further verified the regulation of BAP1 and SLC7A11 on NADP+/NADPH ratio. Both SLC7A11 overexpression and high-concentration cystine stimulation can increase the NADP+/NADPH ratio in glucose starvation conditions, which can be inhibited by 2DG treatment (Fig. 3D, E). The results of the non-reducing Western blotting experiment were consistent: 2DG alleviated SLC7A11 overexpression- or 2 mM cystine treatment-induced actin cytoskeleton proteins tailing in UMRC6-BAP1 cells upon glucose starvation (Fig. 3F, G).
Positive correlation between BAP1 and NADPH-related genes expression in KIRC patients
We divided KIRC patients into high- and low-BAP1 expression groups according to the median BAP1 expression level. The expression levels of NADPH-related genes in the two groups were shown in Fig. 4A, B. Except for GPX3, the remaining NADPH-related genes with significant differences were positively correlated with the expression level of BAP1. Subsequently, we used Spearman’s correlation analysis to analyze the correlation between BAP1 and NADPH-related genes, and intersected with the significantly differentially expressed genes in Fig. 4A, and a total of 13 genes were obtained (Fig. 4C). Next, we examined the expression levels of these 13 genes in the three UMRC6 cells, and found that the expression levels of DHFR2, G6PD, ME3 and GLUD1 in UMRC6-BAP1 cells were significantly higher than those in EV cells (Fig. 4D). NADPH provides high energy electrons for antioxidant defense and reductive biosynthesis. Pentose phosphate pathway (PPP) is essential for the recycle of NADP to NADPH in the cytoplasm and is therefore necessary to maintain the normal NADPH/NADP ratio. In addition, it’s also indispensable for mammalian dihydrofolate reductase (DHFR) activity and folate metabolism [18]. G6PD (glucose-6-phosphate 1-dehydrogenase) catalyzes the rate-limiting step of PPP and is regulated by the NADP+/NADPH ratio [19]. Studies have shown that G6PD deficient cells having impaired growth and oxidative defense because they fail to maintain a low NADP+/NADPH ratio [18]. DHFR is a key enzyme in folate metabolism. In most cell types, although folate metabolism does not produce substantial cytoplasmic NADPH, it can markedly promote the amount of mitochondrial NADPH [20]. Malic enzymes (MEs) catalyze the oxidative decarboxylation of L-malate and produce metabolites including NAD(P)H in the presence of divalent cations, among which ME3 presents the highest catalytic efficiency for NADP [21]. GLUD1 functions as a mitochondrial glutamate dehydrogenase that is strictly requires NADP+/NADPH as a cofactor to catalyze the conversion of L-glutamate into alpha-ketoglutarate [22]. The results above suggest that BAP1 may regulate NADP+/NADPH levels through transcriptional regulation of NADPH metabolism-related genes, yet to be further verified.
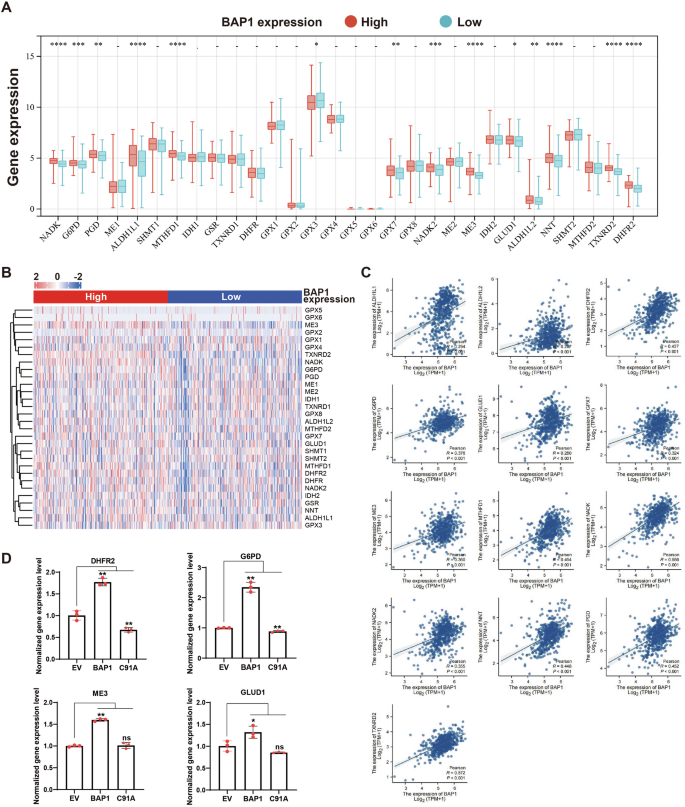
A Expression level of 30 NADPH-related genes in patients with RCC between BAP1 low and high groups (data from TCGA-KIRC). B Heatmap of the expression levels of NADPH-related genes in BAP1 high and low groups. C Correlation analysis of BAP1 and NADPH-related genes. D Expression levels of significantly differentially expressed NADPH-related genes in UMRC6 cells.
The expression level of BAP1 is correlated with disulfidptosis-related genes (DRGs)
Based on Liu’s publication [16], CRISPR/Cas9-mediated genome screening was utilized to investigate the genes involved in the regulation of disulfidptosis induced by glucose starvation. The top genes identified include GYS1, LRPPRC, NCKAP1, NDUFA11, NDUFS1, RPN1, and SLC3A2. Additionally, the paper identified genes expressing cysteine-containing peptides with disulfide bonds that increased at least 1.5-fold upon glucose starvation, as determined by high-performance liquid chromatography-mass spectrometry. The top genes in this category include ACTB, ACTN4, CAPZB, CD2AP, DSTN, FLNA, FLNB, INF2, IQGAP1, MYH10, MYH9, MYL6, PDLIM1, and TLN1. In total, these 21 genes were included in our study and termed disulfidptosis-related genes (DRGs). The expression levels of DRGs in the BAP1 high and low expression groups were shown in Fig. 5A, B. Of the 21 DRGS analyzed, except for NDUFA11, the remaining were positively correlated with BAP1 expression levels. Next, patients in TCGA-KIRC cohort were clustered into three clusters using a consensus clustering algorithm based on the expression data of 21 DRGs (Fig. 5C). In the Kaplan-Meier analysis of patients among the three groups, better survival outcomes were observed in cluster C1 patients (Fig. 5D). Besides, the expression of BAP1 in patients with C1 cluster was higher than that in the other two groups (Fig. 5E). These results reveal the positive correlation between the expressions of BAP1 and DRGs in patients with RCC. However, whether BAP1 regulates disulfidptosis through these DRGs remains further investigation.
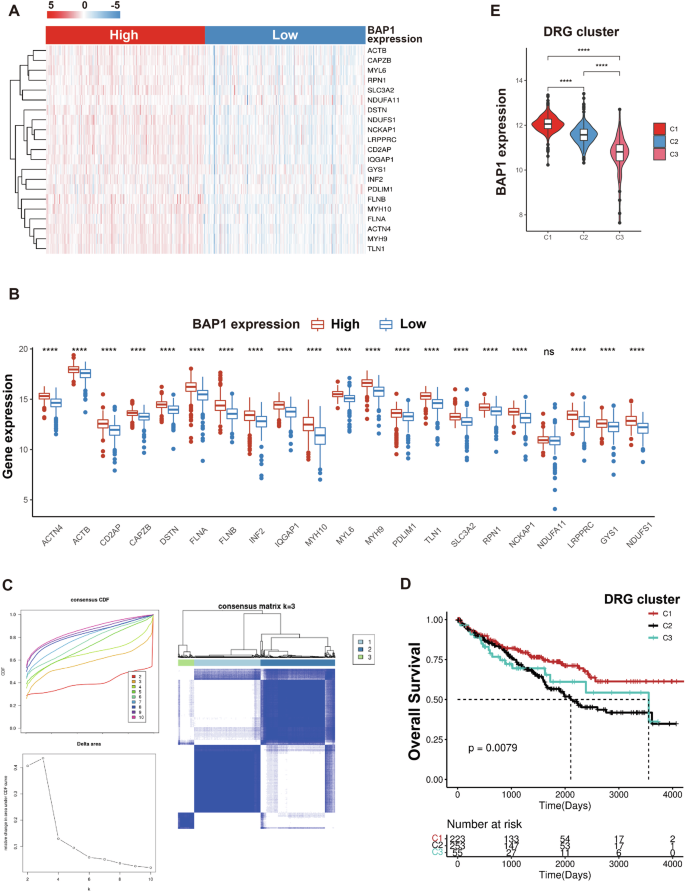
A, B Expression level of 21 DRGs in patients with RCC between BAP1 low and high groups (data from TCGA-KIRC). C The CDF distribution diagram and Delta area diagram of consistency clustering analysis shows the optimal κ Value, and the DRG clusters when κ = 3. D The overall survival of patients with RCC varied among different DRG clusters. E BAP1 expression levels in the three DRG clusters.
Correlation analysis between BAP1 and DRGs expression in RCC patients with or without cancer-associated BAP1 mutations
As a tumor suppress gene, BAP1 is involved in many physiological activities, such as normal DNA synthesis, interacting with transcription factors, deubiquitylation. There are more than 200 BAP1-mutant families, and individuals inheriting a BAP1 allele are tend to develop one or more malignancies during their lifetime [23]. We have revealed that BAP1 is positively correlated with the expression of DRGs in patients with RCC. Here, we want to further investigate whether there are differences in the expression of DRGs between RCC patients with BAP1 wild type (WT) and mutant (Mut), so as to clarify the influence of BAP1 mutations on DRGs. The pan-cancer analysis of the expression of BAP1 WT and Mut is exhibited in Fig. 6A. Of the 334 KIRC patients, 28 had a BAP1 mutation. Though, the expression level of BAP1 Mut was only slightly lower than that of WT. Patients with BAP1 Mut had worse survival outcomes than those with WT (Fig. 6B). We also compared the expressions of DRGs between BAP1 WT and Mut groups, and only the expressions of INF2 and FLNB were significantly different between the two groups (Fig. 6C). The waterfall diagram in Fig. 6D shows somatic mutations of BAP1 and DRGs, with the probability of BAP1 mutation up to 63.6%. In addition, 13 out of 21 DRGs existed mutation, and the mutation probability of LRPPRC, ATCN4, and IQGAP1 was relatively high. Together, the mutation status of BAP1 appears not to affect the levels of DRGs, indicating that BAP1 regulation of disulfidptosis might not be relevant to its tumor suppressive function.
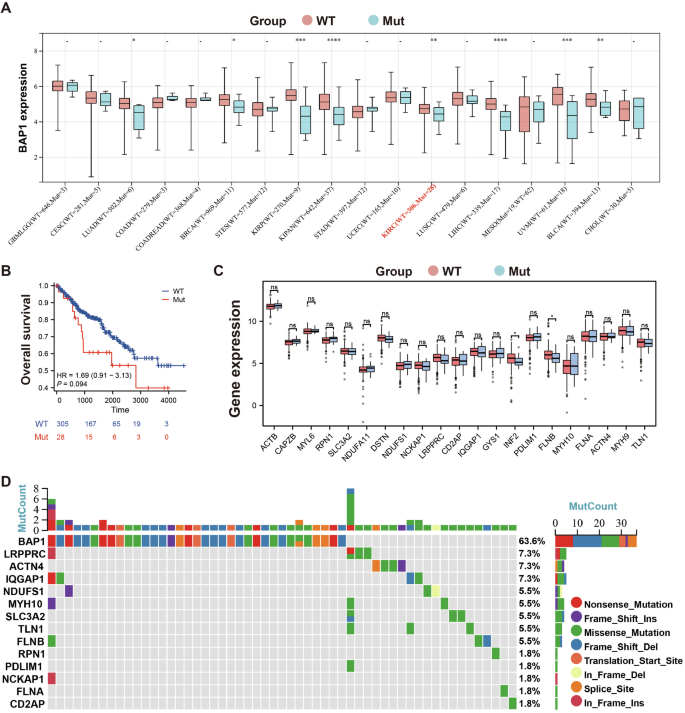
A Expression of BAP1 WT and Mut across different tumor types. B The overall survival of patients with RCC between BAP1 WT and Mut groups. C Expression level of 21 DRGs in patients with RCC between BAP1 WT and Mut groups. D The waterfall diagram shows somatic mutations of BAP1 and DRGs.
Discussion
In mammals, BAP1 acts primarily as an epigenetic modifier through H2Aub deubiquitination to regulate gene transcription at the genomic level. Loss of BAP1 or its inactive mutation results in the deregulation of cellular functions including cell cycle, DNA repair, metabolism or cell death [7, 24, 25]. Apoptosis and ferroptosis have been implicated in the physiological functions mediated by BAP1 before [6, 7, 14, 26], while this study is the first to demonstrate the role of BAP1 in the regulation of disulfidptosis. High SLC7A11 expression-mediated cystine uptake combined with glucose deficiency accelerates NADPH depletion within cells, resulting in the overwhelmed accumulation of disulfides, and leading to disulfide stress and ultimately disulfidptosis [27]. In the current study, we found that BAP1 could significantly protect disulfidptosis induced by glucose starvation, which is mediated by SLC7A11. Besides, high BAP1 expression showed lower NADP+/NADPH levels, which might confer resistance to disulfidptosis. Our research revealed the role of BAP1 in the regulation disulfidptosis and provided new insights into the understanding of disulfidptosis in tumor development.
The cystine/glutamate antiporter SLC7A11, which imports cystine for glutathione biosynthesis and antioxidant defense, has been found to promote tumor progression by suppressing ferroptosis. However, this comes at a significant cost to cancer cells that have high levels of SLC7A11 under glucose-deprived conditions, since it consumes large amounts of NADPH and results in disulfidptosis. According to our previous findings, BAP1 decreases H2Aub occupancy on the SLC7A11 promoter and represses SLC7A11 expression, thereby inhibiting cystine uptake and promoting ferroptosis [7]. Here, we found that BAP1 suppressed disulfidptosis through SLC7A11, and disulfidptosis might not mediate the tumor suppressive effect of BAP1. Although both modes of cell death are closely regulated by SLC7A11-mediated cystine uptake, ferroptosis, and disulfidptosis are two distinct cellular processes triggered by different conditions. Under normal conditions, cells with high SLC7A11 expression enhance cystine uptake to ensure GSH synthesis and antioxidant ability to resist the occurrence of ferroptosis. However, in the context of glucose deficiency, NADPH deficiency leads to the failure of cystine reduction, which ultimately leads to disulfide stress and disulfidptosis. Thus, it’s highly possible that disulfidptosis could occur in a specific genetic context in tumors. In addition to BAP1, any genetic alteration that leads to the upregulation of SLC7A11 should be prone to promote disulfidptosis under glucose deprivation condition. NRF2 is a transcription factor that mediates SLC7A11 transcription under oxidative stress [28]. NRF2 protein is unstable under basal conditions and is easily degraded by KEAP1 ubiquitination, so the expression of SLC7A11 is frequently upregulated in tumors with KEAP1 mutation. Indeed, lung cancer cells with KEAP1 deficiency are more sensitive to glucose starvation- or GLUTi-induced cell death, though not substantially studied yet, which might be disulfidptosis [29]. The underlying mechanisms mediating regulation of SLC7A11 and disulfidptosis in various tumors need to be further studied, which provides theoretical application for the treatment of tumors with the relevant genetic background such as BAP1 and KEAP1 deficiency using GLUTi.
Disulfidptosis is characterized by specific regulatory mechanisms that differ from other known types of cell death, such as glucose deficiency, cystine accumulation, and NADPH depletion. In this study, BAP1 inhibited glucose starvation-induced cell death and significantly reduced NADP+/NADPH ratio at the basal level, which might confer resistance to disulfidptosis. However, the underlying mechanism by which BAP1 regulates NADP+ and NADPH levels remains unclear. We analyzed the correlation between BAP1 and NADPH-related metabolic pathway genes and found that most of them were positively correlated. Whether BAP1 is involved in regulating the expression level of NADPH-related genes needs further study. Besides, glucose is the major source of NADPH generation. The metabolic flux of glucose should be explored to give a systemic view of the regulation of glucose and NAPDH metabolism by BAP1 in future study. In addition, it has been shown that BAP1 can also regulate ER stress upon glucose starvation [17]. Considering that ER stress is closely related to protein homeostasis, whether ER stress plays a role in BAP1-regulated disulfidptosis remains elusive.
In summary, our study demonstrates BAP1 regulation of disulfidptosis, which expands our understanding of the functional regulation by tumor suppressors. Furthermore, these results suggest an additional strategy for cancer therapy by targeting disulfidptosis through GLUT inhibitors within certain tumors.
Responses