Tuning a magnetic energy scale with pressure and field in UTe2
Introduction
Few systems in nature exhibit a fragile long-range magnetic order, where the thermal phase transition into its ordered state can be readily suppressed by either chemical substitution, magnetic field, or physical pressure. However, systems have been found, that undergo a quantum phase transition at a critical value of the tuning parameter1,2,3,4, deemed a quantum critical point (QCP). But the QCP is often putative, being hidden within a surrounding superconducting phase which is thought to be mediated by fluctuations affiliated with the magnetic order1. While the majority of magnetic unconventional superconductors are found near an antiferromagnetic instability, several uranium-based superconductors including URhGe and UCoGe coexist with ferromagnetism5, making them promising candidates for a topological spin-triplet superconductivity6.
Recently, UTe2 was identified as a new member of the U-based superconductor family6, with a transition temperature Tc reaching up to 2 K7. The normal state of UTe2 can be described by the Kondo lattice model where the localized magnetic moment of uranium is hybridized with the conduction electrons at low temperatures8. UTe2 does not magnetically order at ambient pressure, but the superconductivity in this paramagnetic heavy-fermion material is believed to be in the vicinity of a magnetic instability6. The application of pressures above 15 kbar (1.5 GPa) has shown signatures of magnetism9 which have recently been confirmed as long-range antiferromagnetic order10. Because of the relatively small energy scales of the superconductivity and magnetic order in UTe2, a rich phase diagram emerges when the system is subjected to external parameters, not unlike similar phase diagrams in many strongly correlated systems including heavy-fermion11, cuprate12, and iron-based13 superconductors. However, an intricate understanding of the competition and interplay between magnetism and superconductivity in UTe2 remains elusive, and the associated quantum criticality in the H–p–T phase space has not been fully explored.
In UTe2, electrical resistivity exhibits the behavior of a Fermi liquid in its temperature dependence above Tc for currents applied along all three crystallographic axes14. Whereas the resistivity along the a– and b-axis directions is consistent with typical incoherent-to-coherent crossover phenomena upon cooling as expected for a Kondo lattice at low temperatures, Eo et al.14 found a qualitatively different behavior in the c-axis transport which exhibits a pronounced local maximum around 12 K. An anomaly in dρa/dT14,15 (ρa stands for resistivity with I∥a) and χa (magnetic susceptibility with H∥a)16 was reported at the same temperature. The pressure evolution of χa was studied by Li et al.16, which exhibits a clear inflection point that moves to lower temperatures with increasing applied pressure. In contrast, χb exhibits a broad local maximum of around 35 K, and its pressure evolution is scaled with that of the metamagnetic transition field17. A similar peak in the electrical transport measurement was identified at 16 K in an unoriented sample18 and in a sample under applied pressure9. Other measurements – including heat capacity15, linear thermal expansion coefficient19, nuclear magnetic resonance20, and thermoelectric power21 – also exhibit a prominent feature near 12 K, a temperature scale which has been associated with a magnetic energy scale of ~1 meV based on thermodynamic measurements15. While there are varying views on the nature of magnetic fluctuations and their observation in UTe222,23,24, previous studies consistently point to this energy scale as being magnetic in origin, allowing the tracking of this feature in c-axis transport to be used as a unique tool to study the evolution of the magnetic fluctuation spectrum in UTe2.
Transport properties of UTe2 have been studied under various orientations of pressure and field9,17,25. In this work, we study its transport properties in a unique configuration with I∥c and H∥a where pressure- and field-tuning of the magnetic energy scale provide insight into the role of magnetism in unconventional superconductivity in UTe2. Furthermore, we elucidate the presence of quantum criticality in its rich phase diagram. By performing precision measurements of the electrical resistance R under applied pressures up to 17.4 kbar and in magnetic fields up to 18 T, we determine the pressure and field evolution of the characteristic magnetic energy scale, upper critical field, and power-law temperature dependence of the c-axis electrical resistance. Our results clearly demonstrate a unique method of studying a sensitive energy scale relevant to magnetic quantum criticality in UTe2.
Results and discussion
Figure 1 presents the applied pressure dependence of R(T) in UTe2 with electrical currents applied along the crystallographic c-axis. The measured single-crystal sample was grown by the chemical vapor transport method, showing a residual resistance ratio (RRR) of R(280K)/R(0K) = 5.6 and zero-resistance state at Tc = 1.6 K at ambient pressure (see “Methods” section for detail). In the absence of applied pressure (0 kbar), the R(T) curve exhibits the characteristic c-axis peak around 13 K as shown previously14, which monotonically moves toward lower temperatures with increasing applied pressures while Tc increases as reported previously25,26, reaching a maximum at p = 9.7 kbar (0.97 GPa) before decreasing rapidly. The resistive superconducting transition itself exhibits distinct features that evolve with pressure as shown in Fig. 1b. First, a small upturn appears just above the superconducting transition at pressures up to 9.7 kbar, which seemingly evolves from the relatively flat resistance at 0 kbar. A similar upturn was observed in prior electrical transport measurements with current applied in the (011) plane9. We note that the hysteresis behavior, previously observed in ref. 9, was not observed in this configuration in any H–p–T space studied in this work. Second, the superconducting transition narrows and becomes sharpest at p = 9.7 kbar, before broadening at higher pressures with a long tail just before the first-order transition to a magnetic phase occurs near p = 14.2 kbar (1.42 GPa). This feature was also observed previously9, and was shown to sharpen upon application of a magnetic field. At higher pressures, the peak in R(T) is diminished and a considerable increase in resistance occurs on cooling before an abrupt drop to finite resistance at the lowest measured temperatures. The low-temperature features found above 15 kbar have been previously associated with magnetic ordering16,26.

a shows resistance R of UTe2 measured with the electrical current applied along the crystallographic c-axis under various applied pressures up to p = 17.4 kbar (1.74 GPa). The schematic illustrates the electrical current I (red) direction with respect to the sample orientation (blue cuboid), see also Supplementary Fig. 1. The peak in R(T) monotonically moves toward the lower temperature with increasing pressure. The pressure evolution of the resistive superconducting transition is shown in (b) for pressure up to 14.2 kbar, above which zero resistance is not observed. c exhibits a phase diagram of the characteristic temperature scales (various symbols) of the system overlaid on a color contour presentation of the resistance R variation with pressure and temperature. The black (this work) and red19 circles represent the superconducting transition and the open squares indicate a shoulder-like feature observed in magnetic susceptibility χa16, which closely tracks the position of the maximum in c-axis resistivity (T*) plotted as open stars. The dashed line represents the suppression of the observed minimum of the thermal expansion coefficient, estimated by using a thermodynamic relationship of electronic Grüneisen parameter15, and the triangle and diamond symbols observed above 14.2 kbar are features attributed to magnetic ordering16,19.
The pressure-temperature phase diagram extracted from our c-axis resistivity measurements is presented in Fig. 1c as a contour plot, comparing the evolution of the resistivity magnitude with that of other measured quantities. The 3D surface plots of R(T, p) are available in Supplementary Fig. 2. The precise resistivity measurements tracking the properties of the peak offer a clear picture, particularly near the critical pressure. The zero-pressure c-axis peak decreases in temperature with increasing pressure at a rate of −0.6 K kbar−1, and the peak becomes narrower with pressure. Interestingly, the observed pressure-suppression rate of the peak is in excellent agreement with that observed for the a-axis magnetic susceptibility χa, which is −0.58 K kbar−116. Furthermore, Willa et al.15 estimated the pressure-suppression rate of the minimum thermal expansion coefficient along the c-axis from the thermodynamic Grüneisen parameter to be −0.4 K kbar−1, which also tracks the resistivity features as shown in Fig. 1c. Evidently, the pressure evolution of the c-axis peak closely tracks both the χa feature as well as the Grüneisen parameter, strongly suggesting all features have a common magnetic origin with an energy scale associated (inversely) with the strength of the fluctuation spectrum. The observed relationship between a decreasing magnetic energy scale and strengthened superconductivity is consistent with a competitive relation, supporting the picture of magnetically mediated superconductivity in UTe2.
Applying a magnetic field at each applied pressure reveals the field evolution of R(T) from 5.3 kbar to 14.2 kbar, where the c-axis peak remains as a pronounced local maximum but is strongly tuned by the magnetic field. The schematic of the sample with the directions of current and field is presented in Supplementary Fig. 1. As shown in Fig. 2a–e, increasing the magnetic field broadens the c-axis peak and increases its temperature position, while also invoking a shallower temperature dependence of the resistance with increased curvature. The broadening of the peak with the field is similar to what was observed previously at ambient pressure27, but is contrary to the opposite trend observed with the field applied along the magnetic hard axis (b-axis)27,28. To characterize this trend, we define T* and R* as, respectively, the temperature and resistance values at the c-axis peak for each pressure and field value, with the latter representing the field evolution of the absolute low-temperature scattering rate at each pressure. We note that the asymmetric nature of the c-axis peak, which is likely due to a convolution of scattering rates with different profiles (e.g., spin fluctuations and phonons), makes the precise determination of its field evolution difficult. The similar broadening caused by increasing field and decreasing pressure suggests an intrinsic characteristic temperature scale that can be used for analysis. Furthermore, its near-equal evolution with the measured susceptibility feature in Fig. 1c suggests it has a common origin. The field-dependent T* and R* values show common features under all applied pressures with H∥a, as shown in Fig. 2f–g. While T* increases with increasing field and approaches a linear trend, R* generically decreases with increasing field, except for a saturated evolution at low fields in the vicinity of the magnetic order transition. The trends are characterized by plotting the rate dT*/d(μ0H) (determined between 6 T and 18 T) and ∣R*(18T) − R*(0)∣ in Fig. 2h, which show nearly linear increase and decrease with pressure, respectively. The observed field dependence of T* is in stark contrast to the case with H∥b28, which narrows and shifts the peak to lower temperatures on the increasing field. Together with previous work27,28, our results may support a recent 5f 2 crystal-field model29 that predicts the Schottky-like features observed in transport and thermodynamic quantities, assuming an anisotropic Zeeman interaction where the energy separation depends on the field orientation, and inelastic scattering that is proportional to the population of the excited spin states. The coupling coefficient of the magnetic energy with pressure can be deduced from our experiments presented in Fig. 1, and it is 0.6 K kbar−1 at ambient pressure, which is consistent with a thermodynamic consideration15. The coupling coefficient with the magnetic field can be inferred from Fig. 2h, which is 0.6 K T−1 and 0.83 K T−1 at 5.3 kbar and 14.5 kbar, respectively.

a–e show the field evolution of R(T) with applied pressure and fields applied along the a-axis, in the temperature range where the data exhibit a peak that evolves very sensitively with both pressure and magnetic field. Defining T* and R* as, respectively, the temperature and resistance at the maximum in R(T), f–g show the field dependence of these characteristic values to exhibit common features under all applied pressures. The numerical values of T* presented in (f) are available in Supplementary Table I. The pressure evolution of the rate of increase of T* with field, dT*/dH, is plotted in (h) (left vertical axis), together with the total field variation of R*, ∣R*(18 T) − R*(0)∣ (right vertical axis).
The application of pressure also affects the upper critical field Hc2(T) by inducing an unusual low-temperature non-monotonic increase of Hc2(T) at pressures of 5.3 kbar and higher, and reentrant behavior at 14.2 kbar as shown in Fig. 3a. The Hc2(T) curves were determined from R(T) measurements with the electrical current along the c-axis and the magnetic field applied parallel to the a-axis under applied pressure up to p = 14.2 kbar. We used the zero-resistance criteria for the superconducting transition temperature Tsc in the field. While the Hc2(T) curve without the applied pressure exhibits a smooth variation, the application of pressure drastically changes the shape of the superconducting H–T phase lines. Near Tc, the slope of Hc2(T) increases by almost five-fold under p = 9.7 kbar, and it slightly decreases at 11.8 kbar, see Fig. 3c, consistent with the previous results17,25. As was shown previously9, the application of 14.2 kbar induces reentrant behavior of superconductivity. The large slope change of Hc2(T) at Tc with pressure indicates a significant variation in the orbital limiting Hc2(0)30. However, the overall observed Hc2(T) at the lowest temperature remains between 6 and 10 T as shown in Fig. 3a. When the field-driven superconducting to normal state transition occurs due to the orbital limiting effect, Hc2(0) can be estimated from the slope of Hc2(T) at Tc with a relation, ({H}_{HW}=-lambda {T}_{c}{H}_{c2}^{{prime} }({T}_{c})), proposed by Helfand and Werthamer (HW)30. Here λ ≈ 0.73 and 0.69, which correspond to the clean and dirty limits, respectively30,31. Alternatively, spin-singlet superconductivity can be suppressed due to the Zeeman energy contribution of Pauli paramagnetism, and the limiting value HP can be estimated by the relation, ({H}_{P}={Delta }_{0}/sqrt{2}{mu }_{B}). Here Δ0 and μB are the magnitudes of the superconducting energy gap at zero temperature and the Bohr magneton, respectively. For a weak-coupling Bardeen-Cooper-Schrieffer superconductor, μ0HP = αTc where α ≈ 1.87 T K−132, which is consistent with the gap energy of Δ0 ~0.25 meV observed in scanning tunnel microscopy experiments33.

a shows the temperature-dependent upper critical field Hc2(T) under various applied pressures with a field H applied along the a-axis. We used the zero-resistance criteria for the superconducting transition temperature Tsc in a magnetic field. b compares the extracted zero-temperature experimental Hc2(0) values (red circles) to the calculated orbital limiting field, HHW (blue triangles), and the paramagnetic limiting field, HP (black squares). See text for definitions of HHW and HP. The experimental Hc2(0) values are determined by extrapolating the Hc2(T) curves to zero temperature. The numerical values of the presented data in (a–c) are available in Supplementary Table 2. c shows the pressure evolution of HHW/Hc2(0) and HP/Hc2(0). d–h present the relation between the anomalous behavior Hc2(T) (red circles) and the width of the superconducting phase transition ΔTsc/Tsc (blue triangles).
We compare the experimental Hc2(0) to both limiting fields, HHW and HP, in Fig. 3b. We note that HHW is ill-defined under 14.2 kbar because of the reversed sign of ({H}_{c2}^{{prime} }({T}_{c})), i.e., reentrant superconductivity. Figure 3c shows the pressure evolution of HHW/Hc2(0) and HP/Hc2(0). While HP remains less than Hc2(0), indicating non-singlet pairing, HHW exhibits a substantial variation. The large HHW prediction is generally evidence for the heavy-fermion normal state34. The pressure evolution of HHW, which exhibits a significant enhancement around 10 kbar, indicates increasing effective mass with pressure. However, the orbital limiting effect is interrupted, and the largest discrepancy between Hc2(0) and HHW is observed at 9.7 kbar where the highest Tc is observed. A similar effect was observed in other heavy-fermion superconductors near quantum criticality34, suggesting the existence of a QCP near 10 kbar (1 GPa). At low temperatures, a drastic slope change appears under pressure between 5.3 and 11.8 kbar. The slope change in UTe2 was previously reported by Aoki et al., which was attributed to the existence of other superconducting phases25. Similar Hc2(T) behavior was reported by Kasahara et al. in FeSe35, which was attributed to the Fulde–Ferrell–Larkin–Ovchinnikov (FFLO) state36,37,38.
We found the width of the superconducting phase transition in resistivity is closely related to this anomalous behavior in Hc2(T). To shed light on the origin of this feature, we determined the field-dependent transition width compared to the Tsc that is determined at zero resistivity, ΔTsc/Tsc. For all studied pressures, ΔTsc/Tsc exhibits strong enhancement where the sudden slope change occurs as shown in Fig. 3d–h. Defining H* as the field value where the slope of Hc2(T) changes, we observe that ΔTsc/Tsc decreases above H* under p = 7.5, 9.7, 11.8 kbar where the low-temperature data above H* are available. A broad superconducting transition is usually associated with inhomogeneity19,39,40 or a filamentary superconducting state. However, the systematic field dependence rules out these simple scenarios, suggesting this is rather associated with the competing order parameters and quantum criticality leading to anomalous transport properties.
Whereas Fermi liquid behavior is routinely manifested in normal metals as a quadratic temperature dependence of resistivity due to electron-electron scattering, a sub-quadratic exponent is a well-known signature of unconventional scattering usually attributed to strong spin fluctuations near a magnetic quantum critical point1,2,11,12,13,34. Below, we investigate the field and pressure evolution of the power-law temperature dependence of ρc in UTe2. Because of the limited temperature range between Tc and T*, we employ a double-logarithm fitting routine commonly used9,26 to produce contour plot phase diagrams to display the general trends as well as power-law fits to R(T) = R(0) + ATn to study the trends with field and pressure. Figure 4a–e present the phase diagrams for each applied pressure determined by the field-dependent exponent n* of R(T) determined using the relation ({n}^{* }=d[log (R(T)-{R}_{0})]/d[log T]). R0 is the residual resistance at T = 0 and is estimated by extrapolating the R(T) tail assuming a power-law behavior of R(T) in the low-temperature limit. Provided R0 is accurately determined, n* is equivalent to the power-law exponent n in R(T) = R0 + ATn, yielding a continuous approximate measure of the temperature power-law exponent of R(T). In previous reports, the a-axis resistivity of UTe2 was shown to remain quadratic in temperature (i.e., Δρa~ATn, with n = 2) for magnetic fields applied along both a– and b-axes up to 40 T, with the coefficient A significantly enhanced near a 35 T b-axis field41 but retaining Fermi liquid (FL) behavior. Linear in temperature (i.e., n = 1) resistivity was reported by Thomas et al.26 in the a-axis transport at low temperatures around 13 kbar. For c-axis resistivity, Eo et al. reported quadratic FL behavior in the absence of both field and applied pressures14. As shown in Fig. 4, R(T) exhibits the Fermi liquid behavior (red) just above Tc under 5.3 kbar in zero field, but the exponent n* decreases toward n* = 1.5 (yellow) with increasing field near Hc2(0). Under 7.5 kbar and 9.7 kbar, while the c-axis transport exhibits the non-Fermi liquid behavior near Hc2(0), the Fermi liquid behavior (red) is recovered at high fields between 15 T and 18 T. Under 11.8 kbar and 14.2 kbar, the exponent reaches n* = 2.5 (brown) at high fields.
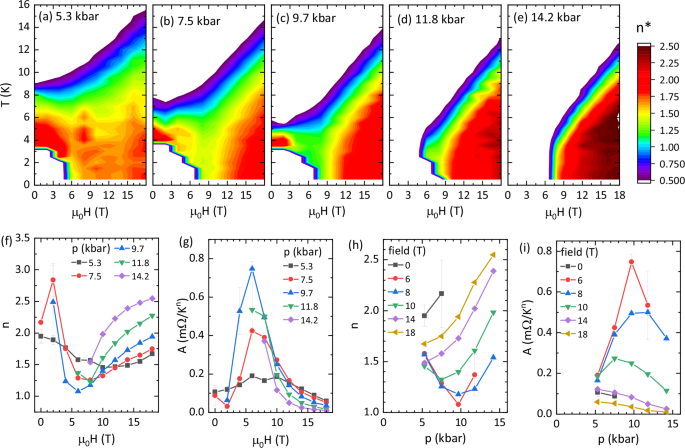
a–e show the field-dependent exponent n*, representative of the power-law exponent of the temperature dependence of c-axis resistance R(T) for fields applied along the a-axis, determined using the relation ({n}^{* }=d[log (R(T)-{R}_{0})]/d[log T]). At 5.3 kbar, n* exhibits Fermi Liquid behavior (i.e., n* = 2, shown as yellow coloring) just above Tc near zero field, but decreases toward n* = 1.5 (light green) with increasing fields and decreasing temperatures. To quantify the trends, least-squares fitting of selected R(T) using the relation R(T) = R(0) + ATn to the experimental data with T ≤ T*/2 yield values for the extracted power-law exponent n and corresponding temperature coefficient A, summarized as a function of the field in (f, g) and pressure in (h, i). The numerical values of n and A are available in Supplementary Tables 3 and 4, respectively.
We also performed least-squares fits on selected R(T) curves by fitting our data to the relation R(T) = R(0) + ATn with T ≤ T*/2 well away from the c-axis peak, selecting pressure and field values with the widest temperature ranges available. The field evolution of n and A are summarized in Fig. 4f, g, and pressure evolution in Fig. 4h, i. For p = 5.3 kbar, n = 2 in zero field but smoothly decreases with increasing field, showing a minimum value of n = 1.5 near 10 T. It weakly increases at high fields while remaining sub-quadratic up to the highest fields measured. For higher pressures between 7.5 and 11.8 kbar, n exhibits a more drastic decrease with a minimum near 7 T where the Hc2(T) changes the slope. At higher fields, n increases substantially to about 2.5 for 11 kbar and 14.2 kbar. The extracted A-coefficient appears to correlate inversely with the trends in the power-law exponent, with a dip in n and a peak in A at a field near the suppression of the superconducting state being typical for a system at or near a quantum critical point. To directly visualize the power-law evolution, we plot R(T) under selected fields and pressures that exhibit the most striking non-Fermi liquid behavior in Fig. 5. It is clear that the T2 behavior at ambient pressure (Fig. 5a) evolves rapidly as a function of pressure and magnetic field to exhibit a nearly linear behavior under p = 9.7 kbar and μ0H = 8 T (Fig. 5d). Our power-law results with a unique current-field configuration can be directly compared to that reported in previous works9,26,27,28, providing clear indications of quantum criticality in UTe2.

Power-law behavior in a magnetic field and under pressure is shown for a 0 kbar with 0 T, b 5.3 kbar with 10 T, c 7.5 kbar with 8 T, and d 9.7 kbar with 8 T. The direct comparison between (0 kbar, 0 T) and (9.7 kbar, 8 T) curves can be found in Supplementary Fig. 3.
Conclusions
In conclusion, we investigated the tuning of a magnetic energy scale with applied hydrostatic pressure and magnetic field along the a-axis as complementary (and opposing) tuning parameters in the heavy-fermion superconductor UTe2 in the vicinity of a long-range magnetic ordering. Strong spin fluctuations manifest as a pronounced local maximum at low temperatures, which is identified as a peak in the c-axis electrical transport. Upon increasing pressure, the characteristic c-axis peak moves to a lower temperature before vanishing near the critical pressure of 15 kbar (1.5 GPa). The application of a magnetic field shifts the peak to a higher temperature and broadens the peak under all studied pressure values. The power-law behavior of the c-axis transport is also significantly affected by the application of pressure and field where the non-Fermi liquid behavior is most pronounced around 9.7 kbar and 7 T, exhibiting nearly linear in temperature resistivity and an enhanced pre-factor. These signatures in c-axis transport are a revealing indication of an incipient magnetic order that has a strong influence on the physical properties and possibly superconductivity. Our results provide a measurement of the pressure and field evolution of the magnetic energy scale relevant to quantum criticality in UTe2 and shed light on its influence on unconventional superconductivity.
Methods
Sample preparation
Single crystals of UTe2 were synthesized by the chemical vapor transport method using iodine as the transport agent. Elements of U and Te with an atomic ratio of 2:3 were sealed in an evacuated quartz tube, together with 3 mg cm−3 iodine. The ampoule was gradually heated up and held in the temperature gradient of 1060/1000 °C for 7 days, after which it was furnace-cooled to room temperature. Samples used in this study were obtained from the same synthesis batch as used in the study of Hayes et al.42.
Transport measurements under pressure
A UTe2 single-crystal sample with an onset Tc ≈ 1.78 K was prepared for transport measurements by soldering electrical leads with gold wires. The typical contact resistance is less than 1 Ω. The transport data were taken with a fixed current of 100 μA. A nonmagnetic piston-cylinder pressure cell was used for measurements under pressure up to 17.4 kbar, with Daphne oil 7373 as the pressure medium. Transport measurements were performed in a commercial 3He cryostat system with a base temperature of 300 mK, which is equipped with a superconducting magnet. The current was applied along the crystallographic c-axis. The RRR of the sample used in the current study is R(280 K)/R(2.2 K) = 4.27 or R(280 K)/R(0 K) = 5.57. Here R(0 K) was determined by extrapolating with a power-law function, R(T) = R(0 K) + ATn. The magnetic field up to 18 T was applied along the a-axis, perpendicular to the current. The pressure produced on the single-crystal sample at low temperatures was calibrated by measuring the superconducting transition temperature of lead placed in the cell. The known pressure dependencies of the superconducting transition temperature of Pb9,43 were used for this purpose.
Responses