U shaped relationship between mean arterial pressure and 28 day mortality in ICU patients with acute myocardial infarction

Introduction
Mean arterial pressure (MAP) is a key hemodynamic indicator of the body’s perfusion status, and extensive research has emphasized its critical role in the prevention and management of various cardiovascular diseases1,2,3,4. In patients with coronary artery disease, MAP has been shown to predict overall mortality risk, emphasizing its prognostic value in different cardiovascular diseases5. Turning our attention to acute myocardial infarction (AMI), a severe cardiovascular disease, involves complex mechanisms and multiple pathological processes6,7. When these patients are admitted to the Intensive Care Unit (ICU), their conditions are often complex and unpredictable. The basic cause of AMI is coronary atherosclerosis, which causes acute occlusion of the lumen, leading to sustained and severe myocardial ischemia, ultimately resulting in myocardial necrosis. Active treatment interventions and targeted prevention for high-risk populations are of great significance for reducing the incidence and mortality of AMI.
Mean Arterial Pressure (MAP) plays a vital role in the progression of AMI. Studies indicate that maintaining an appropriate MAP level is crucial for improving the prognosis of AMI patients8,9,10. In the early stage of AMI, due to acute myocardial ischemia and necrosis, the pumping function of the heart is impaired, leading to a series of hemodynamic disturbances. In addition, relevant guidelines at home and abroad for acute myocardial infarction show that early blood oxygen saturation, mean arterial pressure, left ventricular ejection fraction and short-term prognosis are closely related, and cardiogenic shock is related to the degree of coronary anterior flow-related artery involvement and myocardial infarction area. Emergency PCI can effectively increase blood oxygen saturation, improve myocardial compliance in patients with cardiogenic shock, and improve left ventricular ejection fraction11,12.
Although the importance of MAP is recognized, there are still many controversies and gaps regarding the exact quantitative relationship between MAP and the 28-day mortality risk in AMI patients admitted to ICUs in the United States. this research utilized the eICU database from the Philips Healthcare eICU project. This retrospective, multi-center cohort study included a relatively large sample of patients with acute myocardial infarction (AMI). We implemented strict controls for confounding factors and applied rigorous statistical analysis methods to explore the potential association between Mean Arterial Pressure (MAP) and 28-day mortality risk. The primary aim of this study was to identify the MAP range associated with the lowest risk of mortality. We hope to provide a stronger theoretical basis for optimizing the clinical management strategies and improving the prognosis of such patients.
Materials and methods
Data source
The eICU database was developed through a collaboration between the Laboratory for Computational Physiology (LCP) at the Massachusetts Institute of Technology (MIT) and the Philips eICU Research Institute13. It was released in May 2018 through a stratified random sampling method involving 335 units from 208 hospitals across the United States, and is currently updated to version 2.0 key points about the eICU database: Website: https://eicu-crd.mit.edu/. It includes data from 139,367 patients admitted between 2014 and 2015, totaling 200,859 ICU admissions. Patient information is collected. The database encompasses various types of ICU data, such as cardiac ICUs, cardiothoracic surgical ICUs, medical ICUs, surgical ICUs, and neurosurgical ICUs. All data were automatically stored and electronically retrieved through the Philips Healthcare eICU program. The eICU Collaborative Research Database has been used for observational studies14,15.
Access to this database requires passing an exam and obtaining certification in compliance with the PhysioNet Institutional Review Board’s data use agreement. Approval for data access was facilitated through exemption approval from the MIT Institutional Review Board (our record ID: 62661740). The database release complies with the Health Insurance Portability and Accountability Act (HIPAA) Safe Harbor provisions. Data access is granted upon completion of the Collaborative Institutional Training Initiative (CITI) ‘Data or Specimens Only’ research project. Since this is a retrospective analysis based on an anonymous database provided to researchers, the MIT Institutional Review Board waived the need for ethical approval from a local ethics committee. Also, due to the retrospective nature of the study, the MIT Institutional Review Board waived the need of obtaining informed consent from all subjects and/or their legal guardian(s). The research throughout the study ensures alignment with the Helsinki Declaration and adheres to STROBE guidelines. The datasets are not publicly available and access is restricted following the above-mentioned strict procedures.
Study population
This study is a multicenter retrospective cohort study. Patients diagnosed with acute myocardial infarction according to the International Classification of Diseases, 9th Revision criteria upon ICU admission were included. the AMI was based on the ICD-9 code 410 from the eICU-CRD. The definition of AMI16 holds when there’s evidence of acute myocardial injury, along with clinical signs of acute myocardial ischemia, and a rise and/or fall in cardiac troponin (cTn) levels. At least one cTn value should exceed the 99th percentile upper reference limit (URL). Also, the diagnosis is further supported by one or more of these: symptoms of myocardial ischemia, new ischemic changes on the electrocardiogram (ECG), appearance of pathological Q waves, imaging showing new loss of viable myocardium or new regional wall motion abnormalities due to ischemia, or detection of coronary thrombi via angiography or post-mortem examination. The eICU database includes a diverse range of patients with acute myocardial infarction (AMI) who met the specified diagnostic criteria and required intensive care. This cohort encompasses patients with varying severities, not limited to those who survived cardiac arrest or were unstable after percutaneous coronary intervention (PCI). The selection criteria for ICU admission were based on the clinical judgment of the treating physicians. This approach ensured that patients in need of closer monitoring and intervention received appropriate care. Exclusion criteria were: (1) non-first ICU admission, (2) age under 18 years, (3) The baseline mean arterial pressure data were missing when admitted to the Intensive Care Unit (ICU). The study flowchart is illustrated in Fig. 1.

Flow chart of study population. This study is a multicenter retrospective cohort study. Patients diagnosed with acute myocardial infarction according to the International Classification of Diseases, 9th Revision criteria upon ICU admission were included. Exclusion criteria were: (1) non-first ICU admission, (2) age under 18 years, (3) The baseline mean arterial pressure data were missing when admitted to the Intensive Care Unit (ICU).
Variables
All participant data within 24 h of admission were collected from the eICU-CRD. Physiological variables including temperature (°C), respiratory rate, heart rate (HR), and mean arterial pressure (MAP) were obtained from the apacheApsVar table. MAP is calculated using the formula: MAP = diastolic blood pressure + 1/3 (systolic blood pressure-diastolic blood pressure). Systolic blood pressure (SBP): reflects the pressure exerted on the arteries during heart contraction and is an important indicator of the pumping function of the heart. Diastolic pressure (DBP): reflects the arterial pressure when the heart is relaxed, and is usually more reflective of peripheral vascular resistance. Significance of MAP: The value of MAP is crucial for assessing the blood supply to an organ. Baseline characteristics such as age, gender, race, and weight were collected from the patient and apache patent result tables. The primary outcome variable used in this study is the 28-day ICU mortality status of patients with acute myocardial infarction upon first ICU admission. This variable was recorded as a binary variable, where death was recorded as 1 and survival as 0 in the database. The main exposure variable of interest in this study is baseline mean arterial pressure. All covariate information was obtained at baseline. Inclusion criteria were primarily based on previous studies, our clinical experience, and literature that similarly used 28-day ICU mortality as an outcome variable.
Outcomes
The outcome of the study was all-cause ICU mortality within 28 days after admission to the ICU.
Statistical analysis
Continuous variables were summarized as mean ± SD or median with interquartile range (IQR), while categorical data were presented as counts and percentages. One-way analysis of variance (ANOVA) was employed for continuous data, and the chi-square test was used for categorical variables to compare differences across the tristiles of mean arterial pressure (MAP). We assessed the unadjusted association between baseline variables and 28-day mortality in a cohort of 8161 patients. Odds ratios (ORs) with 95% confidence intervals (CIs) were calculated for each exposure variable to evaluate their relationship with 28-day mortality.
A threshold effect analysis was conducted to examine the relationship between MAP and 28-day mortality using two models: a linear model (Model I) and a non-linear model (Model II). Model I assessed the linear relationship between MAP and mortality, calculating the OR per unit and per standard deviation increase in MAP, along with the corresponding p-values. Model II utilized a non-linear approach to identify potential tipping points (K) for MAP. We performed a log-likelihood ratio test to compare simple linear regression models with segmented linear regression models. Bootstrap resampling was utilized to calculate the 95% confidence interval for the inflection point17, as described in the previous analysis18,19. To explore the dose–response relationship between MAP and mortality rate, we employed a Generalized Additive Model (GAM). Covariate adjustments were made based on their association with the outcome or if they altered the estimate by more than 10%17. The following covariates were adjusted for based on clinical significance: age, gender, race, ICU type, body mass index (BMI), dialysis status, respiration rate, heart rate, chronic obstructive pulmonary disease (COPD), blood glucose levels, diabetes, pneumonia, calcium levels, platelet count, and white blood cell count.
We utilized a multivariable logistic regression model to estimate the association between MAP and 28-day all-cause mortality in the ICU, presenting the results as ORs with 95% CIs. To assess the robustness of our findings, sensitivity analyses were conducted using the Cox proportional hazards model, with ICU length of stay as the time scale to account for potential biases from different statistical methods. Results were reported as hazard ratios (HRs) with 95% CIs. Both unadjusted and adjusted regression estimates were provided. Adjustments were made based on factors identified from univariate analysis, literature, and clinical experience. In Model 2, adjustments included age, gender, and ethnicity. Model 3 included further adjustments for BMI, temperature, COPD, diabetes mellitus (DM), arrhythmias, and white blood cell count (WBC).
Sensitivity analyses included the use of dummy variables for missing covariate values, with imputation applied for continuous variables with missing values exceeding 1%. By calculating an e-value of20, we explored potential unmeasured confounding between mean arterial pressure (MAP) and 28-day mortality. A two-sided α level was set at 0.05. All statistical analyses were performed using EmpowerStats (www.empowerstats.com, X&Y Solutions, Inc., Boston, MA) and R software version 3.6.1 (http://www.R-project.org).
Results
Baseline characteristics
The baseline characteristics of the patients are summarized in Table 1. Mean arterial pressure (MAP) was categorized into three groups (Q1-Q3), The average age of the patients was 64.80 ± 13.33 years, with a 28-day ICU mortality rate of 7.38% (604 out of 8161 patients). Compared to the Q2 and Q3 groups, patients in the Q1 group were older and had a higher proportion of females and African Americans. The Q1 group also exhibited higher acute physiology scores and greater prevalence of chronic obstructive pulmonary disease, congestive heart failure, diabetes, and pneumonia, along with lower Glasgow Coma Scale scores.
In terms of laboratory indicators, patients in the Q1 group had elevated levels of blood urea nitrogen, blood glucose, and white blood cell counts, while their calcium, hemoglobin, and red blood cell counts were lower. The 28-day mortality rate in the Q1 group was significantly higher at 11.12%, compared to 2.46% in the Q2 group and 5.24% in the Q3 group. These findings indicate that patients with lower MAP values had more severe conditions and poorer prognoses, highlighting the importance of maintaining adequate perfusion pressure in critically ill patients.
Unadjusted association between baseline variables and 28-day mortality
Table 2 presents the results of a univariate logistic regression analysis. The findings indicate that patients with lower mean arterial pressure (MAP) values (40–56 mmHg) had a significantly higher risk of mortality within 28 days of ICU admission compared to those with moderate (OR 0.20, 95% CI 0.15–0.26, p < 0.0001) and higher MAP levels (OR 0.44, 95% CI 0.36–0.54, p < 0.0001).
Factors associated with increased 28-day mortality included: Age: Each additional year increased the odds of mortality (OR 1.04, 95% CI 1.03–1.05, p < 0.0001). Glasgow Coma Scale (GCS) Score: Lower scores were linked to higher mortality (high vs. low GCS OR 0.14, 95% CI 0.11–0.17, p < 0.0001). Acute Physiology Score (APS) III: Higher scores significantly increased mortality risk (high vs. low APS OR 51.06, 95% CI 24.07–108.29, p < 0.0001). APACHE IV Score: Elevated scores were also associated with higher mortality (high vs. low APACHE OR 49.26, 95% CI 24.36–99.61, p < 0.0001). Temperature: Lower temperatures correlated with increased mortality risk (medium vs. low temperature OR 0.40, 95% CI 0.31–0.53, p < 0.0001). Respiratory Rate: Higher rates were associated with greater mortality (high vs. low respiratory rate OR 2.86, 95% CI 2.22–3.67, p < 0.0001). Heart Rate: Increased heart rates were linked to higher mortality (high vs. low heart rate OR 3.84, 95% CI 3.02–4.88, p < 0.0001). Blood Glucose: Elevated glucose levels were associated with increased mortality risk (high vs. low blood glucose OR 3.97, 95% CI 3.02–5.23, p < 0.0001). White Blood Cell Count: Higher counts were related to increased mortality (high vs. low WBC count OR 4.29, 95% CI 3.28–5.61, p < 0.0001).
Identification of nonlinear relationship
Smooth curve fitting analysis and GAM were performed to explore the nonlinear relationship between the MAP and 28-day all-cause mortality for critically ill patients with AMI after ICU admission (Fig. 2; Table 3). In Model I linear analysis, no significant association was found when MAP rose by 1 mmHg or 1SD (1SD = 39.4 mmHg). ORs were 1.00 (95% CI (1.00, 1.00), p = 0.3265) and 0.95 (95% CI (0.85, 1.06), p = 0.3265). In Model II nonlinear analysis, a threshold effect emerged at 84 mmHg MAP. Below this (MAP < 84 mmHg), a 1-mmHg MAP increase meant a 5% mortality drop (OR 0.95, 95% CI (0.93, 0.96), p < 0.0001), and a 1-SD rise led to an 89% death risk reduction (OR 0.11, 95% CI (0.07, 0.19), p < 0.0001). Conversely, within the range of MAP ≥ 84 mmHg, a 1-mmHg MAP increase caused a 3% mortality rise (OR 1.03, 95% CI (1.02, 1.03), p < 0.0001), and a 1-SD increase brought a 1.67-fold death risk increase (OR 2.67, 95% CI (2.08, 3.44), p < 0.0001).
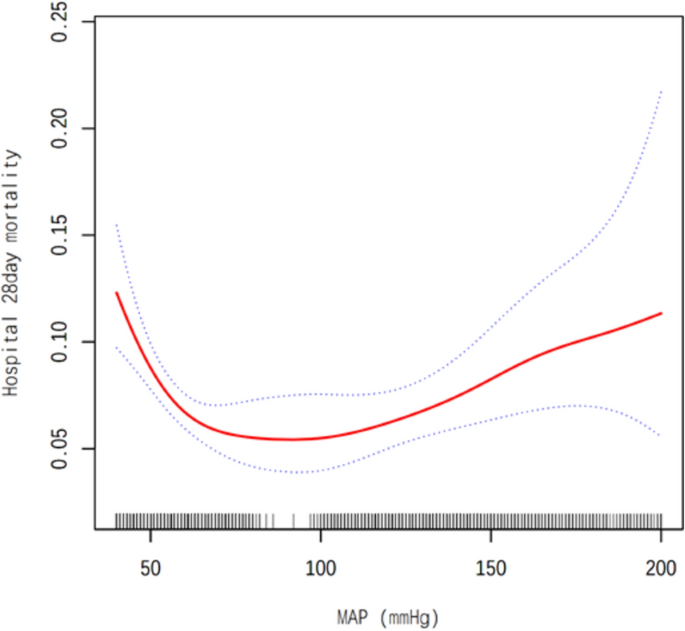
Associations between the MAP and 28-day mortality in all patients with AMI. A threshold, nonlinear association between the AMI and 28-day mortality was found in a generalized additive model (GAM). Solid rad line represents the smooth curve ft between variables. Blue bands represent the 95% of confdence interval from the ft. Adjusted for Gender; Age (years); Ethnicity; unittypeICU; BMI; DIALYSIS; Respiratory rate (bpm); Heart rate (/min); COPD; Glucose (mg/dl); DM; Pneumonia; Calcium (mg/dl); PLT (cells × 109/L); WBC (cells × 109/L).
Additionally, using a generalized additive model, we detected a U-shaped association between MAP and 28-day mortality (Fig. 2). We compared the linear regression model with a two-stage linear regression model, yielding a predicted value at the inflection point of − 5.17 (95% CI (− 5.56, − 4.79)). The log-likelihood ratio test was significant (p < 0.001) (Table 3).
Association between MAP and 28-day mortality in different models
Table 4 shows the results of multivariable logistic regression and Cox proportional hazards regression on the association between mean arterial pressure (MAP) and 28-day all-cause mortality. In logistic regression: When MAP is a continuous variable, in Model 1 (without covariate adjustment), OR = 0.996 (95% CI 0.993, 0.998; p = 0.00036). This indicates that for every 1-mmHg increase in MAP, the odds of 28-day mortality decrease by 0.4%. After adjusting for gender, age, and ethnicity in Model 2, OR = 0.997 (95% CI 0.995, 0.999; P = 0.01583). After further adjusting more factors in Model 3, OR = 0.998 (95% CI 0.995, 1.000; P = 0.10236), and the significance is attenuated. For MAP tertiles, the low-MAP group (Q1) was set as the reference. In the middle-MAP group (Q2), the ORs in Model 1, Model 2, and Model 3 were 0.20, 0.23, and 0.37 respectively. In the high-MAP group (Q3), the ORs in the three models were 0.45, 0.51, and 0.61 respectively. In Q2 and Q3, the ORs were all less than 1 with significant P values, indicating lower mortality odds compared to Q1. Confounding factor adjustment didn’t change the significance.
In Cox regression for sensitivity analysis: When MAP is a continuous variable, in Model 1, HR = 0.997 (95% CI 0.995, 0.999; p = 0.01025). After adjustment in Model 2 and 3, HR = 0.998 in both (with different CIs and P values), and the significance is weakened. For MAP tertiles (Q1 as reference), in the Q2 group, the HRs in the three models were 0.34, 0.39, and 0.55 respectively. In the Q3 group, the HRs were 0.60, 0.68, and 0.76 respectively. In Q2 and Q3, the HRs were less than 1 with significant P values, indicating a lower 28-day all-cause mortality risk than Q1. The significance remains after factor adjustment.
Discussion
Our study is a large-scale retrospective cohort study. We analyzed data from 8161 acute myocardial infarction (AMI) patients in the eICU-CRD database, representing 208 different ICUs across the United States. Our key finding is a U-shaped relationship between mean arterial pressure (MAP) levels and the risk of all-cause mortality. We found that the baseline MAP at the time of ICU admission, within the range of 57–110 mmHg, is equivalent to a blood pressure range of approximately 85/55 mmHg to 145/90 mmHg. It is associated with the lowest 28-day all-cause mortality risk. Patients with very low or very high MAP levels faced an increased risk of in-hospital mortality. Notably, the risk of all-cause mortality was higher for patients with very low MAP compared to those with very high MAP. To our knowledge, this is the first study to report the relationship between MAP and 28-day mortality in AMI patients.
The correlation between mean arterial pressure (MAP) and all-cause mortality is a complex issue, involving multiple studies with varying results. Different studies have shown different findings regarding the association between MAP and in-hospital mortality rates. such as that by Dorresteijn et al.21, proposed a J-shaped curve, suggesting that in patients with underlying vascular disease, low blood pressure was associated with an increased susceptibility to cardiovascular events and mortality. In contrast, Ayman Khairy Mohamed Hassan et al.22. Highlighted a significant correlation between MAP variability within the first 24 h of ICU admission and ICU mortality, with heightened variability correlating with a greater risk of death. Another study by Dahai Yu et al.23, found that in type 2 diabetes, there is a non-linear relationship between mean arterial pressure (MAP) and cardiovascular hospitalization (linearity test, P < 0.001). A MAP of 97 (95% confidence interval: 93–101) mmHg is associated with the lowest risk of cardiovascular hospitalization. And previous multiple studies have shown that various blood pressure measurements have a nonlinear U-shaped dose–response relationship with all-cause mortality24,25, which is consistent with the conclusion of this study. However, this study focuses on AMI patients in intensive care units in the United States. It has a large sample size and adjusts for more covariates, so the results are more reliable. This highlights the complexity and nonlinear impact of the relationship between MAP and all-cause mortality in critically ill patients.
Nevertheless, some studies have shown that in specific populations such as young adults, elderly individuals, or critically ill patients, there is no significant association between mean arterial pressure and all-cause mortality rates26,27. For instance, the relationship in older adults and critically ill patients with specific disease backgrounds appears more complex28,29,30. The difference between the above study and our findings, as well as the blood pressure of 84 mmHg in our study, which is approximately equivalent to 102/75 mmHg, is a turning point in the relationship between MAP and 28-day mortality. This can be attributed to: (1) Our specific study population included patients with acute myocardial infarction admitted to the U.S. intensive care unit with a higher average age, more underlying diseases, and more complex health conditions; (2) our study design being a cohort study; (3) the variables we adjusted for not being consistent with those in the above studies, as we additionally adjusted for Different adjusted variables (age, gender, race, etc.) (4) the use of different algorithms, with our diagnosis of non-linear correlations utilizing the GAM model.”
While our study found a U-shaped link between MAP levels and death risk, the reasons behind how high or low MAP ties to mortality aren’t clear. From a pathophysiological stance, we suggest these ideas. When MAP is low, key organs like the heart and brain don’t get enough blood. This causes cell oxygen-shortage and damage, raising the death risk. Our research showed that low MAP, along with old age, a low GCS score when entering ICU, lower body temperature, and a high white-blood-cell count, means a higher death risk. These often point to serious health issues like lung infections or long-term inflammation, which are more common in older people. On the other hand, very high MAP usually means stress and sudden illness. This can make the sympathetic nervous system over-active and cause inflammation, leading to high blood pressure. Too much pressure on blood-vessel cells can start inflammation, mess up organ function, and raise the death rate. Because it’s so complex, more forward-looking studies are needed. They can help us understand how these factors interact and how they affect the death risk at different MAP levels. In clinical practice, doctors should closely monitor the MAP level of AMI patients, especially during the first 12 to 24 h after entering the ICU. Maintain it within the optimal range of 57 to 110 mm of mercury. Correct it in time when it deviates.
This study has the typical limitations of observational research, especially concerning unmeasured confounders. We didn’t check if patients had invasive procedures like PCI before being admitted to the ICU. Although we accounted for measurable confounders, unmeasured ones are still a worry, highlighting the need for larger, high-quality clinical studies to confirm our findings. Our results may not be applicable to the broader acute myocardial infarction (AMI) population outside the ICU or those who survive beyond 28 days. The eICU database lacks details on the type and severity of myocardial infarction, which could affect the relationship between mean arterial pressure (MAP) and 28-day all-cause mortality. Also, since baseline MAP was measured non – invasively (The possibility of inaccurate measurements due to cuff placement and the type of equipment used), and key variables such as medication use are missing, we can’t determine how drugs affect MAP levels at ICU admission. The unknown time from symptom onset to hospitalization might introduce bias too. Even though we used sensitivity analysis and non-linear algorithms to strengthen our results, the observational nature of this study prevents us from establishing a causal link between MAP and mortality.
In this study, we included patients who died after being discharged from the ICU in the analysis. We are aware that this approach is controversial. Incorporating these patients may lead to survival bias and introduce confounding variables, which can affect the accurate assessment of the direct effects of ICU treatment. After discharge, factors such as the out-of-hospital environment and subsequent treatment plans can overshadow the true effects of ICU treatment itself, making it difficult to determine the direct association between death and ICU treatment. However, including these patients also has positive implications. It enables us to understand the impact of ICU treatment on the overall prognosis of patients from a macroscopic perspective, rather than being limited to the in-hospital treatment period. This is of great significance for comprehensively evaluating the value of ICU treatment. In future research designs, we will conduct an in-depth analysis of the influence degree of confounding factors and use sensitivity analysis to assess the robustness of the results.
In our study, the 28-day all-cause mortality rate of ICU-admitted patients was 7.38% (604/8161), remarkably low given their critical condition. This is due to multiple factors. Close vital sign monitoring in the ICU is key. Advanced equipment helps medical staff detect minor physiological changes rapidly. For example, continuous ECG monitoring can promptly identify life-threatening arrhythmias in critically ill patients, allowing for timely intervention. Comprehensive treatment strategies also contribute significantly. Besides treating the primary disease, ICU care covers fluid balance management, oxygenation optimization, and secondary infection prevention. Appropriate antibiotic use can prevent severe sepsis, a common cause of death. However, patient selection bias might impact the mortality rate. Excluding patients with multiple comorbidities, poor baseline health, or those who died during emergency treatment may overestimate treatment effectiveness. In summary, the low mortality rate in our study is encouraging but influenced by multiple factors, including patient selection. Further research is needed to clarify these factors and improve ICU care.
Conclusion
This study of 8161 acute myocardial infarction patients from the eICU-CRD database revealed a nonlinear dose–response relationship between MAP and 28-day mortality rates, showing a U-shaped curve. The lowest 28-day all-cause mortality risk was associated with baseline MAP at ICU admission in the 57–110 mmHg range. Patients with extremely low or high MAP levels had increased in-hospital mortality risk, with higher risk for those having very low MAP compared to those with very high MAP.


Responses