UK Biobank data demonstrate long-term exposure to floods is a risk factor for incident dementia

Introduction
In recent decades, the incidence and magnitude of natural disasters have grown, affecting people worldwide. From 2000 to 2021, there were 9066 natural disasters recorded in the International Disaster Database (EM-DAT), with 1.3 million people losing their lives1. Among all kinds of natural disasters, floods affected the highest number of people, accounting for 40% of the total affected population over the last two decades1. Global flood impacts have been increasing steeply over the past decades, and have mainly been driven by steady growth in population and economic activities in flood-prone areas2. Between 1995 and 2015, more than 2.3 billion people were affected by flood disasters, with nearly 0.16 million people dying directly as a result of floods3.
Dementia is a syndrome of cognitive and functional decline. It is not only a major cause of disability for older adults, but also the biggest global health challenge4. In 2019, dementia was the seventh leading cause of death globally5. There were an estimated 57.4 million people worldwide suffering from dementia6. This number is projected to reach 152.8 million people in 2050 globally6. Despite the great disease burden of dementia, about 60% of the variance in dementia risk remains unexplained7,8. Studies now suggest that survivors of flood events may face an elevated risk of cognitive decline, as evidenced by the growing number of individuals who experienced a flood event relying on antidementia medications9,10. Plausible mechanisms have been put forward to explain the connection between floods and cognitive decline11. One such mechanism involves the traumatic experiences associated with floods, which may induce psychological trauma, post-traumatic stress disorder (PTSD), and depression, ultimately resulting in cognitive decline12,13,14. Additionally, the physical and social repercussions of floods, such as residential dislocation, may decrease physical and social participation, potentially leading to an increased risk of social isolation and consequent cognitive decline, thereby elevating the risk of developing dementia11,15.
While the devastating immediate toll of flood fatalities is well documented, identifying the long-term risk of dementia associated with floods remains challenging. Inaccurate assessment of flood exposure, limited sample sizes, and inadequate follow-up periods have hampered our understanding of this potential long-term impact. This lack of evidence leaves a critical gap in our knowledge about the long-term effects of floods on the risk of dementia. To bridge this gap in knowledge, we utilised the UK Biobank project, a population-based study with a substantially large sample size, to comprehensively examine the long-term effects of flooding on incident dementia. Here we found that flood exposure was associated with an increased risk of dementia. Furthermore, we identified specific populations at higher risk.
Methods
Study design and study population
We conducted a nested case-control study using data from the UK Biobank study, a prospective cohort study comprising ~0.5 million residents aged 37 to 73 years. The participants were recruited between 2006 and 2010 from 22 assessment centres across England, Wales, and Scotland. Upon attending an assessment centre, volunteers completed a comprehensive baseline assessment, which included touchscreen questionnaires, a face-to-face interview with a study nurse, physical measurements, and the collection of blood, urine, and saliva samples. The baseline assessment period concluded in July 2010. For our study, we excluded individuals who lacked longitude and latitude data of residence (n = 11), participants with missing data on age, sex, and ethnicity (n = 2775), as well as those who were diagnosed with dementia in or before the year of recruitment (n = 248). Ultimately, our analysis included a total of 499,336 participants who had provided informed consent (Fig. 1). The study was approved by the North West Multi-Centre Research Ethics Committee (06/MRE08/65). Written informed consent was obtained from all participants. Permission to use the UK Biobank data was approved by the UK Biobank access committee under UK Biobank application number 55257.

This flowchart illustrates the selection process of study participants from the UK Biobank.
Flooding exposure
We collected flood data during 2000–2020 from the Dartmouth Flood Observatory (DFO), a comprehensive global catalogue that documented flood events reported in news, governmental sources, and the FloodList (http://floodlist.com/). The DFO provided detailed information on each flood event, including start date, end date, affected geographic areas, and severities. The information was validated using satellite observations. Participants residing in areas affected by floods were considered exposed to flood events based on their home addresses. To quantify long-term flood exposure, we calculated an annual cumulative flood exposure, referred to as the ‘flood index,’ for each participant. This index is computed by multiplying the duration and severity (as detailed in Supplementary Table 1) of each flood event and summing these values for each year, as shown in Eq. (1). The algorithm has been validated and applied in previous studies as a reliable measure of cumulative exposure to environmental factors16,17,18.
where ({{Flood; index}}_{i,{year}=m}) stands for the flood index in year (m) for participant (i). ({{Duration}}_{{ij}}) and ({{Severity}}_{{ij}}) represent the duration and the severity of the jth flood event in year m, respectively. If no flood events were occurring within a specific year, a flood index value of 0 was assigned.
Meteorological data
Hourly temperature data were obtained from the European Centre for Medium-Range Weather Forecasts Reanalysis v5 (ERA-5) reanalysis data set. This data set had a spatial resolution of 0.1° × 0.1°. Relative humidity was calculated from the mean temperature and mean dew point temperature. We mapped meteorological data to the participant’s geocoded residential address at baseline. To derive daily meteorological variables, we calculated the average values by aggregating the hourly data within each day. Subsequently, the daily temperature and relative humidity values were aggregated to obtain yearly averages.
Case-control selection
Health outcome data within the UK Biobank were collected through multiple sources, including primary care data, hospital inpatient records, death register records, and self-reported medical conditions. Participants were defined as cases if they were diagnosed with dementia during the study period, with specific International Classification of Diseases (tenth revision) codes, including F00 (dementia in Alzheimer’s disease), F01 (vascular dementia), F02 (dementia in other diseases), F03 (unspecified dementia), or G30 (Alzheimer’s disease). The date of the first documented dementia diagnosis was determined based on the earliest record from any of the aforementioned data sources. Dementia cases were further classified into subtypes, including Alzheimer’s disease and vascular dementia.
A risk-set sampling method was used to select controls for cases by identifying the controls who are at risk at the index date of the case. With this sampling approach, the odds ratio (OR) will provide an unbiased estimate of the risk ratio (or hazard ratio) in the underlying cohort19. The index date of a case was the date of diagnosis. Each case was matched with eight controls, which were randomly selected from comparable participants who had similar ages (within five years), same sex (male and female), and same ethnicity (white, black, Asian or Asian British, Mixed, Chinese, and others). One case was unsuccessful in matching and one case has only one eligible control due to a lack of qualified controls (Fig. 1).
Potential covariates
To ensure a robust adjustment for confounders, we constructed a directed acyclic graph (DAG) based on prior knowledge and existing literature, to systematically identify covariates that may influence the relationship between flood exposure and dementia risk20,21. The DAG was used to select a minimally sufficient set of covariates that block potential confounding pathways and mitigate bias from mediators and colliders (Supplementary Fig. 1)22. The retained covariates include body mass index (BMI), physical activity, healthy diet score, cigarette smoking, alcohol consumption, educational attainment, average total annual household income before tax, Townsend deprivation index (TDI), apolipoprotein E (APOE) ε4 status, and assessment centres. Based on the APOE genotypes, we categorised participants into three risk groups: high APOE risk (ε2ε4, ε3ε4 or ε4ε4 genotypes), intermediate risk (ε3ε3 genotype), and low risk (ε2ε2 or ε2ε3 genotypes)23,24. BMI was calculated as the objectively measured weight (kg) divided by the square of height (m). Physical activity was determined using the International Physical Activity Questionnaire-Short Form (IPAQ-SF)25. Participants were categorised at “high” (≥1500 MET-minutes/week), “moderate” (≥600 MET-minutes/week), or “low” (<600 MET-minutes/week) levels of physical activity following standardised IPAQ-SF scoring guidance25. Diet score was calculated based on the following dietary factors: vegetable intake ≥3 servings/day; fruit intake ≥ 3 servings /day; whole grains ≥3 servings/day; refined grains ≤1.5 servings/day; fish intake ≥2 servings/day; unprocessed red meat intake ≤2 servings/week; and processed meat intake ≤2 servings/week. Each point was given for each favourable dietary factor, and the suboptimal diet was defined as a diet score <4. Smoking status was categorised as current, former, and never. Low-risk alcohol consumption was defined as moderate drinking (no more than one drink/day for women and two drinks/day for men; one drink is measured as 8 g ethanol in the UK) on a relatively regular frequency26. Educational attainment was coded into four categories: college or university degree, General Certificate of Education Advanced levels (A level)/National Vocational Qualification (NVQ)/other, General Certificate of Education Ordinary levels (O levels)/Certificate of Secondary Education (CSE), or none of the above. Annual household income was classified into five groups: <£18,000, £18,000–£30,999, £31,000–£51,999, £52,000–£100,000, and >£100,000. TDI was used to evaluate area deprivation levels, based on the four constituent domains: unemployment, car ownership, household overcrowding, and owner occupation27. Data for these domains were extracted from the national census data. The TDI scores were calculated for each area, with higher scores indicating increased levels of social deprivation. Participants were then categorised as either high or low deprivation based on whether their TDI score exceeded the median value.
Statistics and reproducibility
The associations between flood index and incident dementia were estimated using conditional logistic regression models. Distributed lag non-linear model (DLNM) was used to describe the exposure-lag-response associations of flooding exposure with incident dementia. DLNM built a bi-dimensional cross-basis function, modelling the linear or non-linear exposure-response relationship and the lag structure of the relationship. Natural cubic splines with three degrees of freedom were constructed to assess the shape of the annual flood index with dementia risk. As the nonlinear analysis indicated an approximately linear relationship (Supplementary Fig. 2), a linear exposure-response relationship was applied in the formal analysis. The lag-response curve was modelled with a natural cubic spline with two knots equally spaced in the log scale, plus an intercept, with a maximum lag period of up to 7 years.
We performed models adjusting for different sets of covariates: Model 1: unadjusted; Model 2: a multivariate model that controlled for socioeconomic status (education attainment, household income, and deprivation); and Model 3: a fully adjusted model that additionally adjusted for BMI, physical activity, smoking, alcohol consumption, suboptimal diet, temperature, relative humidity, APOE status, and assessment centre. Temperature and relative humidity terms were defined as the average annual mean temperature and relative humidity over 7 years preceding the index date and modelled by a natural cubic spline with three degrees of freedom, respectively. We did not adjust for medical history of mental illness and cardiovascular diseases due to potential mediating effects. However, these factors were further controlled for in the model during the sensitivity analyses. Observations with missing covariate data were excluded, with exclusions varying by model based on the set of covariates adjusted. For instance, no exclusions were required in Model 1. In sensitivity analyses, missing values were further imputed. Results were presented as ORs associated with per unit increase in annual flood index, considering both single lag years and cumulative effects over different lag periods. The OR for a single lag year refers to the effect of floods in a specific year following the exposure, for example, the effect in the same year (lag 0), one year later (lag 1), two years later (lag 2), and so on. The OR for a lag period refers to the cumulative effect over multiple years; for example, the effect for lag 0–3 years indicates the cumulative effect of flood exposure from the current year (lag 0) to three years later (lag 3).
Subgroup analyses were conducted by age group (<65 and ≥65 years), sex, weight status (BMI: ≤24.9, 25–29.9, and ≥30), APOE status (high risk and low/intermediate risk), physical activity (low, moderate, and high), suboptimal diet, alcohol consumption status, drinking status, education attainment, annual household income, and area deprivation level. The difference in effect estimates across subgroups was tested with random-effects meta-regression models.
Sensitivity analysis
Sensitivity analyses were performed to test the robustness of our results: (1) we repeated our analyses using complete data by employing Multivariate Imputation by Chained Equations (MICE) to impute missing data, with 5 iterations. (2) We introduced additional adjustments in the model of the frequency of depressed mood, the history of cardiovascular disease (ICD 10: I20–I25, I60–I69) and chronic obstructive pulmonary disease (ICD 10: J44). (3) We restricted our analyses to participants who have been living in the current address for at least 10 years. (4) We used alternative degrees of freedom for the lag-response association of the annual flood index. (5) We also used alternative degrees of freedom for the non-linear exposure-response relationship of mean temperature and relative humidity, respectively. (6) We used alternative case-to-control ratios.
All main analyses were performed using R version 4.1.0 (RStudio Team (2021). RStudio: Integrated Development for R. RStudio, PBC, Boston).
Reporting summary
Further information on research design is available in the Nature Portfolio Reporting Summary linked to this article.
Results
Baseline characteristics
During the study period, 7713 cases of incident dementia were recorded, with 61,697 matched controls. At the study baseline, participants’ mean age [±standard deviation (SD)] was 64.2 (± 4.8) years; 52.5% were males and 95.9% were white-European (Table 1). The baseline characteristics of cases and controls are shown in Table 1. The cases were less likely to be highly educated; more likely to report low levels of physical activity; more likely to be current smokers; and more likely to have higher TDI, compared to the controls. Baseline characteristics of cases and controls with any missing values in covariates are shown in Supplementary Table 2. The mean exposure day was 23.8 days for cases and 7.8 days for controls. In terms of cumulative flood exposure, the average flood index was 11.0 for cases and 7.6 for controls. The spatial distribution of the flood index is shown in Supplementary Fig. 3.
Associations between floods and incident dementia
Figure 2 shows the association between any dementia associated with per unit increase in annual flood index on single lag years and the estimated cumulative associations over different lag periods. The risk of any dementia was the strongest in the current year (lag 0), attenuated to lag year 6, and followed by a significant displacement in lag year 7 (Supplementary Data 1). As a result, the cumulative effects reached the highest for lag 0–6 years, which was used in subsequent analysis. Similar lag patterns were observed for vascular dementia and Alzheimer’s diseases (Supplementary Data 1).
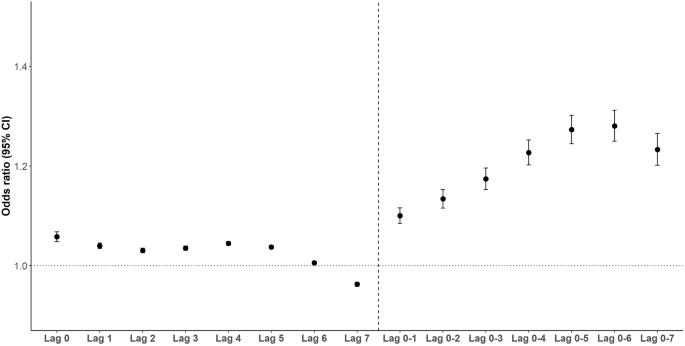
Dots represent odds ratios from conditional logistic models and the ends of the lines represent the 95% confidence intervals. The models were adjusted for education attainment, household income, and deprivation, BMI, physical activity, smoking, alcohol consumption, suboptimal diet, mean temperature, mean relative humidity, and assessment centre (n = 32,345).
Table 2 shows the estimated cumulative OR of incident dementia associated with per unit increase in annual flood index over lag years 0–6. The ORs (95% CI) of any dementia were 1.26 (1.25–1.27) for model 1, 1.27 (1.26–1.29) for model 2, and 1.28 (1.25–1.31) for model 3. Similar effects were observed for dementia subtypes after fully adjusting the models, whereby a greater flood index was associated with a greater risk of Alzheimer’s disease (OR: 1.44, 95% CI: 1.36–1.53) and vascular dementia (OR: 1.65, 95% CI: 1.48–1.83).
Subgroup analyses
For all subgroups, there was a significant association between annual flood index and any dementia (Fig. 3). Specifically, participants aged younger than 65 years showed a higher risk of dementia incidence compared with those aged 65 years and older. Similarly, female participants had a relatively higher dementia risk as compared to male participants. Participants with a higher household income had a higher risk of incident dementia as compared to participants with lower household income, while there was no significant difference in the flood-related dementia risk between low and high socio-economic deprivation groups. For the stratified analyses of Alzheimer’s disease according to APOE status, similar effect estimates were observed (Supplementary Table 3).
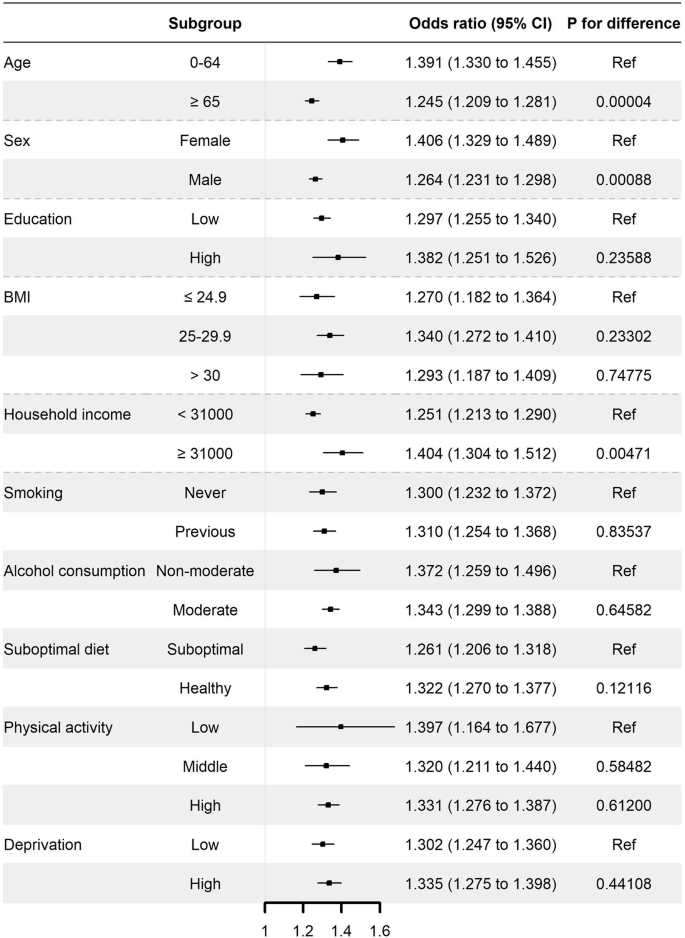
Dots represent odds ratios from conditional logistic models and the ends of the lines represent the 95% confidence intervals. The models were adjusted for education attainment, household income, and deprivation, BMI, physical activity, smoking, alcohol consumption, suboptimal diet, mean temperature, mean relative humidity, and assessment centre (n = 32345). Ref reference group.
Sensitivity analyses
Our sensitivity analyses suggest that using multiple imputed data did not change study findings (Supplementary Table 4), and our results were not dependent on modelling assumptions (Supplementary Tables 5, 6). The results were still robust when only participants living in the current address for at least ten years were included (Supplementary Table 7). Additional adjustments for a history of depression, cardiovascular disease, and chronic obstructive pulmonary disease did not substantially change our results (Supplementary Table 8). No substantial changes in effect estimates were observed across different case-to-control matching ratios (Supplementary Fig. 4).
Discussion
To our knowledge, this was the first nationwide study to assess the long-term impacts of flooding exposure on dementia through a population-based study. We observed an increased risk of incident dementia associated with flooding exposure. The exposure-response association between flood and incident dementia was approximately linear, with no discernible thresholds. The risk was elevated until the sixth year after flood exposure. The associations were consistent across subgroups of baseline lifestyles, demographics, and socio-economic status.
In this study, we observed an increased risk of incident dementia associated with floods. These findings align with previous research investigating cognitive decline following flood events. For example, Saori et al. reported an increase in the prescriptions of antidementia drugs among those affected by the 2018 Japan Floods, which ranked as the second-largest natural disaster after the Great East Japan Earthquake9. Another study focusing on the same event (2018 Japan Floods) reported a decline in cognitive function among older adults whose houses were damaged and who experienced the loss of a primary breadwinner due to floods10. Similarly, cognitive decline has been widely documented following other natural disasters such as hurricanes, earthquakes, and tsunamis11,28,29.
Plausible mechanisms have been put forward to explain the connection between disaster-related traumatic experiences and cognitive decline. Firstly, the development of mental illness (e.g., psychological trauma, PTSD, and depression) may contribute to cognitive decline7,12,14. Psychological stress derived from the destruction of their houses, loss of relatives, and living in an insufficient and unfamiliar environment such as an evacuation centre, was one of the most common illnesses after floods10,30. It is reported that 12% of 94 Norwegians who lost close family members in the 2004 Southeast Asian Tsunami had a prolonged grief disorder 6 years after the event, which is an independent risk factor of functional impairment31. Moreover, the use of psychotropic medications for such stress has been associated with an increased risk of developing dementia. Secondly, lack of social contact and increased risks of social isolation due to residential dislocation and changes in the living environment might further exacerbate the cognitive decline7,32. It is reported that the majority of victims suffered from the 2018 Japan Floods evacuated to a shelter, but found it difficult to engage in their usual social activities10. Furthermore, exposure to pathogens (e.g., bacteria, virus, and mould) and environmental toxins (e.g., chemicals from industrial and agricultural runoff) during or after floods may also contribute to cognitive decline or dementia risk. For instance, mould exposure has been associated with increased inflammation and oxidative stress, which may promote neurodegenerative processes involved in dementia33,34. Additionally, infections are recognised risk factors for vascular diseases and can disrupt neurological health through inflammation and oxidative stress, potentially increasing the risk of vascular dementia35,36. Together, this toxic exposure pathway and psychosocial stressors may amplify the adverse effects of flood exposure on cognitive health.
Our findings suggest that long-term flood exposure appears to be more strongly associated with an increased risk of vascular dementia than Alzheimer’s disease. This disparity may be attributed to the distinct pathophysiological mechanisms underlying these dementia subtypes. Vascular dementia primarily results from cerebrovascular pathologies, such as ischaemic or haemorrhagic injury within specific brain regions, which can be exacerbated by prolonged stress and environmental challenges associated with repeated or severe flood exposure37,38. Chronic stress responses related to flood exposure—such as increased oxidative stress, endothelial dysfunction, and systemic inflammation—may promote atherosclerosis and impair vascular function, thus potentially heightening the risk of vascular dementia39,40,41. Conversely, Alzheimer’s disease is characterised by neurodegenerative changes, including amyloid-beta plaque formation and tau protein abnormalities, which are less directly affected by flood-related stress42. The unique pathways through which flood exposure impacts vascular health could explain the stronger association with vascular dementia. Future research investigating the specific physiological pathways linking environmental stressors to cerebrovascular health could provide further insights into the differential impact of flood exposure on dementia subtypes.
Although the association between flooding exposure and incident dementia remained significant across all subgroups, notable evidence suggests that the effects observed were slightly larger among participants under the age of 65. In a study investigating the long-term psychological impact of earthquake experience, it was found that older adults aged ≥60 years exhibited a significantly higher level of positive mental health compared to younger age groups43. The authors attribute this finding to the mature coping styles of older adults, which provide them with a protective mechanism against stressors, leading to reduced emotional reactivity to post-disaster distress43. It is important to note that our study participants have a mean age of 64 years, even in the 0–64 years age group, the mean age remains at 60 years. Therefore, further research is required to validate our findings and investigate potential underlying mechanisms. Similarly, female individuals also exhibited a higher risk of dementia associated with flooding exposure. A survey conducted on 1116 respondents residing in communities severely affected by natural disasters revealed that a higher proportion of women experienced severe impacts on their health status, and they required a longer recovery compared to their male counterparts44. Additionally, a comprehensive meta-analysis indicated that females were more prone to experiencing depression following exposure to natural disasters as compared to men45. Several factors could contribute to the higher vulnerability of females to natural disasters, including their less effective coping strategies, more negative interpretations of disasters, higher sensitivity to stress hormones, lower self-efficacy levels, higher peritraumatic emotions, and subordinate familial roles compared to men45,46,47.
Notably, the results of our study indicate that participants with higher household income had a greater risk of developing dementia compared to those with lower household incomes. Previous research has indicated that low socioeconomic status increases vulnerability to natural disasters. However, Derek et al. discovered a non-linear relationship between income and deaths caused by natural disasters at the national level48. They reported that deaths increase with rising income until reaching a turning point. Additionally, Regina et al. analysed the association between natural disasters and income distribution in the United States. They reported that middle-income groups were particularly affected by natural disasters compared to low- and high-income groups49. This negative effect on the middle-income group can be primarily attributed to a decrease in wage49. Our study participants were residents in the UK who were more likely to live in less socioeconomically deprived areas. Therefore, the low-income groups in our study may be relatively wealthier than impoverished populations in developing countries. Another plausible explanation is that populations characterised by higher levels of education and household income tend to exhibit a lower risk of undetected dementia. This can be attributed to their increased utilisation of healthcare services and greater knowledge about dementia. Nevertheless, our study is the first to examine the long-term consequences of exposure to flooding on dementia. Further research is necessary to validate our findings and explore the underlying mechanisms involved.
In recent years, there has been a notable rise in the occurrence of devastating floods worldwide. These occurrences are primarily driven by climate change and urban development, which contribute to rising sea levels and the reduction of permeable green spaces while constructing on floodplains2,50. Consequently, flood risks are expected to worsen. Currently, ~50 million people globally are affected by dementia, which is projected to triple by 2050 as a result of population aging51. Based on our research findings, it is expected that the case of flood-related dementia will increase in the future. However, the 2020 report from the Lancet Commission on Dementia Prevention, Intervention, and Care only considers air pollution as an environmental factor in modifiable risk factors for dementia7. There is a need to place greater emphasis on the potential of floods to increase the risks of dementia. To prevent and mitigate the adverse impacts of floods, it is crucial to allocate more resources towards supporting psychosocial resilience and the overall well-being of people who have been exposed to floods. Such measures may include: prioritising older people for relocation to safe and stable accommodation instead of having them remain for extended periods in unfamiliar surroundings among unfamiliar faces; encouraging social contact; and helping them plan social activities.
This study has some limitations. The findings in the present study were derived from a nested case-control design, relying on a sub-analysis of data sourced from the UK Biobank. Therefore, caution should be warranted when interpreting the causal implications of these results. It is important to note that our participants from the UK Biobank were more likely to live in less socioeconomically deprived areas compared to the general population in the UK52. Therefore, the generalisability of our findings to broader populations, particularly individuals in low- and middle-income countries, may be limited. Future investigations involving diverse populations are necessary to validate our findings. Furthermore, data on some covariates (e.g., physical activity, smoking, and diet) were self-reported, which might have introduced recall bias. Despite adjusting for a range of confounders, residual confounding can still be present due to unknown or unmeasured factors. Moreover, the present analyses did not account for changes in socioeconomic status and behavioural lifestyles over time, as the necessary data were unavailable. Lastly, there is a likelihood that individuals tend to relocate to a different area, away from the flood-affected region, before the arrival of floodwaters, and subsequently return once the floods have subsided. As a result, the measured exposure may overstate the actual level of exposure, even though the property could still be affected by the floods. This circumstance can lead to an underestimation of the effect estimates.
In conclusion, this study presents epidemiological evidence supporting the link between long-term exposure to floods and an elevated risk of dementia. The relationship between exposure and risk followed an approximately linear pattern and persisted over multiple years. These results enhance the comprehension of the enduring consequences of flood exposure and have the potential to guide public health strategies aimed at mitigating the disease burden associated with floods.


Responses