Ultrafast humidity sensor and transient humidity detections in high dynamic environments
Introduction
Humidity sensors have played an important role in human life and production, such as indoor humidity measurement1, meteorological prediction2,3, climate research4,5, industrial manufacture6, and agricultural process7. However, due to the generally slow speed, current commercial humidity sensors are mainly used in static or slowly changing humidity monitoring.
In recent years, multiple active materials, such as MXenes8, halloysite nanotubes9, titania10,11, supramolecule12, cationic polymers13, transition metal dichaldogenides14, and graphene materials15,16,17,18,19,20,21, have been studied to develop fast humidity sensors, which has significantly improved the response speed of humidity sensors22,23. However, there are a few explorations into the detection of transient humidity changes in high-speed dynamic environments. Graphene oxide quantum dots (GOQDs) are rich in oxygen-containing functional groups such as hydroxyl, carboxyl, and epoxy groups, which are significantly related to the hydrophilicity of a material. The extremely small size provides a high concentration of surface adsorption sites and a huge specific surface area for GOQDs24. Therefore, GOQDs have a strong attraction to water molecules. On the other hand, the rate at which water molecules reach adsorption equilibrium in the humidity-sensitive film is closely related to the diffusion path of water molecules in the film. Therefore, the ultra-thin humidity-sensitive film is the key to the humidity sensor’s ultra-fast sensing performance25,26. Electrostatic self-assembly technology, as a simple and cost-effective method, can easily prepare nano-scale films and is widely used in the construction of high-performance humidity sensors27.
In this paper, we developed a humidity sensor based on GOQDs self-assembled on SiO2 microspheres (GSSM humidity sensor). Thanks to the ultrathin humidity-sensitive film from self-assembly and the curved surface of microspheres, the response time of the GSSM humidity sensor is reduced to less than 3 ms. As a result, it can easily detect transient humidity changes in high dynamic environments. (for example, speech airflow, water-containing explosions, and ultrahigh frequency respiratory).
Results and discussion
We mixed evenly Poly (diallyldimethylammonium chloride) (PDDA) solution with the suspension of 500 nm diameter SiO2 microspheres to form a layer of PDDA on the surface of SiO2 microspheres. An interdigitated electrode (IDE, Supplementary Fig. 1) was immersed into the above SiO2@PDDA mixed solution (see Supporting information S1 and Supplementary Fig. 2), so that a layer of SiO2@PDDA composite film was assembled on the surface of the IDE, in which SiO2 microspheres were encapsulated in the PDDA film. The IDE was then transferred into a dispersion solution of GOQDs with a diameter of 20 nm (Fig. 1a) so that a layer of negative-charged GOQDs was self-assembled on the positive-charged PDDA layer on the SiO2 microspheres by electrostatic force (Fig. 1c and Supplementary Fig. 3) to prepare a humidity sensor (Fig. 1d). The scanning electron microscopy images confirmed that a layer of PDDA/GOQDs ultrathin film is successfully assembled on the surface of silicon dioxide microspheres (Fig. 1e, f). The self-assembled GOQDs ultrathin film not only has a high specific surface area but also contains a large number of hydrophilic groups, such as -COOH, -OH, etc. (Fig. 1b), which are believed as the basic humidity-sensitive structure of the sensor prepared.

a TEM (TEM, transmission electron microscope) image of GOQDs (GOQDs, graphene oxide quantum dots). b FT-IR (FT-IR, Fourier transform infrared) spectrum of GOQDs. c Schematic diagram of the electrostatic self-assembly process of the sensor. d Photograph of the sensor and schematic diagram of the sensor structure. e SEM (SEM, scanning electron microscopy) images of pure silica microspheres. f SEM images of silica microspheres with assembled GOQDs.
We characterized the sensitive response of the sensor to different humidity generated by saturated salt solutions (Fig. 2a), which is plotted as its impedance change with relative humidity (Fig. 2b). The equivalent resistance of the GSSM humidity sensor varies over 2 orders of magnitude from 11% RH to 97% RH, similar to that of the planar self-assembled GOQDs humidity sensor28. The direct current resistance of the GSSM humidity sensor varies by four orders of magnitude from low humidity to high humidity (Supplementary Fig. 4). The GSSM humidity sensor’s humidity hysteresis (<0.59% RH) is significantly lower than that of the planar self-assembled GOQDs humidity sensor(<2.5% RH)28. This implies that the humidity sensor based on self-assembled GOQDs@SiO2 microspheres may have better response and recovery characteristics.
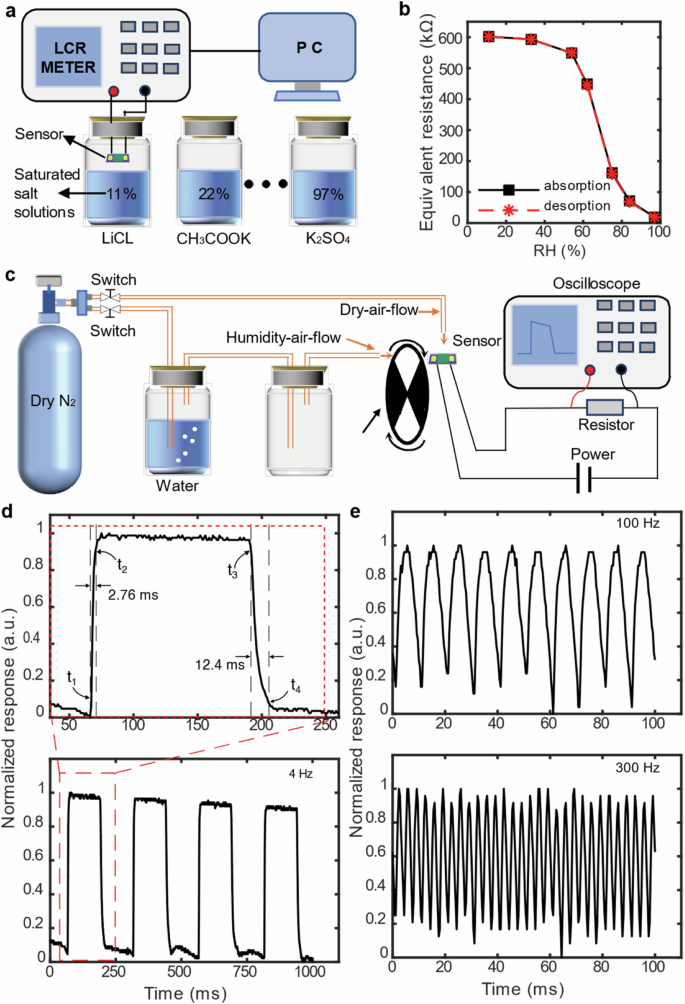
a Schematic illustration of the testing equipment for sensitive characteristics of the sensor. b Sensitivity characteristics of the sensor. c Schematic illustration of the testing equipment for the response speed of the sensor. d Normalized response of the sensor to humid flow chopped at 4 Hz and estimated response time (2.76 ms) and recovery time (12.4 ms) of the sensor. t1 and t2 represent the times when the response rises to 10% and 90% of the stable value, respectively. t3 and t4 represent the times when the response drops to 90% and 10% of the stable value, respectively. e Normalized response of the sensor to humid flow chopped at 100 Hz and 300 Hz.
The periodic humidity modulation with an adjustable frequency from 4 Hz to 300 Hz was generated by a chopper. The interruption time of the high-humidity airflow blown towards the sensor was controlled by adjusting the rotational frequency of the chopper (Fig. 2c). In the periodic humidity modulation, the response time and recovery time (defined as the time to go from 10% to 90% of the high humidity value and vice versa) of the sensor were measured through a partial voltage waveform on the constant resistor by an oscilloscope. The resultant voltage waveforms show a response time of about 3 ms and a recovery time of about 12 ms (Fig. 2d, and Supplementary Video 1), which is shorter than those of all electronic humidity sensors in the ambient atmosphere ever reported (Table 1). Moreover, the sensor can follow higher frequency humidity modulations, even up to 300 Hz (Fig. 2e and Supplementary Video 2). The GSSM humidity sensor also demonstrates good long-term stability (Supplementary Fig. 5) and small temperature fluctuation (Supplementary Fig. 6).
To clarify the ultrafast response mechanism of the GSSM humidity sensor, we studied the Nyquist impedance spectra of the sensor under different humidity (Fig. 3a). At low humidity, Nyquist impedance spectra semicircle characteristic of the sensor in the whole frequency region denotes the intrinsic carrier migration dominated by the hopping mechanism of protons29, the equivalent circuit tends to become a simple RC circuit (Fig. 3b and Supplementary Fig. 7)25. However, as the humidity increases to 54% RH, a short tail representing Warburg impedance appears at the end of the semicircle in the low-frequency region (Fig. 3c). This implies that the carriers transport begins to be dominated by a typical proton Grotthuss mechanism, which is due to the formation of continuous water molecular network absorbed on the sensor surface under high humidity30. The current intensity of the Grotthuss mechanism depends on the thickness of the adsorbed water molecule layer31, which is determined by the ambient humidity. Therefore, as humidity increases, the radius of the impedance spectrum’s semicircle decreases. Notably, the humidity at the short tail begins to appear (54% RH), which is very close to the turning point where the impedance response curve of the sensor increases rapidly with humidity change (Fig. 2b), indicating that the impedance response of the sensor to humidity change is strongly dependent on the transition from dry to wet on the sensitive surface32. Compared with the planar structure, the addition of microspheres increases the contact area of GOQDs film with water molecules by nearly three times in theory (Fig. 3d), and also improves the roughness of the sensor substrate. The smaller water contact angle also indicates that the GOQDs film is more “hydrophilic” (Fig. 3e)33. Meanwhile, the nanoscale self-assembly thickness (Fig. 3f) shortens the diffusion time of water molecules in the sensitive GOQDs film. The joint action of all those factors quickens the speed of the sensor.
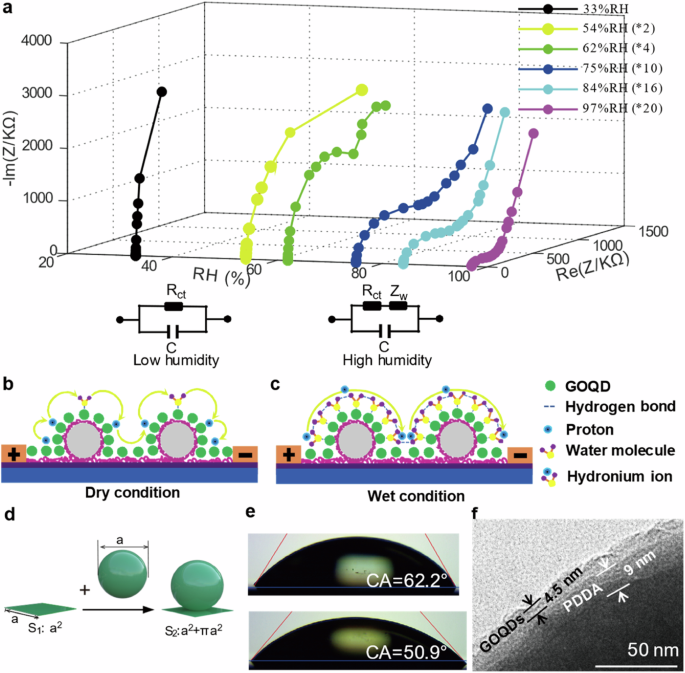
a Nyquist plots of the impedance of the sensor at various RH conditions. b Conductivity mechanisms of the sensors under low humidity. c Conductivity mechanisms of the sensors under high humidity. d Schematic diagram of sensitive film surface area change caused by microsphere introduction (S1 and S2 denote the surface area of the corresponding structures). e The water contact angles (CA) of planar (62.2°) and on-microsphere GOQDs (GOQDs, graphene oxide quantum dots) film (50.9°). f TEM (TEM, transmission electron microscope) image of the sensitive film on the microsphere.
Speech activity detection
It is well known that speech airflow is always accompanied by exhaled water vapor, so people have long been interested in the relationship between humidity and speech activities. Some researchers suggested the effects of humidity on speech quality34,35,36 and even on human language evolution37,38, however, these research works are generally carried out under static or stable humidity conditions. The dynamic characteristic of humidity in speech airflow and its relationship with speech activities remain obscure due to the slow response speed of traditional humidity sensors25,39.
In this paper, the GSSM humidity sensor (Sensor 1) has been applied to detect the transient humidity variation in speech activity (Fig. 4a). When a subject spoke to the humidity sensor, the real-time partial voltages on the constant resistance connected in series with the GSSM humidity sensor were collected as the humidity speech signal. Another slower humidity sensor (Sensor 2) with response time and recovery time of 350 ms and 1100 ms, which is much faster than most commercial humidity sensors40, was used for comparison. First, the subject pronounced some different English letters (“A”, “C”, “F”, “W”, and “X”) about 5 cm (Supplementary Fig. 8) away from the sensors, respectively. For Sensor 2, speech humidity variation signals of these letters are roughly the same, only slightly different (Fig. 4b, top, and Supplementary Video 3). However, for Sensor 1, details appear in the humidity variation signal in the speech airflow of these letters (Fig. 3b, bottom, and Supplementary Video 4). Furthermore, these signal details are more evident in speech humidity variation signals of different English words (“left”, “five”, “fly”, and “zoo”) (Fig. 4c, and Supplementary Video 5). These rich signal details illustrate that the humidity in speech airflow is rapidly fluctuating. The frequency domain analysis shows that the high-frequency components of the fluctuations enter the frequency range of infrasonic or even audible sound waves (Fig. 4e), which is far more than people’s previous understanding of humidity change rate in speech airflow. The differences in speech humidity variation details make it easy to distinguish different words, just like the acoustic signals of these words collected by a microphone (Fig. 4d). When the speech humidity signals of the above words are collected repeatedly multiple times (Fig. 4f), it is found that the repeated speech humidity signals of each word seem to show similar features. To clarify this point, Pearson correlation coefficients of the repeated signals of these words have been analyzed41, as shown in Fig. 4g, confirming a significant correlation among the repeated speech humidity signals of the same word. There is also a strong correlation between the speech humidity signals of different individuals (Supplementary Fig. 9). These results reveal that the signal of humidity variations in speech airflow is closely related to speech activity, which allows the ultrafast humidity sensor to detect speech activities like a microphone. We call it a humidity microphone with certain robustness to swing (Supplementary Fig. 10).
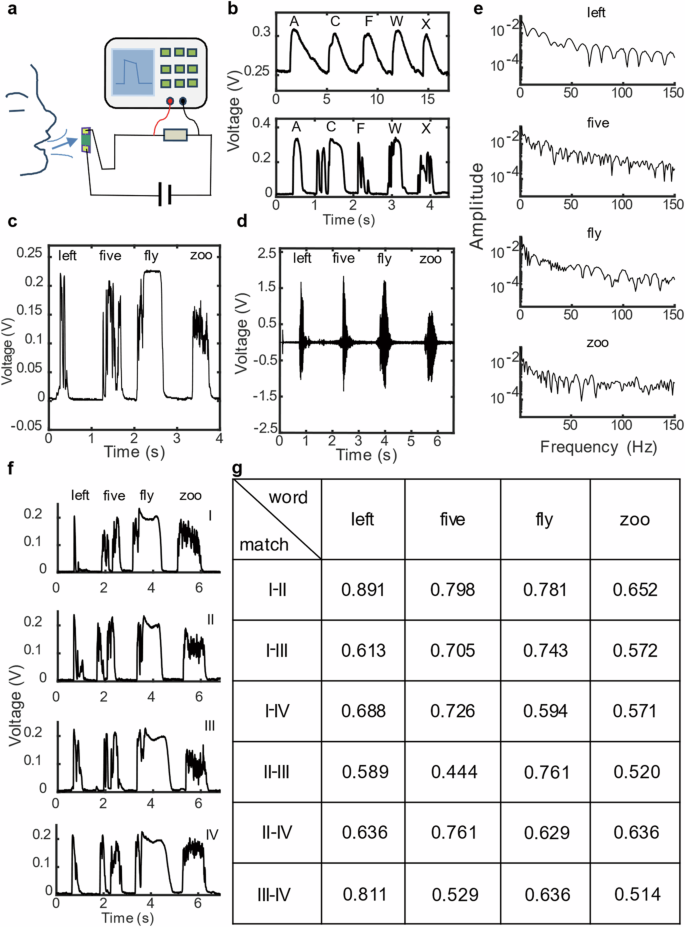
a Schematic illustration of speech activity collection. b Speech humidity variation signals of English letters (“a”, “c”, “f”, “w”, and “x”) from Sensor 2 and Sensor 1. c Speech humidity variation signals of English words (“left”, “five”, “fly”, and “zoo”) of Sensor 1. d Microphone signals of the English words. e Frequency domain analysis for speech humidity signals of the English words. f Repetitively acquired speech humidity variation signals of the English words. g Pearson correlation coefficient of Speech humidity variation signals in (f).
A simple speech activity detection system based on the humidity microphone was designed to verify the feasibility of a humidity microphone for detecting speech activity (Fig. 5a), in which the speech humidity signals of English words are collected by the GSSM humidity sensor and then recognized on a computer. Fifty milliseconds time window and 30 ms overlapping Fourier transform are used as time-frequency estimation of the signals. The signal’s eigenvectors are extracted by principal component analysis (PCA) (Fig. 5b), and linear discriminant analysis (LDA) (Fig. 5c) is used to classify and recognize feature vectors42,43. For the four English words (“left”, “fly”, “five”, and “zoo”), we completed more than 30 times recognition experiments in a quiet environment and obtained a recognition rate of up to 91% (Fig. 5d and Supplementary Video 6 (quiet)). However, when the response time and recovery time of the humidity sensor used were slower than the GSSM humidity sensor, the recognition rates of these words rapidly decreased, indicating that the response speed of the sensor has an impact on the humidity speech activity detection (Fig. 5e). We also completed recognition experiments in a noisy environment using GSSM humidity sensor, its recognition rate also achieved 91% (Fig. 5f, and Supplementary Video 7 (noisy)), which demonstrates excellent noise immunity of the humidity microphone. To understand its noise immunity, the signal frequency spectrograms of these words collected by the humidity microphone and an electromechanical microphone in quiet and noisy environments were analyzed separately. It could be seen that the frequency spectrograms of acoustic signals from the electromechanical microphone are greatly affected by noise, while those of the speech humidity signals collected by the humidity microphone are almost unaffected by noise (Fig. 5g–j). This should be attributed to the fact that the humidity microphone is insensitive to mechanical sound waves.
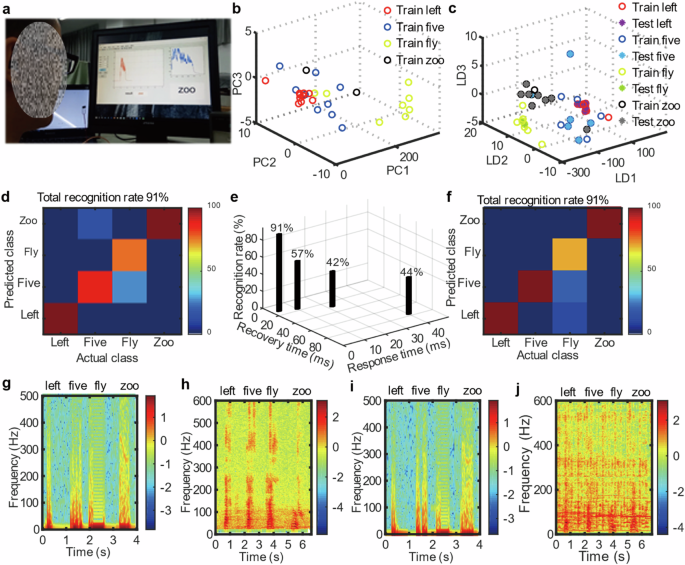
a An image of speech activity detection system based on the GSSM humidity sensor. b PCA (principal component analysis) of speech humidity variation signals of English words (“left”, “five”, “fly”, and “zoo”). c LDA (linear discriminant analysis) of speech humidity variation signals of the English words. d Confusion matrix for word recognition in a quiet environment. e Word recognition rates of the sensors with different response and recovery times. f Confusion matrix for word recognition in a noisy environment. The frequency spectrograms of speech humidity variation (g) and microphone (h) signals of the English words in a quiet environment. The frequency spectrograms of speech humidity variation (i) and microphone (j) signals of the English words in a noise environment.
Common electromechanical acoustic sensors, such as various microphones, employ different methods to convert the air pressure variations generated by acoustic waves into electrical signals44,45,46. These sensors always face enormous challenges of environmental sound noise due to the absence of the cocktail party effect of the human auditory system47,48. Although some new anti-noise speech sensors, e.g., epidermal mechano-acoustic sensor, mechanical crack-based sensor, and optical microphone, have been proposed49,50,51, it is difficult to eliminate the influence of mechanical noise as these sensors are still essentially sensitive to mechanical vibration signals. Moreover, these new sensors are not easily installed on mobile speech devices due to the limitation of their epidermal working principles or big volume49,50. The humidity microphone in this paper is not only inherently insensitive to mechanical acoustic noise in the environment, but also integrated easily with mobile devices such as mobile phones and earphones. This feature presents broad-ranging application prospects in mobile speech devices with noise immunity.
Water-containing explosion monitoring
The explosions of water-containing pressure vessels such as boilers are common safety production accidents in industrial fields52,53. As the existence of water can not only affect the explosion intensity but also cause a water-related secondary explosion54, it is particularly important to quickly identify the change of water vapor content in an explosion airflow for the rational treatment of water-containing explosion accidents. Although some sensors, such as pressure sensors, sound sensors, or high-speed cameras, have been widely used for explosion monitoring55. However, these sensors lack good selectivity. Therefore, they struggle to effectively differentiate changes of explosive media (for example, the change of water vapor at the moment of explosion). This limitation hinders their ability to track the cause of explosions and prevent secondary hazards.
As shown in Fig. 6a, a balloon was utilized to simulate a water-containing explosion. We poured a certain amount of water into the balloon, and then continuously injected air into the balloon through the catheter until the balloon exploded. At that moment, the explosion airflow from the blasting balloon was rapidly released into the surrounding environment, resulting in a sharp change in the air humidity. We monitored the above-mentioned explosion process with a commercial humidity sensor (SHT30, SENSIRION Inc.) and a GSSM humidity sensor, respectively (Fig. 6b, c). The signal recorded by the SHT30 sensor peaks in 5.5 s (Fig. 6d and Supplementary Video 8) with a waveform quite different from the typical pressure shock wave generated by a general explosion. It suggests that the slow response speed of the commercial sensor does not reflect the real change in water vapor at the moment of explosion. While the signal of the GSSM humidity sensor only takes about 4 ms to peak (Fig. 6e and Supplementary Video 9), whose waveform is similar to the pressure shock wave of a classical explosion56. The tests illustrate that the GSSM humidity sensor can more accurately monitor the humidity change produced by water-containing explosions than commercial sensors, which is very important for timely alarm and cause analysis of explosion accidents.
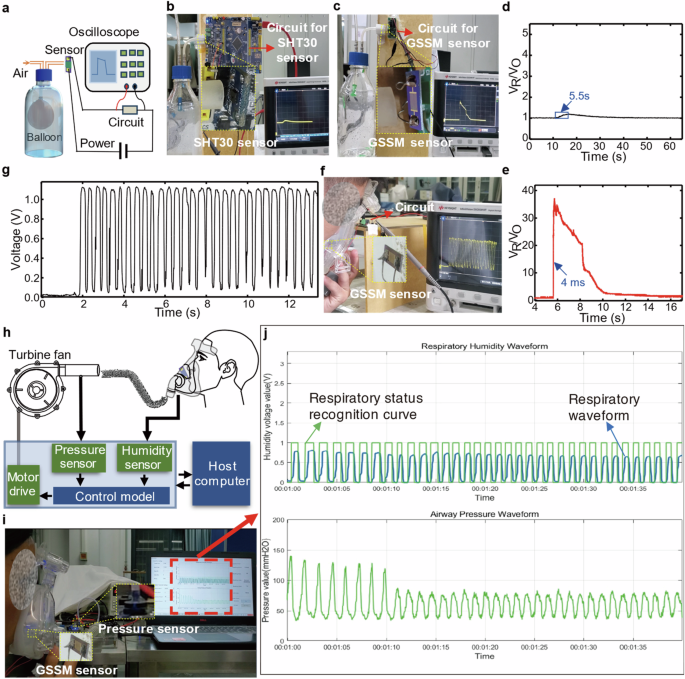
a Schematic illustration of a water-containing explosion monitoring experiment setup. b Real-time monitoring of water-containing explosion using SHT30 sensor. c Real-time monitoring of water-containing explosion using the GSSM humidity sensor. d Water-containing explosion experimental data from SHT30 sensor. e Water-containing explosion experimental data from the GSSM humidity sensor. f Experimental photo of ultrahigh frequency respiratory monitoring based on the GSSM humidity sensor. g High-frequency respiratory monitoring signals from the GSSM humidity sensor. h Schematic illustration of humidity triggering system of the non-invasive ventilator. i Humidity-triggering test of the non-invasive ventilator. j Effect of humidity triggering for the non-invasive ventilator during high-frequency breathing.
Ultrahigh-frequency respiration monitoring
In recent years, humidity sensors have attracted more and more attention in respiratory monitoring as they can sense humidity changes in the respiratory airflow with non-contact, high accuracy, small size, and low cost8,9,57,58,59,60,61,62. However, the respiratory rate of some extremely abnormal respiratory activities, such as transient tachypnea of the newborn63, may exceed 100 breaths per minute63,64. The response speed of the existing humidity sensors makes it difficult to meet the needs of this ultrahigh frequency respiratory monitoring. Our ultrafast humidity sensor provides the possibility to monitor this extreme respiratory behavior.
As shown in Fig. 6f, g and Supplementary Video 10, the GSSM humidity sensor can still accurately detect the humidity change in breathing airflow even if the simulated respiratory rate of the subject reaches 150 breaths per minute. The ultrafast sensor will promote the development of ultrahigh frequency respiratory monitoring technology.
Humidity-triggering of non-invasive ventilator
Non-invasive ventilators are important medical devices for the treatment of critical and severe respiratory diseases such as severe COVID-19 pneumonia and acute respiratory failure65,66,67,68. Traditional non-invasive ventilators trigger mechanical ventilation mainly by detecting changes in patients’ exhaled airway flow or pressure. These triggering methods are easily interfered with by the ventilator output flow or pressure to result in man-machine confrontation69,70,71, which greatly affects the treatment for critically ill patients with shortness of breath.
Here, we propose a humidity–triggering method for a non-invasive ventilator (Fig. 6h, i) based on the GSSM humidity sensor. This method diagnoses a patient’s respiratory behavior by detecting the humidity change in respiratory airflow by the GSSM humidity sensor and then controls the switching of expiratory and inspiratory pressure of the ventilator by a main control module to achieve an assisted ventilation function in dual-level mode. The changes in respiratory humidity and airway pressure are viewed in real time by a host computer. The system can accurately trigger mechanical ventilation via the ultrafast humidity sensor even if the subject’s respiratory rate exceeds 60 breaths per minute (Fig. 6j and Supplementary Video 11), which displays good human-machine synchronization. The humidity change of the respiratory airflow is less sensitive to the ventilator output airflow pressure or flow rate. Therefore, it effectively reduces the interference from the output airflow of the ventilator.
Conclusion
In this paper, we have developed an ultrafast electronic humidity sensor, the GSSM humidity sensor, to address the challenges faced by current commercial humidity sensors in dynamic environments. The GSSM humidity sensor was based on self-assembled GOQDs ultrathin film on the surface of SiO2 microspheres. Compared to the flat structure, the GSSM humidity sensor enhances the specific surface area and hydrophilicity. The combination of the ultra-thin humidity-sensitive film and the curved surface of the microsphere enables the GSSM humidity sensor to achieve unparalleled response and recovery times of 2.76 ms and 12.4 ms, respectively.
Using the GSSM humidity sensor, the correlation between instantaneous humidity variations in speech airflow and speech activity has been confirmed. Based on this correlation, a humidity-based speech activity detection system has been demonstrated, which has good noise resistance. The sensor can also detect the shockwave-like instantaneous humidity change in water explosions and ultrahigh-frequency respiratory humidity signal with a maximum of 150 breaths per minute. Furthermore, a humidity-triggering method in non-invasive ventilators has been proposed, which helps reduce human-machine conflicts compared to traditional pressure-triggering methods.
Methods
Chemicals and materials
Poly (diallyldimethylammonium chloride) (PDDA) (20 wt% in water, average MW: 20,000–35,000) was purchased from Sigma Aldrich Trading Co., Ltd in China. Silicon dioxide microspheres (with a diameter of 500 nm) were purchased from Chongqing Nano New Materials Technology Co., Ltd. GOQDs solution (1 mg ml−1, sheet size 20 nm) was obtained from China Limited Company Nanjing XFNANO Material Technology Co., Ltd. All chemicals are analytical grade chemicals.
Preparation of interdigital electrodes (IDE)
The interdigitated Ti layer with thicknesses of 100 nm was deposited on the silicon dioxide insulation layer of the N-type silicon wafer via magnetron sputtering. Then 300-nm-thick Au electrodes were deposited on the Ti layer via magnetron sputtering. The width and separation of electrodes were both 10 μm.
Preparation of 0.5 mg ml−1 SiO2 suspension
Five milligrams of silica microspheres powder was weighed and added to a clean empty reagent bottle (20 ml capacity), then 10 ml of deionized water (DIW) was added and the mixture was sonicated for an hour at room temperature. 0.5 mg ml−1 SiO2 suspension was obtained.
Preparation of 10 mg ml−1 PDDA aqueous solution
One hundred milligrams of PDDA was weighed and added to a clean empty reagent bottle (20 ml capacity), then 10 ml of DIW was added and the mixture was sonicated for an hour at room temperature. 10 mg ml−1 PDDA aqueous solution is obtained.
Preparation of SiO2@PDDA solution
Ten milliliters of 10 mg ml−1 PDDA aqueous solution and 10 ml of 0.5 mg ml−1 SiO2 suspension were mixed in a clean empty beaker, followed by sonicated for an hour at room temperature.
Preparation of GSSM humidity sensor
Finally, an IDE (cleaned with DIW and dried in pure nitrogen gas) was immersed in the SiO2@PDDA solution for 10 min so that a layer of SiO2@PDDA microsphere composite film was attached to the surface of the IDE. Next, the loosely attached SiO2 and PDDA on the IDE surface were rinsed off with DIW. Then, the IDE was transferred to an oven at 50 °C and dried for 2 h (or dried in N2). Subsequently, the IDE was immersed in the GOQDs dispersion for 10 min to assemble the GOQDs on the IDE. Again, the loosely attached GOQDs were rinsed off with DIW. Finally, the IDE was transferred to an oven at 50 °C and dried for 2 h (or dried in N2) to obtain the GSSM sensor.


Responses