Ultrasensitive detection of six sepsis-associated proteins in neonatal saliva
Introduction
Neonatal infection and in its most severe form, sepsis, are leading causes of infant mortality worldwide1. Sepsis is defined by a systemic illness caused by a dysregulated host response to an infection with end-organ failure. While most cases of sepsis are associated with positive culture results, the inability to isolate a causative organism does not definitively exclude a sepsis diagnosis2. Such cases are referred to as “culture negative sepsis,” and often result in clinicians providing prolonged antibiotic administration at levels equal to or greater than culture-confirmed sepsis cases3. This diagnostic ambiguity has contributed to the overuse of antibiotics in neonatal intensive care units4,5. Furthermore, challenges inherent to culture-based approaches—such as slow time-to-result, high blood volume requirements (≥1 mL), and false positives due to contamination—highlight the critical need for improved sensitivity and speed in diagnostic tests for neonatal infections6.
Research efforts to identify sepsis in the newborn have led to the evaluation of over 200 candidate biomarkers, with a focus on serum-derived inflammatory proteins such as acute phase reactants, cytokines, and chemokines7,8. Serum measurements of the acute phase reactants C-reactive protein (CRP) and procalcitonin (PCT) are already routinely incorporated in the clinical assessment of neonatal sepsis9. Similarly, other acute phase reactants are elevated during infection including liposaccharide binding protein (LBP)10,11 and serum amyloid A1 (SAA1)12,13. In addition, several studies have supported the diagnostic value of measuring blood-based chemokines including CCL20, CXCL6, CXCL1214,15, as well as adipokines such as resistin16,17. Yet to date, no single biomarker has proven to be sufficient for the accurate and rapid diagnosis of neonatal sepsis. Instead, blood-based panels combining early- and late-phase inflammation markers are being considered as the path forward for neonatal diagnostics18. A limitation of this approach is that repeated blood sampling poses significant risks to neonates, particularly preterm infants, due to an increased risk of anemia and potential adverse effects on neurodevelopment due to painful stimuli associated with phlebotomy19,20,21.
Saliva has emerged as a promising non-invasive alternative to blood for the detection of neonatal infections22,23,24. Salivary glands serve as a filtration system, allowing blood analytes to enter into the oral cavity via passive diffusion or active transport25,26. These mechanisms have enabled the detection of serum-based inflammatory proteins such as cytokines15,27,28 and CRP23 in saliva, with the latter demonstrating a significant correlation with serum levels22. Preliminary research has shown that measuring these biomarkers in saliva can effectively discriminate between infected and uninfected infants27,29,30,31,32,33,34,35. To date, approximately 14 inflammatory markers have been identified in neonatal saliva; however, with nearly 200 candidate biomarkers known, the diagnostic potential of the neonatal salivary proteome is only beginning to be explored. Given that analyte concentrations in saliva are reported to be 100- to 1000-fold lower than in blood36, ultra-sensitive detection methods are essential for advancing salivary diagnostics.
Single-molecule array (Simoa) is a digital ELISA platform that can detect analytes in biofluids at sub-femtomolar concentrations (10−15 M), a 1000-fold improvement in sensitivity compared to traditional ELISAs37. An overview of the Simoa assay and the workflow for detecting salivary proteins can be seen in Fig. 1. In Simoa, target analytes are first captured onto antibody-coated microscopic beads. The captured analyte is labeled with biotinylated detector antibody and streptavidin-conjugated β-galactosidase (SβG), forming single immunocomplex sandwiches. Individual beads are isolated into femtoliter sized wells, flooded with resorufin-β-D-galactopyranoside (RGP) substrate, and sealed with oil. The catalytic reaction of SβG and RGP results in the formation of a fluorescent product that is detectable only when a bead carries a full immunocomplex sandwich. Single molecule resolution is achieved by using a large excess of beads relative to the number of target analytes in the sample, which ensures that the percentage of beads carrying an immunocomplex follows a Poisson distribution where each bead captures either zero or one analyte molecule38. Thus, the number of analytes is determined by counting the number of “on” wells, which contain a complete ELISA complex. The proportion of active, enzyme-associated beads relative to the total detected beads is used to determine the average number of enzymes per bead (AEB). Here, we use the Simoa platform to quantify six sepsis-associated biomarkers from 40 salivary samples of infected and uninfected neonates. We analyzed non-interleukin inflammatory proteins that are known to be elevated in the serum of infected infants15 including the acute phase reactants serum amyloid A1 (SAA1), lipopolysaccharide-binding protein (LBP), the chemokines CCL20, CXCL6, CXCL12, and the adipokine resistin, representing a diverse range of protein types involved in the immune response to infection. These biomarkers were chosen to capture both early-phase (SAA1, resistin, CXCL6, LBP)6,7,39,40 and late-phase (CXCL12, CCL20)14,15,41 immune responses. This study aims to determine if salivary biomarkers detected using ultra-sensitive assays are differentially expressed between infected and uninfected infants.
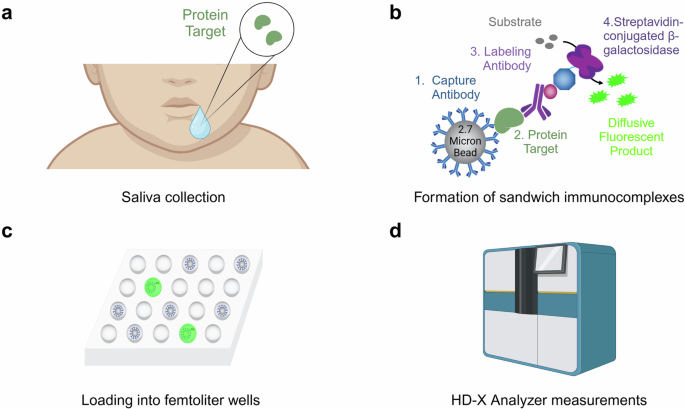
a Saliva is collected from an infant via a modified syringe and a low wall suction (collection device not pictured). For a detailed protocol description, see “Saliva acquisition” in the Methods. b Simoa consists of the formation of sandwich immunocomplexes on micron-sized beads. Substrate is added to activate a fluorescent reaction. c Each microwell array has the space to confine a single bead within each well, enabling single molecule counting. d Measurements are performed by the Quanterix HD-X Analyzer, with the output being the average number of enzymes per bead (AEB). Figure created, in part, in BioRender.com. Rolando, J. (2025) BioRender.com/u36z800.
Results
Neonatal participants
Twenty neonates participated in this study, providing 40 saliva samples for analysis. Pertinent demographic and clinical data can be found in Table 1. Forty-five percent of participants were deemed to be infected based upon positive blood culture results and/or prolonged antibiotic administration (Table 1). Among the infected category, half of the infants had culture positive results for bacteria, while half of the infants were treated for five or more days with antibiotics, indicating symptoms of a clinical infection despite negative culture results (Table S1).
Assay development
We developed a panel of six Simoa assays to detect inflammatory biomarkers in saliva, related to the neonatal immune response to infection. Each assay was evaluated by performing a serial dilution of the recombinant protein to generate eight-point calibration curves. Each assay was also optimized for the most sensitive limit of detection (LOD), highest signal-to-noise ratio, and largest dynamic range by titrating both the detector antibody concentrations and streptavidin-beta-galactosidase (SβG) enzymatic label. We defined the LOD as the mean signal of the blank plus three times the standard deviation of the noise. Signal-to-noise ratio was calculated as both the ratio of the mean signal of the highest calibrant to the blank, as well as the lowest detectable calibrant to the blank. We defined the dynamic range as the difference in concentrations between the lowest detectable calibrant to the smaller of 15 AEB, or the upper asymptote of the 4PL regression. Through this systematic process of optimization, we enhanced the performance of the Simoa assays, to yield the optimized calibration curves (Fig. 2), and final assay conditions (Table S2). Titrating both SβG and detector was necessary for assays with initial background signals less than 0.005 AEB, such as CXCL6 and CCL20, where low background AEB would result in assays with unstable LODs. Antithetically, assays for SAA1 and resistin required decreasing reagent concentrations to expand the dynamic range, as the fluorescence signal intensity at the upper end of the calibration curves exceeded the quantification limit of the HD-X Analyzer. Compared to the commercial ELISA kits, these assays show, on average, 44-fold improvements in analytical sensitivity (Table S3).
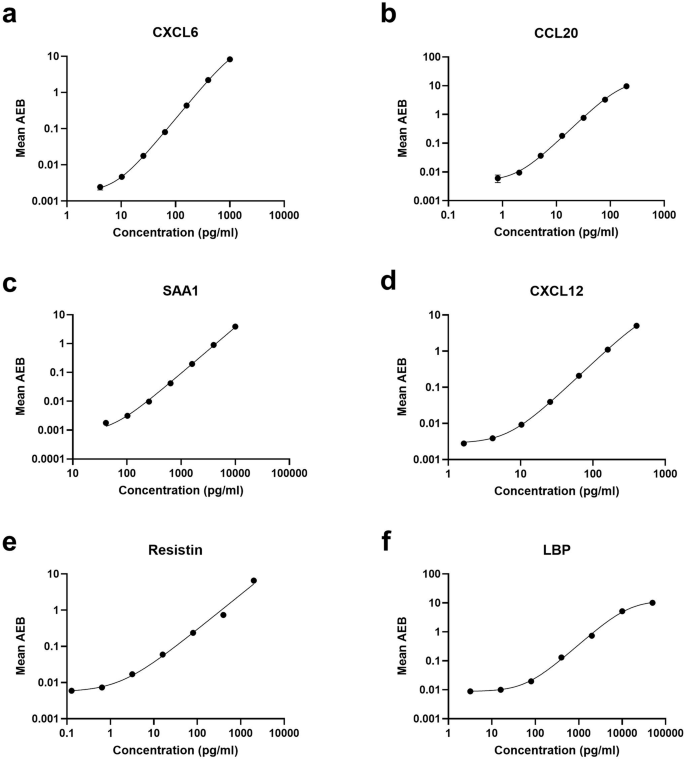
a CXCL6. b CCL20. c SAA1. d CXCL12. e Resistin. f LBP. For all assays, a recombinant protein standard was serially diluted to maximize analytical sensitivity, signal-to-noise ratio, and dynamic range. Error bars represent the standard deviations of triplicate technical replicates. A 4PL curve with 1/y2 weighting was fit to each curve.
To validate the assays’ performance in saliva, we performed dilution linearity of both spiked and endogenous proteins (parallelism) in commercial healthy-adult saliva (Fig. 3). We acknowledge that there are differences between neonatal and adult saliva compositions (protein profiles, enzymatic content, electrolyte balance), however, adult saliva was used as a surrogate due to the limited availability of neonatal saliva and to facilitate assay optimization. For dilution linearity testing, all analytes were initially diluted four-fold before subsequent two-fold serial dilution until 256-fold dilution was achieved (Figure S1). A “linear regime” was selected if the signal from three adjacent dilutions yielded 80–120% of the expected recovery range for most samples, as recommended by the FDA Bioanalytical Method Validation Guidance for Industry guidelines42. Recovered signals for the majority of biomarkers were measured within the 80–120% linearity, over a wide range of concentrations, indicating minimal interfering matrix effects from saliva with the antigen-antibody binding mechanism of Simoa (Fig. 3).
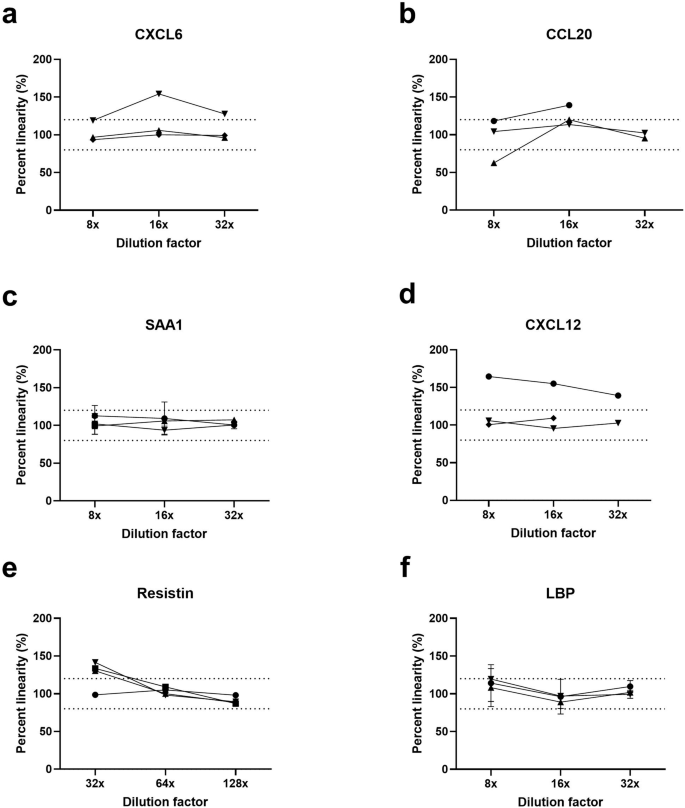
a CXCL6. b CCL20. c SAA1. d CXCL12. e Resistin. f LBP. Each assay was tested by diluting three unique healthy-adult saliva samples, with an additional fourth sample spiked with the recombinant protein at a concentration in the linear regime of the assay calibration curve. Error bars represent the standard deviation of duplicate technical replicates. Concentration values were interpolated based on the assay calibration curves in Fig. 2.
Spike-and-recovery was performed at low, medium, and high concentrations to cover the full range of expected endogenous concentrations by adding recombinant protein to three separate healthy-adult saliva samples, each at a selected dilution factor. Spike recovery was calculated by subtracting the endogenous signal of the saliva from the observed concentration after spiking, then dividing by the expected concentration of the spiked protein. An assay demonstrated good recovery if the Percent Recovery fell between 80 and 120% of the expected spiked concentration42, which we observed for most analytes (Table 2). The assays for CXCL12 and resistin each had one spike concentration fall below the desired 80–120% range; however, since the other measurements fell between this range, we chose to move forward with these two biomarkers, taking note of this limitation while quantifying clinical samples.
Quantification of protein analytes from neonatal saliva
Simoa assays detected and quantified all biomarker candidates in neonatal saliva in the majority of clinical samples. Concentrations generally fell within the quantifiable range of the assay. However, CXCL12 was detected in only 18 of 40 samples, indicating even the ultra-sensitive Simoa had insufficient analytical sensitivity for this biomarker. In cases where biomarkers could not be measured, the concentrations were typically below the assay’s limit of detection (LOD) (Table 3). Conversely, biomarkers CCL20, CXCL6, SAA1, and resistin were occasionally measured at concentrations exceeding the assay upper limit of quantification (ULOQ), defined as the most concentrated calibrator. In total, out of 240 possible measurements (six biomarkers per sample for 40 samples), 61.7% of measurements were successfully quantified (Table 3).
The median concentrations of most of the tested biomarkers were elevated in infected infants relative to uninfected infants, with the log hazard ratio of biomarkers CXCL6, CCL20, and SAA1 being significantly elevated, p < 0.05, and sufficiently powered, 1−β > 0.8 (Fig. 4). LBP showed a trend towards significance (p = 0.06), but its statistical power was insufficient to draw definitive conclusions (1−β = 0.468). Future studies with larger sample cohorts may help confirm differential expression of this protein. For CXCL12, resistin, and total protein, no significant differences were observed between infected and uninfected groups (p > 0.05), and their respective power values indicate limited capacity to detect meaningful associations in the current dataset. The specific median concentrations, interquartile range (IQR), log hazard ratio, two-tailed level of significance, and power are reported in Table 4. Additional information on replicate measurements and their corresponding coefficient of variation (CV) percentages are available as a supplementary file. Within the infected infants, we found that the median biomarker concentration was elevated in the culture-positive group compared to the culture-negative group, except for CXCL12 (Figure S2).
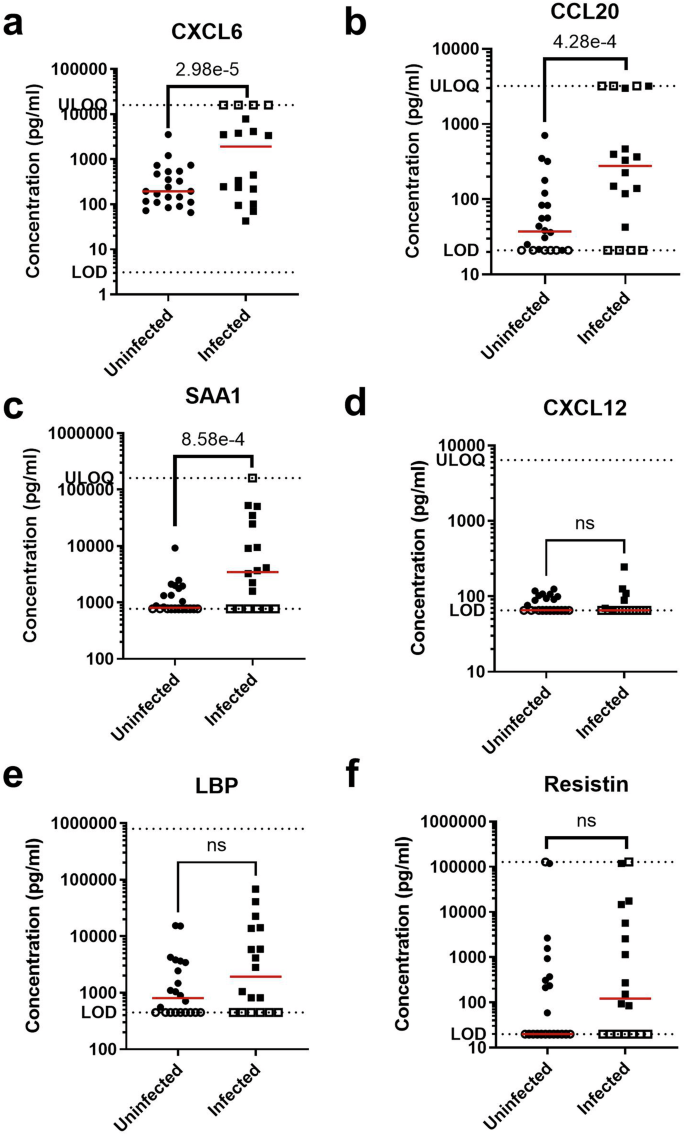
a CXCL6. b CCL20. c SAA1. d CXCL12. e LBP. f Resistin. Each sample measurement is the mean of duplicate technical replicates. Filled points indicate measurements within the assay dynamic range; open points indicate measurements above the upper limit of quantification (ULOQ) or below the limit of detection (LOD), as indicated by the dotted lines. Red lines indicate median concentrations. Significance level is reported as the p-value of the interval-censored parametric proportional hazard model, which accounts for data censoring at the LOD or ULOQ.
Statistical examination of possible confounders to protein analytes
To assess if demographic differences between the infected and uninfected groups, or relationships among multiple features (biomarkers or demographics data), influenced the observed protein concentrations, we performed a series of analyses including a Pearson Correlation Matrix, Multiple Linear Regression by Ordinary Least Squares, and Variance Inflation Factor (VIF) calculations.
The bivariate Pearson’s Correlation Matrix (Fig. 5) was calculated to highlight linear relationships between features. This analysis showed a strong positive correlation between birth weight and gestational age, a biologically plausible finding. Similarly, a strong positive correlation between CCL20 and CXCL6, suggesting potential collinearity. In addition, CCL20 and CXCL6 both exhibited moderate negative correlations with gestational age and birth weight, and moderate positive correlation with LBP.
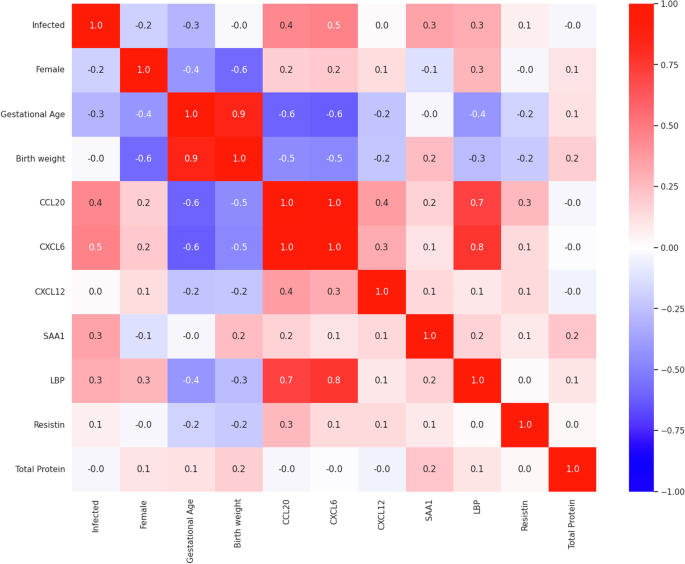
Correlation coefficients represent potential linear relationships between pairs of features from strongly negative (−1, blue) to strongly positive (+1, red), with values near zero indicating no linear relationship.
We next assessed if the demographic features gestational age, birth weight, or sex were possible confounders to the observed biomarker concentrations. Multiple Linear Regression (MLR) analyses were performed using Ordinary Least Squares (OLS), with infection status as the primary predictor and gestational age, birth weight, and sex included as potential confounders. Model-level metrics, including R-squared, adjusted R-squared, F-statistics, and their associated p-values, were used to evaluate the explanatory power of the predictors for each biomarker (Table S4). The R-squared values ranged from 0.060 (CXCL12) to 0.474 (CXCL6), indicating varying degrees of variance explained by the predictors. Adjusted R-squared values were lower for most biomarkers, reflecting the modest contribution of the confounders after accounting for the number of predictors. Significant F-statistics for CCL20 (p = 2.60 × 10⁻⁴), CXCL6 (p = 1.21 × 10⁻⁴), LBP (p = 0.023), and SAA1 (p = 0.011) indicate that the included predictors collectively explained a significant proportion of the variance for these biomarkers.
Predictor-level metrics provided further insight into individual contributions to the biomarker concentrations (Table S5). Infection status, the primary hypothesis of this manuscript, was significantly associated with CCL20 (β = 619, p = 0.049) and CXCL6 (β = 3240, p = 0.027), indicating infection increases the observed concentrations of these biomarkers; a finding consistent with the interval-censored parametric proportional hazard model. Despite both CCL20 and CXCL6 exhibiting moderate negative correlations with gestational age and birth weight in the Pearson Correlation Matrix, neither was significantly associated with these features in the MLR analysis (p > 0.05). Conversely, gestational age and birth weight were significant predictors for SAA1 (β = −542, p = 0.023 and β = 23, p = 0.004, respectively), suggesting that the observed significance in the interval-censored model was due to demographic confounders. The remaining biomarkers showed no statistically significant associations with infection status or confounders.
Variance inflation factor (VIF) calculations were performed to assess collinearity among multiple predictors (Table 5). The VIF values indicated potential collinearity between birth weight and gestational age when all features are included, consistent with the strong positive correlation observed between these two features in the Pearson’s correlation matrix. Excluding either of these features from the analysis reduces their respective VIFs, confirming their collinearity. In addition, large VIF values for CCL20 (18.0) and CXCL6 (20.7) suggest significant collinearity, likely due to their strong positive correlation as shown in the Pearson’s correlation matrix. Excluding either CCL20 or CXCL6 substantially reduced their respective VIFs (to 4.01 and 4.59, respectively), demonstrating the impact of collinearity on the regression models. Notably, LBP, which appeared moderately correlated in the Pearson’s Correlation Matrix, was not clearly correlated with other predictors in the regression analysis. For the remaining features, such as CXCL12, SAA1, LBP, resistin, and total protein, VIF values were below 3, indicating that these predictors do not contribute significantly to multi-collinearity.
Relative abundance of target biomarkers to total protein content
To determine if salivary production rates or hydration status had an impact on the observed concentration of biomarkers, the observed salivary protein concentration was divided by the total protein concentration in the saliva to obtain the relative abundance of the target analyte protein to total protein concentration. The process of normalizing protein concentration did not affect the significance, as the log hazard ratio of the relative abundance of CCL20, CXCL6, and SAA1 remained significantly elevated in infected neonatal saliva relative to the uninfected group (Fig. 6, Table 6). LBP became statistically significant (p = 0.021), but insufficient power limited the robustness of this finding. For the remaining analytes, relative abundance did not show statistical difference between the infected and uninfected groups, consistent with the findings before the normalization process. In total, these results emphasize that the observed differences in biomarker concentrations were independent of variations in total protein content, and thus, could be markers of infection.
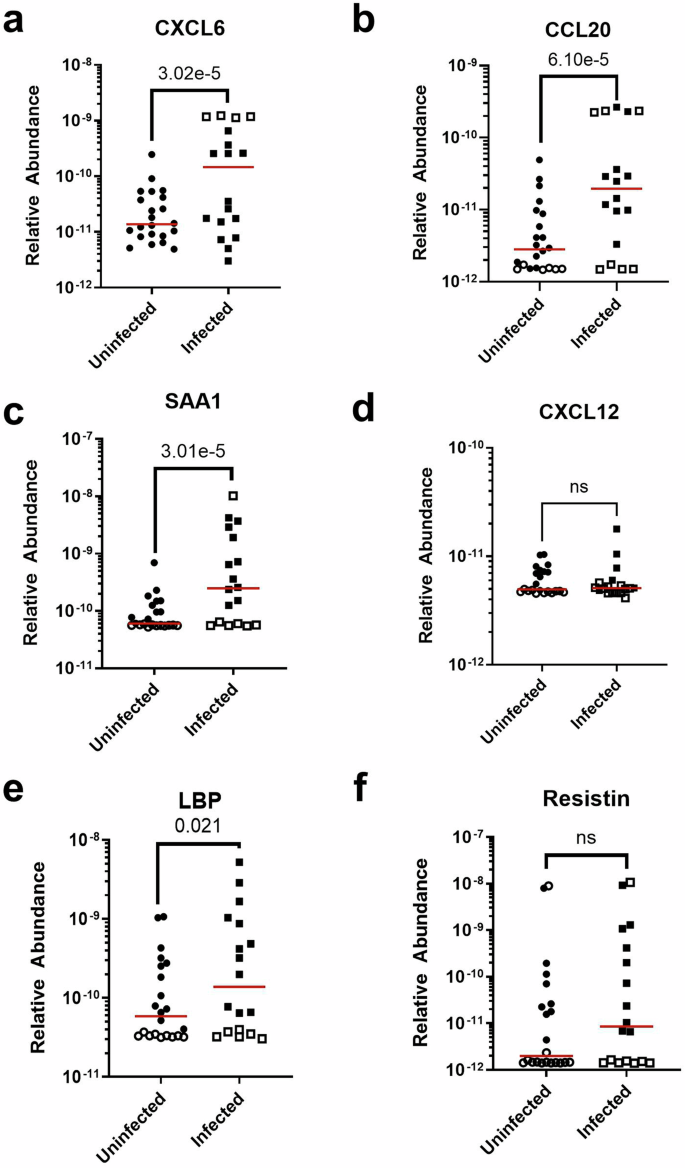
a CXCL6. b CCL20. c SAA1. d CXCL12. e LBP. f Resistin. Each sample measurement is the mean of duplicate technical replicates. Filled points indicate measurements within the assay dynamic range; open points indicate measurements above the upper limit of quantification (ULOQ) or below the limit of detection (LOD). Red lines indicate median concentrations. Significance level is reported as the p-value of the interval-censored parametric proportional hazards model, which accounts for data censoring at the LOD or ULOQ.
Discussion
Our study is the first to demonstrate that chemokines, adipokines, and acute phase reactants are present in neonatal saliva and quantifiable. These results were enabled by the development of novel Simoa assays that accurately measure these inflammatory markers in neonatal saliva with sub-picomolar detection limits; an average improvement of 44-fold over conventional well-plate ELISAs (Table S3). Furthermore, several biomarkers were significantly elevated in infected infants, relative to uninfected infants, indicating that clinical infection status could be determined using profiles of salivary inflammatory proteins. Notably, we found that salivary CCL20 and CXCL6 levels were significantly elevated in infected infants, suggesting their potential as biomarkers for neonatal infectious screening. We hypothesize that biomarkers with large amounts of data clipping at the upper end of the analytical range (e.g., CCL20, CXCL6) would yield more valuable insights with further expansion of the assay’s analytical dynamic range.
We have also shown that some chemokines were only marginally detectable in neonatal saliva. In particular, the low concentrations of CXCL12 were unexpected given its well-established presence in serum and involvement in bacterial sepsis14,41. CXCL12 concentrations were less than 42.0 pg/mL in both infected and uninfected neonates. We anticipate this protein should be detectable in saliva using our assays, because the reported blood concentration is 100-fold greater than the assay LOD. Other proteins in this study only had 10-fold lower concentrations in saliva than in blood, and other inflammatory markers, such as CRP, have shown a strong serum-salivary correlation in concentrations23. Interestingly, previous studies on other inflammatory conditions similarly did not show any significant elevation of salivary CXCL12 levels in cases relative to controls43,44.
These lower-than-expected salivary CXCL12 levels could indicate the involvement of the chemokine in an uncharacterized pathway that prevents it from being detected in saliva compared to serum. This pathway could include a post-secretion modification or hydrolysis45. While it is known that CXCL12 is cleaved by matrix metalloproteases 2 and 946, all saliva samples in this study were immediately incubated with protease inhibitors after collection to prevent the degradation of the biomarkers. Thus, future studies should investigate the lack of correlation between salivary and serum biomarker levels.
Although we observed elevated biomarker concentrations in infected infants, further longitudinal data are needed to assess the utility of these biomarkers for monitoring treatment efficacy over time. Several additional timepoints (e.g., saliva measurements taken post-24 h, post-72 h, and post-seven days after an infant’s rule-out sepsis evaluation) should be incorporated in subsequent studies to improve temporal resolution to assess the dynamics of biomarker concentrations. It is important to note that the trends observed are the hazard ratios of the entire cohort of neonates but it is necessary to be able to predict the status of individual patients. While some of the biomarkers are clearly much higher in the infected compared to uninfected groups and could be used to diagnose individuals, other samples overlap with the range of the uninfected neonates. It is possible that multi-variate analysis, in which multiple markers are analyzed in combination, would enable us to better predict the patient’s infectious status.
There are several limitations to this study, including the limited number of samples analyzed. Additional research is needed to confirm the normative reference ranges of neonatal salivary biomarker concentrations that we have established. Further, all subjects underwent an infectious assessment and antibiotic exposure based upon clinical history and/or presentation. In future studies, healthy, asymptomatic infants should be included in the patient cohort to establish baseline salivary biomarker concentrations. To improve diagnostic accuracy, future studies should explore additional cytokine markers of inflammation, such as interleukins47, to gain a comprehensive understanding of the neonatal immune response, which remains relatively uncharacterized in comparison to the adult population28. Analyzing these markers in combination could delineate both early and late phases of the neonatal immune response and identify patterns that differentiate sepsis from other inflammatory conditions.
The assays developed in this study represent a first step toward advancing salivary diagnostics for neonatal sepsis, but will require comprehensive validation to ensure analytical rigor and reproducibility. Future work should include: (1) a systematic comparison of the analytical performance characteristics of the HD-X platform with existing methods for salivary protein detection, (2) comprehensive investigations of pre-analytical variables specific to neonatal saliva processing, and (3) detailed analysis of matrix effects unique to neonatal saliva compared to adult saliva or other sample matrices such as serum. Combined with larger, well-powered cohorts, these efforts would enable the establishment of clinical diagnostic metrics, including sensitivity, specificity, and predictive values. This technical groundwork will be critical for advancing assay validation, ultimately contributing to the broader goal of developing non-invasive diagnostic tools for neonatal sepsis.
In summary, through the development of sensitive assays using the Simoa platform, we have demonstrated the ability to measure neonatal host inflammatory markers in saliva and presented two salivary biomarkers, CCL20 and CXCL6, that could be indicative of infection in neonates. Advancing salivary-based diagnostics for neonatal conditions is a crucial step towards reducing phlebotomy-associated morbidities and improving care for this vulnerable population.
Methods
Saliva acquisition
With Institutional Review Board approval and parental consent, neonatal saliva samples were collected at the initiation of an infectious work up requiring antibiotic administration and 18–36 h into therapy. All samples were obtained from neonates enrolled in Salivary Profiling in Infants Treated for Suspected Sepsis: The SPITSS Study (NCT05490212) and quantified in accordance with Mass General Brigham Institutional Review Board protocol 2019P003202. Saliva samples were collected with previously described techniques23. Briefly, the oropharynx was gently suctioned with a 1 mL syringe attached to low wall suction. Saliva was immediately stabilized at the bedside with a protease inhibitor and placed at −80 °C pending analysis. All samples were collected in duplicate. If a sample appeared either bloody or contaminated with breast milk or formula, the sample was discarded and an additional sample was obtained. Demographic data including gestational age, sex, and weight were recorded. Clinical outcome data including blood culture results and duration of antibiotic exposure were also recorded and used to determine infectious outcome.
Preparation of antibody-coated beads
ELISA DuoSet kits were obtained from R&D Systems. Capture antibodies were coupled to 2.7 µm carboxylated paramagnetic beads (Quanterix) using 1-ethyl-3-(3-dimethylaminopropyl) carbodiimide (EDC) hydrochloride chemistry (ThermoFisher Scientific). First, lyophilized capture antibody (R&D Systems) was reconstituted in bead conjugation buffer (Quanterix). 4.2 × 10⁸ beads were washed three times using bead wash buffer (Quanterix) and three times in bead conjugation buffer. The beads were incubated with EDC (0.15 mg/mL) for 30 min with rotation at 4 °C. Afterwards, beads were washed once in bead conjugation buffer and capture antibody (0.15 mg/mL) was added. The beads and antibody were incubated for 2 h with rotation at 4 °C. The beads were then washed two times in bead wash buffer and incubated in bead blocking buffer (Quanterix) for 45 min. Afterwards, the beads were washed once in bead wash buffer and twice in bead diluent (Quanterix) and placed in tinted vials for long-term storage at 4 °C. The next day, the coupling efficiency for all beads was calculated. Coupling efficiency was defined as the amount of residual antibody in the bead wash solutions, compared to the amount of starting capture antibody. The amount of antibody in the bead wash solutions was quantified using a NanoDrop OneC Spectrophotometer (ThermoFisher Scientific). The fraction of beads existing as monomers was measured using a Z2 Coulter Particle Count and Size Analyzer (Beckman Coulter). Successful bead conjugations had a high fraction of monomeric beads (≥80%).
Calibration curves
To generate eight-point calibration curves, recombinant proteins for each biomarker (R&D Systems) were serially diluted in a sample-buffer solution. This solution consisted of StartingBlock Blocking Buffer, 0.5 M EDTA solution (1X), and Halt Protease Inhibitor Cocktail (1X) (ThermoFisher Scientific). Initial Simoa reagent concentrations used to generate the calibration curves were 150 pM streptavidin-β-galactosidase (Quanterix) and 0.2 µg/mL biotinylated detector antibody (R&D Systems). Subsequently, each assay was optimized by titrating both the detector antibody concentrations (0.1 and 0.2 µg/mL) and streptavidin-beta-galactosidase (SβG) enzymatic label (25, 100, and 150 pM). All assays were run as two-step assays with default incubation times. In the Simoa two-step assay configuration, a sample is first incubated with capture beads and detector antibody, and then SβG is added in the second step. Homebrew Helper beads, passivated beads which lack any conjugated capture antibody on the surface, were also used in all assays to improve resuspension of beads and ensure a consistent bead fill. A 1:1 ratio of helper to active beads was used for a total of 500,000 beads per assay, as recommended by the manufacturer. All measurements were taken in triplicate using the Quanterix HD-X Analyzer instrument and the mean concentration was calculated by the HD-X software. Average enzyme per bead (AEB) values were also calculated by the HD-X software. Prism 10 (GraphPad Software) was used to fit a 4-parameter logistic regression (4PL) curve with 1/y2 weighting and interpolate concentration values from the AEB measurements. LOD values were calculated as the mean signal of the blank plus three times the standard deviation of the noise. ULOQ was defined as the most concentrated calibrator in each assay.
Dilution linearity
Healthy adult saliva samples (BioIVT) were serially diluted six times (initially 4-fold, and then 2-fold for every subsequent dilution) in the sample-buffer solution described above, and recovered signal was measured (parallelism). Percent linearity was calculated by dividing the measured signal between concentrations while correcting for the dilution factor. An assay demonstrated good linearity if measurements agreed within 80% to 120% of the subsequent expected concentration, e.g. half of the previous concentration for 2-fold serial dilutions. Three samples were measured per assay, with an additional fourth sample spiked with the standard protein to represent a highly concentrated sample. Each sample was measured in duplicate technical replicates. Sample dilution factors were chosen based on the dilution factor where the signal linearized. The percent linearity was calculated using the following equation:
Spike and recovery
Recombinant protein standard was spiked into diluted healthy-adult saliva samples (BioIVT) at low, medium, and high concentrations relative to each assay calibration curve. The dilution factor of the saliva was established through dilution linearity testing. The observed recovered protein signal was measured using three distinct saliva samples. A control was also included in each spike and recovery test to account for user error in the execution of serial dilutions. The control experiment consisted of spiking the same three concentrations into the sample-buffer solution, rather than saliva, and measuring recovered signal to account for the impact of sample matrix on quantification. Each sample was measured in duplicate technical replicates. The assay demonstrated good recovery if the observed concentration was within 80% to 120% of the expected spiked concentration. The percent recovery was calculated using the following equation:
Quantification of neonatal salivary proteins
The patient cohort (n = 20 subjects providing 40 samples) was run in two batches (n = 20), and the same lot of each reagent was used across all samples except for the prepared sample buffer. Samples were thawed at 4 °C for 15 min, before subsequent centrifugation for 30 min at 4 °C at 21,000 RCF. Each batch of samples included three quality controls per assay to determine run-to-run variability. Calibration curves were generated the day prior to the first day of sample processing and all sample concentrations were determined from these curves.
The cohort was matched to the clinical study and designed to ensure an equal number of infected and uninfected samples. Operators of the HD-X were blinded to the cases status of each sample (infected or uninfected) until all measurements were disclosed. All sample measurements were taken in technical duplicates using the Quanterix HD-X Analyzer instrument and the mean concentration was calculated by the HD-X software. Average enzyme per bead (AEB) values were calculated by the HD-X software.
Total Protein in neonatal samples was quantified using a NanoDrop OneC Spectrophotometer (ThermoFisher Scientific).
Statistical analyses
Interpolated concentration values were calculated from each assay calibration curve using a 4PL curve with 1/y2 weighting. We used the icenReg package in RStudio to perform an interval-censored parametric proportional hazard analysis, starting from a Weibull baseline distribution, to assess the difference between biomarker concentrations in infected and uninfected neonates. Interval censoring reflects the limits of detection and upper limits of quantification of our assays, treating them as left- and right-censored, respectively. The analysis provided estimates for the log hazard ratio, standard error, z-value, and two-tailed level of significance for each biomarker. To evaluate the statistical power of the regression results, we performed a z-test. The observed z-value was calculated as the log hazard ratio divided by its standard error. Statistical power was calculated as 1−β, where β represents the Type II error rate, using a two-tailed test at a significance level (α) of 0.05. All measurements outside the assay range were assigned values of the LOD or ULOQ, or zero and positive infinity for censoring, as appropriate. All samples were treated as independent, regardless of time of collection and whether the sample came from the same infant at different timepoints. This approach was chosen to maximize statistical power of the limited sample size. Statistical analyses were conducted in Prism 10 (GraphPad Software); Python 3.10 using nupy 1.26.4, scikit-learn 1.5.2, and statsmodels 0.14.4; or RStudio using icenReg v2.0.16 for interval censored data48.

Responses