Understanding phase transitions of α-quartz under dynamic compression conditions by machine-learning driven atomistic simulations

Introduction
Impacts of meteorites and asteroids on the Earth have contributed significantly to its geologic evolution and the development of life. Since the formation of the proto-Earth through collisions of planetesimals in the early solar system1 and the subsequent formation of the Earth-Moon system through a giant impact2, collisions have altered the surface of the Earth through, for example, the accumulation of water3, sudden mass extinctions4 and the creation of biological habitats5.
The extreme pressure and temperature conditions during such impacts lead to specific alterations in the crystal structures of rock-forming minerals known as shock effects6. A special role can be ascribed to the mineral quartz (i.e. the phase α-quartz, denoted as quartz herein), which is among the most common minerals of the Earth’s continental crust and thus affected by almost every continental impact. Its lamellar amorphization and transitions to high-pressure minerals can provide reliable evidences of past impacts and estimations of peak pressures7. For peak pressures between 10 GPa and 35 GPa, planar deformation features occur in shocked quartz, which represent sets of amorphous lamellae with specific crystallographic orientations. While their frequency increase and dominant orientations vary for increasing shock pressures, quartz transforms completely to a diaplectic glass for peak pressures above 35 GPa. In contrast, the thermodynamically stable high-pressure phases stishovite and coesite occur only in trace quantities8.
Transitions leading to the lamellar amorphization of quartz have previously been explained by different models. Early investigations suggested a direct transition to the amorphous state during shock compression9,10,11,12,13, or the transition to the thermodynamically stable phase stishovite, which would then partially transform into an amorphous solid and partially revert to quartz during decompression14,15,16,17. However, the lamellar amorphization of quartz was also discovered for static compression conditions18,19. While spectroscopic studies suggested direct amorphization of quartz during compression above approximately 16 GPa19,20,21,22,23, X-ray diffraction (XRD) indicated transitions to one or several crystalline high-pressure phases24,25. A direct transition of quartz to stishovite has been excluded due to the large energy barrier associated to this reconstructive transition26. Instead, various metastable phases with different crystal structures have been suggested to explain the high-pressure transitions of quartz to date26,27,28,29,30,31,32,33,34.
Among the numerous high-pressure silica polymorphs, the most stable structures can be described by a hexagonally closest packed (hcp) arrangement of oxygen, in which silicon occupies half of the available octahedral sites31. The numerous possibilities to distribute silicon in these sites give rise to a large number of polymorphs that are characterized by different silicon orderings. The crystal structures and energy volume curves of such high-pressure polymorphs are shown in Fig. 1.

a Comparison of the energy-volume curves of various high-pressure polymorphs of silica. Lines correspond to the predictions by the ACE potential, while open points correspond to DFT (strongly-constrained and appropriately normed exchange-correlation functional61) results. The data of quartz, coesite, stishovite, seifertite and rosiaite-structured silica are taken from ref. 43. Since the silicon atoms of d-NiAs-type silica are randomly distributed in octahedral sites of the hcp arrangement of oxygen, we show the energy-volume curves of 10 different structures of d-NiAs-type silica with 3000 atoms each. Due to the system size, we show only the ACE result of d-NiAs-type silica. b Illustration of the direct transformation of strained quartz to rosiaite-structured silica, which was already suggested by Tsuchiya and Nakagawa40. Small black arrows indicate the displacements of the atoms necessary for the transition. Blue atoms indicate oxygen atoms, orange and red atoms indicate silicon atoms of different layers in the rosiaite-structured phase. c Various silica polymorphs based on an hcp arrangement of oxygen atoms. The different structures result from different distributions of silicon atoms in octahedral sites. In stishovite, the silicon atoms occupy octahedral sites that are arranged linearly along the c axis. In contrast, the silicon-filled octahedral sites in SnO2-, NaTiF4-, P21/c-type silica and seifertite are arranged in different zig-zag patterns. In rosiaite-structured silica, octahedral sites form layers with silicon occupancies of one third and two thirds alternating along the c axis. In d-NiAs-type silica, the silicon atoms are randomly distributed in octahedral sites with a probability of 50%. Color coding of the atoms is consistent with (b).
XRD patterns obtained during shock compression of quartz indicated the formation of the defective niccolite (d-NiAs) type structure35, which was also reported in shock recovery28 and heated diamond anvil cell27,36,37 experiments. This structure is characterized by a random distribution of silicon in octahedral sites of the hcp arrangement of oxygen, and might be formed due to the short timescales of shock compression suppressing silicon diffusion into ordered positions35. Moreover, the XRD data also indicated the presence of a mixture of various silica phases with deviating silicon ordering35.
A major issue with the interpretation of laboratory shock experiments and their comparison to natural impacts is the difference of timescales38. The peak pressure and load duration during natural impacts are on the order of milliseconds for small craters (Meteor Crater) up to seconds for large impacts (Chicxulub). However, laboratory shock experiments occur on the nanosecond to microsecond timescale, depending on the chosen technique. Thus, the material response to shock load is strongly affected by kinetic parameters and, therefore, might not be correctly mimicked in a laboratory setting. A recent approach tried to assess the kinetic effects by compressing quartz rapidly using a membrane-driven diamond anvil cell resulting in a transformation to a high-pressure polymorph with the crystal structure of the mineral rosiaite39. This transition was additionally reported by computational studies revealing a diffusionless mechanism40. The rosiaite-structured phase provides an explanation for the amorphization of quartz due to its instability at ambient conditions causing a collapse to an amorphous solid during decompression39. Moreover, the formation of rosiaite-structured silica during compression of quartz can serve as an intermediate step for subsequent solid-state nucleation of stishovite inside the rosiaite-structured phase41. The very similar microstructures between the quartz samples recovered from these experiments and naturally shocked quartz samples suggested finally, that the rosiaite-structured phase might also be responsible for the lamellar amorphization and solid-state stishovite formation during impacts observed in natural samples.
In the present study, we perform computer simulations to investigate the transitions of quartz observed in the two experiments described above. To understand the experiments conducted in ref. 35, molecular dynamics (MD) shock simulations of quartz are carried out using the Hugoniostat method42. Furthermore, we vary the strain state of quartz systematically and analyze possible strain-dependent phase transitions using a combination of molecular statics and MD simulations to reconcile the results of ref. 39. Lastly, we perform solid-state nudge elastic band (NEB) calculations to analyze the transition paths of quartz. In contrast to earlier studies, our simulations are based on a machine-learning interatomic potential, which was fitted to high-quality density-functional theory (DFT) data. This potential shows accurate transition pressures for the high-pressure silica polymorphs and is trained to accurately describe the high-pressure amorphous phase up to a pressure of 200 GPa43. In addition, we tested the performance of the potential for all phases relevant to this work (see Fig. 1a) and found that, although not all phases were part of the training dataset, the potential gave predictions in good agreement with DFT. Therefore, the machine-learning interatomic potential allows, within the limits of the underlying DFT data, a more accurate description of the high-pressure phase transitions of quartz as compared to previously employed classical potentials. Moreover, we address the complex problem of structure identification through a novel structure identification model based on dynamic graph convolutional neural networks (DG-CNN)44.
Results
Shock simulation of quartz
As a first step, we performed an MD shock simulation with the shock direction oriented along the c axis of quartz and a peak shock pressure of 56 GPa replicating the shock experiments by Tracy et al.35. While the very short timescales of shock processes often induce strong challenges for investigating the material response with existing experimental methods, these timescales are on the same order of magnitude as we can simulate in an MD simulation. A summary of the simulation results is shown in Fig. 2.
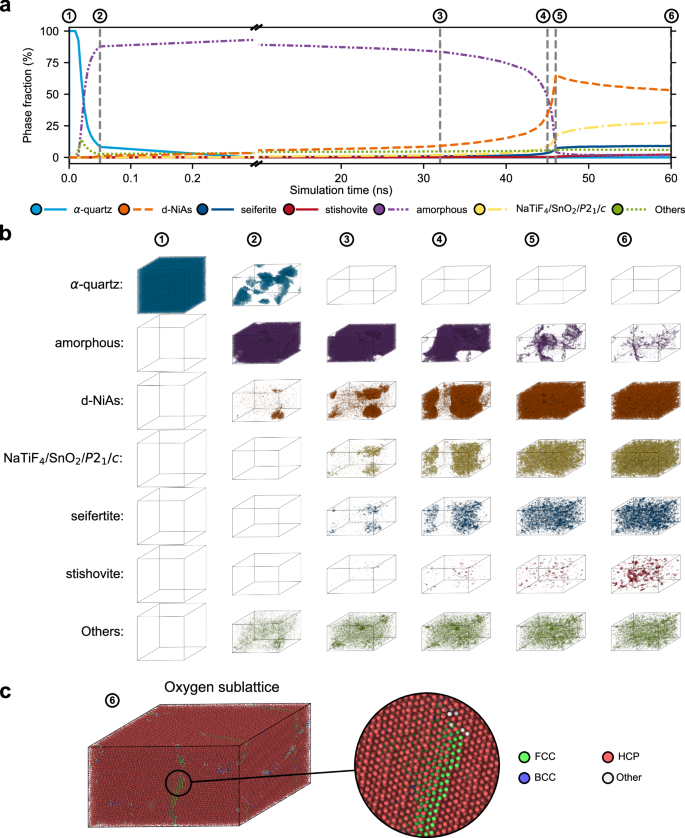
a Results of the DG-CNN structure identification for the shock simulation of quartz with a peak pressure of 56 GPa. The phase fractions were implied from the number of atoms identified as constituents of one of the specified silica phases. All atoms which are classified as NaTiF4/SnO2 or P21/c-type silica are summarized in one category. Atoms identified as constituents of another unspecified crystal structure are summarized as Others. Temperatures obtained from the simulation are shown in Supplementary Fig. 2. b Snapshots of the shock simulation showing only those atoms that are allocated to the same phase by the DG-CNN. Colors are consistent with (a). It can be seen that quartz amorphizes upon shock compression. The amorphous silica then crystallizes in the d-NiAs structure with locally varying ordering of silicon atoms. c Results of the polyhedral template matching analysis (Root mean square deviation: 0.2) for the oxygen sublattice of the snapshot after 60 ns simulation time, showing that nearly all oxygen atoms are in an hcp arrangement as classified by the DG-CNN.
At the beginning of the simulation, nearly all atoms are classified as constituents of quartz. Within the first 50 ps after initiation of the shock compression, the fraction of quartz classified atoms decreases rapidly until only few domains of quartz remain (See also Fig. 2b). After 300 ps, quartz disappears completely. Simultaneously with the decline of quartz, the phase fraction of the amorphous phase increases strongly. At 300 ps the amorphous phase reaches a phase fraction of roughly 90%. Besides the amorphous phase, d-NiAs-type silica appears with the decline of quartz, consisting of an hcp arrangement of oxygen atoms with the silicon atoms distributed randomly in the octahedral sites. Over the next 30 ns, the phase fraction of the d-NiAs type silica phase increases slowly, while the fraction of the amorphous phase decreases slowly, which can be seen in snapshots of the simulation shown in Fig. 2b between 50 ps and 40 ns. Between 40 and 50 ns, the growth of the d-NiAs-phase increases strongly leading to a nearly completely crystallized sample at 60 ns (see last snapshot Fig. 2b).
Polyhedral template matching results shown in Fig. 2c demonstrate that the hcp arrangement of oxygen atoms is present in all of the specified high-pressure phases and possesses only few defects. Due to silicon ordering in octahedral sites of the hcp arrangement of oxygen different crystal structures appear (see Fig. 1b). After a peak in the amount of d-NiAs-type silica between 40 ns and 50 ns, the decrease in the phase fraction of the d-NiAs-type phase goes along with an increase in the fraction of other crystalline phases, while the fraction of the amorphous phase remains negligible. The crystalline phases appear as small domains and are classified mainly as NaTiF4-type silica, SnO2-type silica, P21/c-symmetric silica and seifertite. Despite numerous domains of these high-pressure silica phases, the dominant phase remains d-NiAs-type silica with a phase fraction of more than 50% at the end of the shock simulation at 60 ns. Stishovite, which is the stable phase at these conditions, grows much slower than e.g. the phase fraction of seifertite (see also Fig. 2b) and thus remains mostly absent. Also rosiaite-structured silica, which has been observed in static compression experiments39,41, does not appear in significant amounts.
Experimental XRD data of shock compressed quartz indicated the formation of d-NiAs-type silica with assumed contributions of locally ordered silicon35. This agrees well with the results of our shock simulation and structure identification. Moreover, the time of the XRD measurement at 100 ns after initiation of the shock is similar to the timescale of our simulation. To allow for a better comparison with the experiment, we calculated the XRD pattern of our simulation cell after 60 ns simulation time and compared it to the experimental diffraction pattern in Fig. 3a. The comparison indicates an excellent agreement. This underpins the high quality of the employed machine-learning interatomic potential, providing more accurate insights compared to earlier classical interatomic potentials. In particular, it overcomes the limitation of the BKS potential45 of predicting the formation of stishovite in shocked quartz46. We note that the smoothness of the calculated XRD pattern is attained by the large system size of our simulation cell comprising more than 500,000 atoms, and the averaging over different patterns from a range of wavelengths according to the X-ray spectrum employed in the experiment35, but is not caused by artificial smoothing.
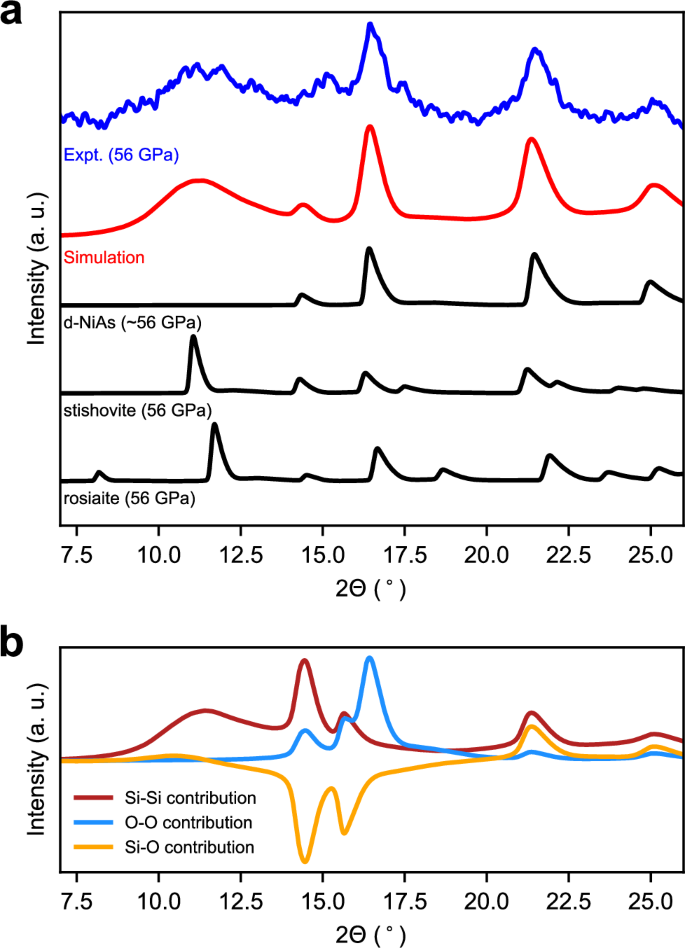
a Calculated XRD pattern of a shock simulation of quartz at 60 ns after initiation of the shock compression compared to the experimental XRD pattern measured in situ by Tracy et al.35. The XRD patterns were collected at the peak shock pressure of 56 GPa with the direction of the shock compression parallel to the c axis of quartz. For comparison, the theoretic patterns for stishovite, rosiaite-structured silica and d-NiAs-type silica are shown at the same pressure. For d-NiAs-type silica, we used the average lattice parameters of the structures from Fig. 1a at 56 GPa. For all calculations, we used the same X-ray spectrum as used in the experiment35. b Individual contributions of the Si-Si distances, the O-O distances and the Si-O distances to the total XRD pattern of the structure under shock after 60 ns.
The experimental and simulated XRD patterns (Fig. 3) also agree well with the calculated XRD pattern of d-NiAs-type silica, whereas characteristic peaks of stishovite, rosiaite-structured silica, and several other phases are missing at low diffraction angles (see Supplementary Fig. 1). Instead, there is a diffuse peak at diffraction angles ranging between 10° and 13°. Due to the similarity with the first sharp diffraction peak of the diffuse scattering of amorphous silica, one assumption of the origin of this peak has been the partial amorphization of the quartz sample35. Another interpretation has been the short-range ordering of silicon within the d-NiAs structure35. On the basis of our shock simulation, we can clearly exclude the presence of amorphous silica, since the structure resulting from the simulation is crystallized to nearly 100%. Instead, we can confirm that the diffuse peak can be attributed to local partial ordering of silicon atoms in the octahedral sites of the hcp arrangement of oxygen, which is manifested by the formation of the small domains of different silica phases. Due to the small sizes of the domains, sharp peaks indicative of long range order of silicon in these phases are absent, whereas the short and intermediate range order of silicon lead to broadened peaks. This means that the diffuse peak at low diffraction angles originates from a superposition of broadened peaks of the phases with ordered silicon identified by the DG-CNN structure identification. The ideal d-NiAs-structured phase, on the contrary, does not contribute to the diffuse peak in the measured and simulated XRD patterns since the silicon atoms are distributed randomly. The origin of the diffuse peak from the silicon-silicon distances can finally be supported by the individual atomic contributions shown in Fig. 3b.
Although stishovite is the thermodynamically stable phase at the simulated conditions, stishovite remains mostly absent in our simulations. This is in line with previous shock experiments of quartz35,47,48,49,50 and has been explained by the short timescales of shock experiments, which are insufficient for the formation of stishovite6. In contrast, in situ shock experiments and simulations on vitreous silica have shown, that stishovite can crystallize within nanoseconds under shock46,51,52. Furthermore, recent MD shock simulations of amorphous silica have found, that the crystallization of stishovite is preceded by formation of d-NiAs-structured silica as an intermediate phase44. This shows that, when silica crystallizes from the amorphous phase, the oxygen sublattice is rearranged to an hcp arrangement at first. Only secondly silicon rearranges to the structure of stishovite. During shock compression of quartz, only the reordering of oxygen to an hcp arrangement is seen within the simulated time range. One reason for this can be the significantly lower temperatures during shock compression of quartz compared to the shock compression of amorphous silica (see Supplementary Fig. 2). The higher temperatures during shock compression of amorphous silica allow the much faster arrangement of oxygen and silicon atoms within shorter timescales of only around several nanoseconds44. In contrast, in the case of quartz, we see sufficient time to allow a rearrangement of the oxygen atoms, whereas there is insufficient time for arrangement of the silicon atoms hindering to the formation of stishovite. Instead, we can only see the appearance of NaTiF4-structured silica, SnO2-structured silica, P21/c-symmetric silica and seifertite within small domains, which indicates some ordering of silicon. However, for the occurrence of stishovite, significantly longer times at the shock state would probably be required.
Formation of rosiaite-structured silica
The preceding discussion highlights how kinetics significantly influence phase transformations and shock effects in silica. The duration of the shock load and the shock temperature are critical factors affecting the observed outcomes. Current experimental techniques and computer simulations are unable to replicate the timescales of natural impacts, as noted by DeCarli et al.38. Consequently, comparing our results of the shock simulation with observations from natural impact sites remains challenging. However, a novel approach to investigate the effects of a slower compression rate and a prolonged load duration is rapid compression in the diamond anvil cell under non-hydrostatic conditions25,39,41. In these experiments, quartz predominantly transforms into rosiaite-structured silica, rather than the d-NiAs type observed in shock experiments (Tracy et al.) and in our simulations.
While computer simulations on the timescale of seconds remain out of reach, supporting these experiments is feasible by analyzing the stress and strain conditions necessary for the transformation of quartz into other phases. Recent computer simulations have proposed a direct, diffusionless transition mechanism of quartz to rosiaite-structured silica40. Both the experimental and simulation data indicate that, while the principal compression direction is parallel to the c axis of quartz, additional compression perpendicular to the c axis is required for the transition40. To understand the strain conditions leading to the transition comprehensively, we systematically strained the unit cell of quartz parallel and perpendicular to the c direction using various ratios and magnitudes. At each strain state, the structure was relaxed, subjected to thermal treatment and relaxed again (see Fig. 4a). The thermal treatment allows the structure to overcome small energetic barriers and avoid fixation in an energetically unfavorable arrangement. Finally, the resulting structure was identified using the DG-CNN classifier.
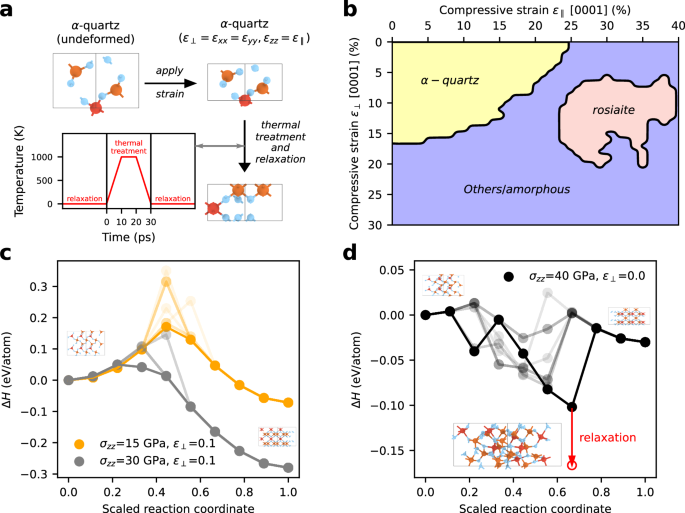
a Workflow depicting the treatment of the unit cell of quartz for investigating the transitions at various deformations. Quartz was first strained between 0 to 30% in the a1 and a2 directions and 0 to 40% along the c direction. Thereafter, the structures underwent thermal treatment for 30 ps with temperatures up to 1000 K and several energetic minimizations. This was done for supercells with sizes ranging between 1 × 1 × 1 and 8 × 8 × 8 unit cells. b Phase stability diagram showing the resulting phases after compression of quartz, minimization, thermal treatment and identification of the final structure by the DG-CNN. Due to the dominance of rosiaite-structured silica in the structure identification results, we focus on this structure, although also other phases were detected in small amounts (see Supplementary Figs. 3–5). c Energies of the transition paths between quartz and rosiaite-structured silica calculated by the solid-state nudge elastic band method. We set the a1 and a2 lattice parameters of quartz and rosiaite-structured silica to the same values, i.e. 90% of the a1 and a2 lengths of undeformed quartz. The c lattice parameter was determined by optimization of the atomic positions under an applied pressure of 15 GPa and 30 GPa while keeping the a1 and a2 lattice parameters fixed. This resulted in a compressive strain of 4.1% (15 GPa) and 8.2% (30 GPa) for quartz and 27.5% (15 GPa) and 29.0% (30 GPa) for rosiaite-structured silica in c direction, in both cases referenced to the undeformed quartz cell. We used different possible displacive paths by employing several rosiaite structures from (b). The minimum energy path is shown in bold, while the other paths are shown blurred. d Energies of the transition paths with the a1 and a2 lattice parameters of quartz and rosiaite-structured silica scaled to the relaxed quartz reference. In c direction, a pressure of 40 GPa is applied, which results in a compressive strain of 23.7% for quartz and 36.6% for rosiaite-structured silica. Since structures with a lower energy appeared on the transition paths, we relaxed the simulation cell along the c direction and the atomic positions of one of the low energy structures and show the corresponding structure at the bottom of (d).
Depending on the ratio of strains parallel and perpendicular to the c axis, the structure of quartz is retained for strains of up to 25% and 16% parallel and perpendicular to the c axis, respectively (Fig. 4b). A transition to rosiaite-structured silica is observed for strains of 25 to 40% along the c axis and 5 to 20% perpendicular to the c axis. At strain conditions outside of this stability field, on the contrary, amorphous silica is formed predominantly (See also Supplementary Fig. 5). Depending on the strain conditions, the DG-CNN identifier indicates local similarities of the resulting structures with other metastable high-pressure polymorphs, i.e. d-NiAs, SnO2 and CaCl2 type silica, and silica crystallizing in the space groups C2 and P32. Details on the identified high-pressure polymorphs can be found in Supplementary Fig. 3–5.
To analyze the probability for the occurrence of a transition from quartz to rosiaite-structured silica, we performed solid-state nudge elastic band (SS-NEB) calculations. These calculations enable to analyze the transition pathway between two different structures with different lattice parameters. We fixed strains perpendicular to the c axis and scaled quartz and rosiaite-structured silica to the same lattice parameters in these directions. Parallel to the c direction, we applied uniaxial stress. Under these external constraints, we investigated possible transition paths considering that atoms in quartz may move to different positions in rosiaite-structured silica. Each pathway corresponds to a blurred line in Fig. 4c, d, while the bold line corresponds to the minimum energy path. Using strains of 10% perpendicular to the c axis, we observe that the rosiaite-structured silica is more stable then quartz when the compression exceeds approximately 15 GPa (Fig. 4c). At these conditions, the phases are separated by a relatively low energy barrier of 150 meV/atom (bold line Fig. 4c), which further decreases at increasing pressures. The results indicate that the transition from quartz to rosiaite-structured silica can occur very easily at room temperature when pressures of approximately 15 GPa are exceeded, which is in good agreement with experiments39.
On the contrary, if quartz is compressed along the c axis without compressive strains in the perpendicular direction, rosiaite-structured silica becomes stable at pressures of approximately 40 GPa (Fig. 4d). Additionally, the calculations yield intermediate minima on all transition paths. The structure attained at one of these minima indicates a high degree of disorder. In agreement with Fig. 4b, this means that quartz amorphizes if compressed along the c axis without additional compression in the perpendicular direction, whereas rosiaite-structured silica remains absent. Subsequent crystallization of the amorphous solid to rosiaite-structured silica is unlikely due to the high energy of rosiaite-structured silica compared to the energy of other high-pressure polymorphs (Fig. 1a).
The strain conditions promoting amorphization of quartz might also be responsible for the amorphization seen in the shock simulations, where lateral strains were absent during shock compression along the c axis. During natural impacts, on the contrary, strain conditions are strongly heterogeneous due to the random crystallographic orientations of quartz grains in rocks and locally varying interactions to neighboring crystals.
Discussion
In this work, we employed a novel machine-learning interatomic potential to investigate the transitions of quartz under shock compression and different deformations. In the first part, we reveal the transitions and dynamics of quartz during shock compression. Our simulation with the shock direction oriented parallel to the c direction of quartz and a peak shock pressure of 56 GPa shows that quartz nearly completely amorphizes upon shock compression. The amorphous silica then crystallizes in the d-NiAs structure by reordering of the oxygen atoms into an hcp arrangement. Instead of a completely random distribution of silicon in the octahedral sites of the hcp arrangement of oxygen expected for d-NiAs-structured silica, silicon orders partially in the octahedral sites. This is reflected in the appearance of small domains showing the crystal structures of seifertite, NaTiF4-type silica, SnO2-type silica, and P21/c-symmetric silica.
In the second part of this work, we analyzed the conditions for the transformation of quartz into rosiaite-structured silica. We found that the diffusionless transformation not only requires compression along the c direction of quartz, but additional compressive strain perpendicular to the c direction. This perpendicular compressive strain occurs in static compression experiments, where rosiaite-structured silica has been observed39. In contrast, when additional lateral compression is absent, we show that amorphization of quartz is favored.
Our work thus shows the high relevance of timescales and strain conditions for the transformation of quartz into high-pressure phases. The variability of these conditions might explain the wide range of metastable silica polymorphs and the diverse shock effects documented in experiments and in natural samples from impact craters. We demonstrate that complementing experimental results with machine-learning driven atomistic simulations offers a valuable strategy for gaining a more detailed understanding of the structural responses on the atomic scale.
Methods
For all calculations except the DFT calculations, we used the machine-learning interatomic potential from ref. 43. For data visualization and processing, we used ovito53, the ase54 package and pymatgen55. MD and molecular statics simulations were performed using LAMMPS56.
Energy volume curves
All energy volume curves are calculated under hydrostatic conditions allowing changes of the box shape and atomic positions. DFT references of the energy-volume curves of SnO2-, NaTiF4– and P21/c-type silica were determined with VASP57,58 using the project augmented-wave method59,60 with the strongly-constrained and appropriately normed exchange-correlation functional61, an energy-cutoff of 900 eV and a k-spacing of 0.23 Å−1. These are the same settings used for the machine-learning potential training data43,62. Additionally, we calculated the energy-volume curves with the machine-learning potential for the mentioned structures and the d-NiAs structure. Since d-NiAs-structured silica is not uniquely defined, we took one structural sample from ref. 44 and created 9 additional samples. All samples had a size of 3000 atoms. They were created by distributing silicon randomly over the octahedral sites using the constraint that no oxygen atom had less than one or more than five bonds.
Shock simulations
Shock simulations were performed using LAMMPS56 and the Hugoniostat method (fix nphug)42. We used a temperature damping value of 20 ps and a pressure damping value of 20 ps as input for the fix nphug. Initially, we equilibrated the system using an NPT ensemble63 for 10 ps at 300 K and 0 GPa with a temperature damping constant of 0.1 ps and a pressure damping constant of 1 ps. Afterwards, we performed the shock simulation for a time of 60 ns. The simulation cell contained 518,400 atoms.
Dynamic graph convolutional neural network structure identification
We used the machine-learning base structure identification algorithm for silica from ref. 44 based on 64 next neighbors as input. This model is available from github64 and is used within its ovito interface53. This machine-learning model is using a DG-CNN as classifier and is trained to differentiate between 25 different silica phases, which include also the amorphous phase, the melt, and many hypothetical high-pressure structures. A list of all structures, which can be identified by this method, is given for our deformation analysis of quartz (see Supplementary Fig. 3–5). The classifier gives a score for each structure type it was trained to. Correspondingly, the structure assigned to an atom is identified as the one with the highest score. However, the classifier cannot identify structures it was not trained to. Instead, it will wrongly classify unknown structures with one of the 25 other known structures.
XRD calculations
XRD intensities were calculated using the Debye formula65,
where q is the scattering vector, fa(q) is the atomic scattering factor of atom i, and rij is the distance between atom i and j. The scattering vector q is given by,
with the diffraction angle Θ and the wavelength λ. For our calculations we used the radial distribution function calculated from ovito neglecting periodic boundary conditions. To evaluate the XRD intensities of the small-scale pristine crystals, we used the functionalities implemented in pymatgen. XRD patterns were calculated for photon energies between 18 keV and 24 keV in steps of 50 eV. The weighted average of these patterns, according to the photon energy distribution used in ref. 35, was then used to obtain the final XRD patterns.
Deformation calculations
We used unit cells of quartz at ambient conditions with supercell sizes ranging between 1 × 1 × 1 and 8 × 8 × 8. These cells were deformed using the following strain state,
After deformation, we applied the following protocol to allow a transformation of the structure:
-
Relaxation of the atoms
-
Heating from 10 K to 1000 K within 10 ps
-
Annealing at 1000 K for 10 ps
-
Cooling from 1000 K to 10 K within 10 ps
-
Relaxation of the atoms
All steps were performed under a constant box size to keep the strains fixed. For the relaxations, we used initially a conjugate gradient and afterwards a FIRE optimizer with a convergence criterion of 10−5 eV/Å. Structure identification was performed using spglib66 and the DG-CNN structure identification (see above). Results for the spglib analysis are shown in Supplementary Fig. 3a. The results of the DG-CNN for rosiaite-structured silica are shown in Supplementary Fig. 3b (for all supercell sizes separately), and the results of all other structures averaged over all supercell sizes are shown in Supplementary Figs. 4, 5.
Solid-state nudge-elastic-band calculations
The solid state nudge-edge elastic band method was used as implemented in the FD-NEB code67,68, which is based on the tsase code69,70,71. We used Cauchy stresses for the calculation and set the weight parameter to a value of 100 to decrease the box fluctuation during the NEB. Moreover, we used the quickmin optimizer and a convergence criterion of 10−2 eV/Å for optimization. As input cell, we used 2 × 2 × 2 supercells of quartz strained to different states using the following strain tensor,
The lattice parameters in c direction are subsequently determined by relaxation of positions of the atoms, while simultaneously allowing the box length in c direction to change. During this minimization we applied the external stress σzz. The final states of the rosiaite-structured phase are determined the same way. Since oxygen in quartz can move to different positions according to the structure of rosiaite-structured silica, we used several rosiaite-cells, which were generated in our deformation calculations. We used all 2 × 2 × 2 supercells, which were generated from a strain ϵzz = 0.27 and have a perfect (Poverline{3}1m) symmetry. These supercells were scaled to the same lattice parameters in the a1 and a2 directions as the quartz input cell. This enables to vary only the c parameter during the NEB, while keeping all other lattice parameters fixed.
The non-hydrostatic enthalpy in our calculations is given by ref. 71,
where ΔE is the energy difference between the initial state and the image, Ω is the supercell volume, σext is the externally applied pressure, and ϵref is the strain relative to the initial image. Note that ϵref is not equal to Eq. (4). Since deformation is only allowed in c direction with respect to the reference image, ϵref contains only the ϵzz component while all other components are zero.

Responses