Uneven diffusion: a multi-scale analysis of rural settlement evolution and its driving forces in China from 2000–2020
Introduction
Rural settlements are crucial components of rural land use (Zhao et al. 2022) and serve as spatial carriers for rural population distribution (Li and Jiang, 2018). They mirror the intricate interplay between rural production dynamics and social networks (Dong et al. 2022). Since China’s reform and opening-up policies, rapid socio-economic development and rural-urban migration have led to the underutilization or abandonment of rural residential areas, resulting in significant land resource waste (Qu et al. 2023). This issue primarily stems from the migration of production factors, such as the rural population (Shi and Wang, 2021) and land (Li and Song, 2020), to urban non-agricultural industries. Issues like “multiple dwellings” and “hollow villages” have further intensified the abandonment (Wu et al. 2022) and unchecked expansion (Qu et al. 2021) of residential bases. For instance, in 2020, China had 286 million rural migrant workers, most employed in cities, leaving their countryside homes vacant. As a result, new residents often build houses around existing villages, expanding the residential base (Chen et al. 2021). Additionally, industrialization and urbanization have increased rural household incomes, driving greater demand for living space and economic investments (Yu et al. 2018). This uncontrolled expansion of rural settlements has led to several issues, including the reduction of arable land (Ju et al. 2023), intensified land supply–demand conflicts (Chen et al. 2021), food security risks (Nandi and Mistri, 2019), and severe rural depopulation (Sun et al. 2011), ultimately hindering coordinated and sustainable regional development. Consequently, the expansion of rural settlements has garnered significant scholarly attention.
Research on the evolution of rural settlements began in the 20th century (Li et al. 2020), focusing on spatial patterns (Yang et al. 2022), the use of internal space in rural dwellings (Chuai et al. 2016), evolutionary dynamics (Zhou et al. 2013), and the human–land relationship shaped by this process (Yanbo et al. 2021). In recent years, scholars both domestically and internationally have introduced concepts such as life quality theory (Tang et al. 2018), spatial-territorial reorganization models (Mao et al. 2017), the Kano-IS model (Xu et al. 2022), and GIS spatial analysis (Li and Jiang, 2018). These studies have explored the spatial morphology and evolutionary trends of rural settlements across different historical periods and scales, including future projections (Li and Song, 2020), leading to significant advancements. However, most studies have focused on static factors like patch density, scale, and area size of rural settlements, primarily analyzing external morphology in the evolution process (Zhu et al. 2022).
While existing studies have made significant contributions to understanding rural settlement expansion, they primarily focus on overall changes in morphological patterns, often overlooking the evolution of landscape patterns. The landscape expansion index (LEI) is a key metric used to describe dynamic changes in landscape patterns. Unlike traditional landscape indices, LEI tracks the evolution of these patterns across multiple time periods (Liu et al. 2010). It measures the location of new growth patches in developed areas, which can be classified into three main expansion patterns: outlying expansion, edge-expansion, and infill expansion. Other expansion patterns are generally considered variations or combinations of these basic types. Outlying expansion refers to the outward growth of new rural settlements detached from the original settlement, edge-expansion involves the construction of new housing at the periphery of the original settlement, and infill expansion refers to new housing development within gaps inside the original settlement.
In terms of research scales, most studies on rural settlement expansion have focused on macro-level analyses, such as national, provincial, or municipal (county) scales. Fewer studies have examined micro-scale phenomena, such as the patch level. Both patch-level (Tian et al. 2016) and administrative unit-level (Chen et al. 2022) approaches have been employed in these studies. The patch-level analysis captures the spatial and temporal characteristics of specific geographic phenomena, while the administrative unit level reflects variations in socioeconomic development. However, limited research has explored the relationship between these two levels.
This study has two objectives: (1) to quantify the spatial patterns of rural settlement expansion and capture dynamic changes, and (2) to integrate spatial analysis at both the patch level and administrative scales for a more comprehensive understanding of settlement growth. The LEI was used to measure the expansion of newly built rural settlements across 2851 counties from 2000 to 2020, analyzing their diffusion characteristics to provide insights for optimizing spatial layouts. The study is structured as follows: Section “Literature review” reviews the literature and identifies research gaps. Section “Theoretical framework and technical route” presents the theoretical framework and technical route. Section “Methods” outlines the methodology. Section “Results and analysis” examines changes in the scale, spatial characteristics, the evolution of rural settlements and the influencing factors. Section “Discussion” focuses on the comparison with extant studies, along with the policy implications and the limitations inherent in this study. Section “Conclusions” presents the main findings.
Literature review
Measuring rural settlements diffusion
Rural settlements, as an important spatial carrier for human settlement and life in rural areas, have drawn extensive attention (Rao et al. 2023). In the early stage, many studies quantified the expansion process and characteristics of rural settlements by calculating static indicators such as the changes in patch area and the rate of spatial expansion (Nepal, 2007), laying a foundation for subsequent research. In recent years, in addition to conventional indicators related to area and scale, some scholars have regarded rural settlements as landscape patches and dynamically analyzed the changes in their shape, connectivity and fragmentation degree over time. They also explored the morphological evolution of rural settlements within different buffer distances around elements such as traffic arteries (Li et al. 2024), urban centers (Xie et al. 2022) and rivers and lakes (Feng et al. 2007), presenting the internal structural characteristics during the expansion process and their interactive relationship with the surrounding environment from multiple dimensions. The research perspectives cover not only aspects such as the coordinated development of production, living and ecological spaces (Zou et al. 2024), the implementation of the rural revitalization strategy (Gong et al. 2022), the promotion of urban-rural integration (Ma et al. 2024) and ethnic inter-embedding (Chen et al. 2024), but also involve using multiple models to predict the future development trajectory of rural settlements (Zhang et al. 2024), thus providing a scientific basis for rural planning.
Since different expansion patterns have different impacts on the ecology, economic development and living space (He et al. 2017), the definition of the expansion patterns of rural settlements has always attracted much attention. So far, the academic community has not reached a unanimous definition on the expansion patterns of rural settlements. However, the mainstream view holds that their expansion forms can generally be classified into three categories: outlying expansion, edge expansion and infilling expansion. The rest of the complex and diverse expansion situations can basically be regarded as the fusion variants of these three basic types. In reality, the expansion of rural settlements in China presents a unique scene. On the one hand, due to factors such as the attachment to old houses and considerations of living costs, the phenomena of “houses left empty when people move away” and “building new houses without demolishing old ones” are common in villages (Feng et al. 2024). On the other hand, the layout of newly added rural settlements often takes the occupation of cultivated land around villages (Cao et al. 2022). These newly added residential areas generally have the characteristics of being large in number and small in individual scale, with a significant trend of fragmentation and dispersion, which makes the infill pattern rarely appear (Tian et al. 2014). Instead, the diffusive expansion prevails and becomes the most common growth path. Specifically, taking the existing residential areas as the core, the living space is gradually expanded to the surrounding areas, and the whole village presents a situation of “expanding outward while being empty inside”. This pattern has a profound impact on rural land use and ecological networks. For example, Song and Li (2020) analyzed the spatial changes of rural settlements in Tongzhou over the past 50 years. Their findings revealed that expansion generally originated from existing settlements, though the degree of diffusion varied. Similarly, Chen et al. (2021) highlighted the differences in rural settlement expansion types, integrating ecological factors using a direct/indirect measurement model (infilling expansion < edge-expansion < outlying expansion). It is evident that new rural settlements are increasingly established on other land types. They are distributed in a decentralized manner and detached from the original housing sites, rather than merely filling gaps within or expanding outward from existing boundaries.
Existing studies have greatly advanced our understanding of rural settlement expansion, but they often neglect the dynamic processes of landscape change. To enhance rural settlement planning and develop region-specific policies, it is essential to model various expansion patterns accurately. This study identifies the expansion patterns of rural settlements across various regions nationwide using the LEI and reveals their development trajectories and underlying causes. The findings aim to provide a scientific basis for regulating the disorderly spread of rural settlements.
Characterization of rural settlements evolution
The evolutionary patterns of rural settlements are often heterogeneous due to variations in natural environments, socio-economic conditions, and development scenarios across different regions. Firstly, the distribution of rural settlements in China is influenced by economic development, manifested as the overall density gradually decreasing in a stepped manner from the eastern region to the western region (Feng et al. 2024). It is easier to form continuous zones of rural settlements near cities, and there is an obvious tendency to be close to water and roads.
Secondly, the evolution of rural settlements varies in different topographies and landforms. Agriculture is the primary source of income for farmers, leading them to build homes on level terrain conducive to nearby agricultural activities (Long et al. 2009). This phenomenon is particularly prevalent in the North China Plain (Yanbo et al. 2021), the Northeast China Plain (Wang et al. 2022), and the Yangtze River Delta (Zhu et al. 2020). In mountainous areas, the complex, undulating terrain restricts rural settlement utilization, leading to a slower pace of change (Tan et al. 2021). On plateaus, rural communities exhibit distinct spatial clustering and gradient shifts influenced by the natural environment and national culture (Dong and Xu, 2020). In basins, rural settlements are distributed in a “one belt, many cores” pattern (Zhang et al. 2022). Furthermore, attracted by favorable cultivation conditions, rural settlements in other topographic landscapes tend to expand toward lower elevation and slope areas (Chen et al. 2022).
Lastly, the evolution of rural settlements varies across different administrative levels. While many scholars have examined the trends in rural settlements at the county and municipal levels (Song and Li, 2020), their findings indicate that due to subtle intra-regional differences, rural settlements tend to exhibit similar evolutionary patterns on smaller scales. For instance, there has been an overall decline in the size of rural settlements in Changchun (Li et al. 2016). Some researchers have also focused on the provincial level, where significant regional differentiation becomes apparent on a larger scale (Coluzzi et al. 2022). For example, Tan et al. (2021) analyzed the distribution characteristics of rural settlements in Hubei Province, revealing a wavy distribution pattern from southeast to northwest.
In summary, the distribution pattern of rural settlements is spatially heterogeneous. Promoting sustainable rural development necessitates tailored policies that consider varying locational conditions, natural resources, and levels of economic and social development (Wang et al. 2020). The advancement of sustainable development in rural areas should be guided by differentiated regional development controls. However, given China’s vast size and the complex, diverse nature of its regions, significant economic disparities between the East and West and uneven development between the North and South have persisted for a long time. Therefore, studying the evolutionary patterns of rural settlements on a large scale is crucial for promoting the sustainable use of rural land resources.
Research gaps, research questions and potential contribution
Current research on rural settlement expansion faces two major limitations. Most studies focus on macro-level analysis (national, provincial, and county scales), with limited attention to micro-scale phenomena at the patch level. While some researchers have employed either patch-level analysis to examine spatial-temporal characteristics or administrative-unit analysis to study socioeconomic variations, few have integrated these approaches to explore their interrelationships. Additionally, existing research tends to emphasize static morphological patterns rather than the dynamic processes of landscape evolution. Based on these research gaps, this study addresses two key research questions: (1) How do rural settlement expansion patterns vary across different spatial scales, and what are the relationships between patch-level and administrative-unit-level characteristics? (2) How have the dynamic processes of rural settlement expansion evolved during 2000–2020, particularly in terms of landscape pattern indices (edge-expansion, outlying expansion, and infilling)?
This study makes three main contributions to the field: (1) it develops an integrated analytical framework that combines patch-level and administrative-unit analyses, enabling a more comprehensive understanding of rural settlement dynamics; (2) it quantifies the temporal-spatial evolution patterns of rural settlements using landscape pattern indices, providing new insights into the transformation processes; and (3) it reveals the regional variations and driving mechanisms of rural settlement expansion across China, which can inform differentiated rural planning strategies and policy-making.
Theoretical framework and technical route
Rural settlements, as the outcome of the protracted interaction between human activities and the land system, manifest the profound integration of the location theory, spatial diffusion theory, and man-land relationship theory throughout their evolutionary trajectory. During distinct phases of rural settlements’ development, the preponderant roles and focal points of these three cardinal theories also undergo dynamic transformations (Fig. 1).
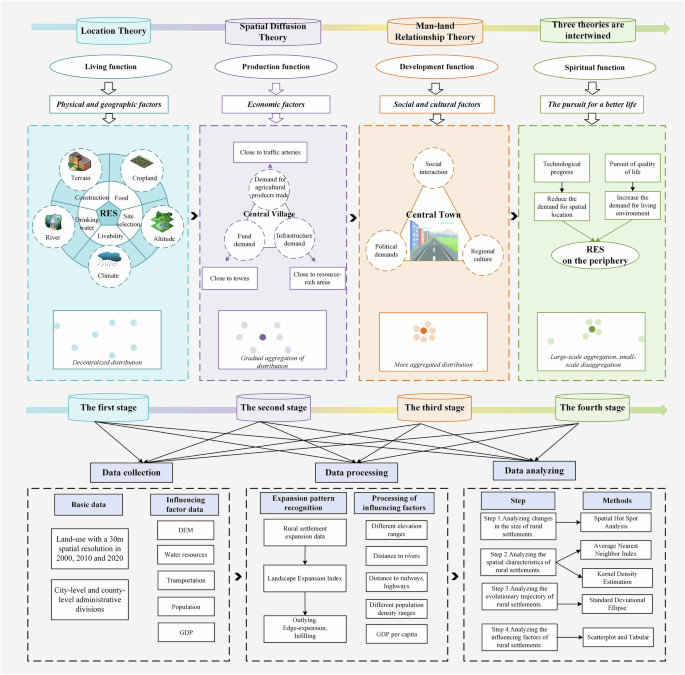
This figure illustrates the predominance of different theories at various stages of rural settlement development.
In the nascent stage of rural settlements, the location theory assumed a pivotal position. Given the exigencies of survival, the site selection of rural settlements was compelled to fulfill the fundamental prerequisites for procuring food, supplying water, and conducting agricultural production. Consequently, in the incipient period, rural settlements were preponderantly distributed in regions characterized by level terrain, proximity to cropland and water sources, and favorable climatic conditions. This site selection paradigm predicated on natural conditions safeguarded the stable progression of rural settlements at the outset. From the vantage point of spatial diffusion, due to the circumscribed level of productivity at that time and the modest demand for residential agglomeration, rural settlements exhibited a dispersed spatial configuration.
With the augmentation of social productivity, economic factors progressively came to the fore, and the spatial diffusion theory became especially conspicuous during this juncture. To elongate the agricultural industrial chain, rural settlements initiated a process of congregating along principal traffic arteries, thereby facilitating the outward conveyance of agricultural products and their interface with the market. Concomitantly, in order to access advanced production technologies and external finances, the locational advantages in proximity to towns grew increasingly salient. Lured by infrastructural amenities such as education and medical care, certain settlements gradually gravitated towards resource-rich zones. The spatial diffusion traits in this stage were epitomized by the agglomeration effect centered around the key village, thoroughly mirroring the pursuit of economies of scale.
Upon the entry of rural settlements into the mature stage, the man-land relationship theory commenced to dominate the spatial reconstruction process. The erstwhile residential patterns predicated solely on natural adaptability and economic expediency could no longer satiate the requisites of modern society. In order to foster social interaction, enhance managerial efficiency, and perpetuate regional cultures, the merits of the concentrated residential pattern have become progressively conspicuous. Such evolutionary idiosyncrasies have impelled the metamorphosis of rural settlements into comprehensive communities replete with comprehensive functions and unique features, engendering an agglomerated development pattern with pivotal towns at its core.
In the most recent developmental phase, the functions of the three theories have initiated a process of intertwining and amalgamation. Once the rudimentary material life has been secured, residents’ quest for an enhanced quality of life has precipitated the resurgence of decentralized expansion. On the one hand, some residents, in consideration of life quality, elect to distance themselves from concentrated residential zones and expand towards areas endowed with superior natural environs. On the other hand, the development of novel technologies has attenuated the reliance on spatial agglomeration and instigated the formation of new decentralized residential patterns in the surrounding areas. This evolutionary trend has rendered rural settlements manifest an agglomerated propensity on a macro scale while exhibiting a complex pattern of discrete distribution at the micro-local level.
Based on the above theoretical framework, this study has designed the corresponding technical route. Firstly, the LEI was used to identify the expansion patterns of newly added rural settlements from 2000 to 2020 and reveal their spatial evolution characteristics. Secondly, methods such as hot spot analysis and kernel density estimation were adopted to analyze the spatial distribution laws at both the patch and administrative unit scales. Thirdly, methods like the standard deviational ellipse were employed to explore their evolutionary trajectories. Finally, combined with natural and socio-economic factors, the influencing mechanisms of the evolution of rural settlements were analyzed in depth, so as to provide a scientific basis for optimizing the rural spatial layout and adjusting the industrial structure.
Methods
Study area and data sources
Study area
China is a vast country, and this study divides it into distinct regions (excluding Hong Kong, Macao, and Taiwan) based on climatic conditions, economic structures, and geographic locations, as illustrated in Fig. 2 and detailed in Table 1.
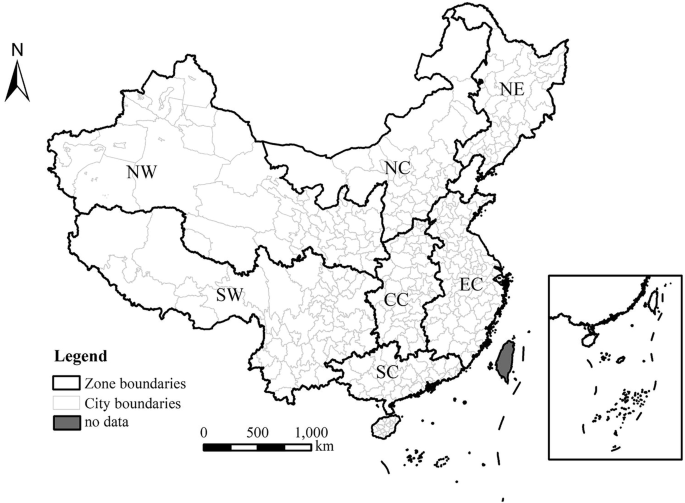
CC represents Central China; EC represents East China; NC represents North China; NE represents Northeast of China; SW represents Southwest of China; NW represents Northwest of China; SC represents South China.
Data sources
This study utilized four types of data:
-
(1)
Spatial data on rural settlements: Obtained from the Center for Resource and Environmental Sciences and Data, Chinese Academy of Sciences (http://www.resdc.cn/). The classification system of this dataset adopts a two-level classification system: the first level consists of six categories, primarily based on land resources and their utilization attributes, including arable land, forest land, grassland, water bodies, built-up land, and unused land. The second level mainly categorizes land based on its natural attributes, dividing it into 23 types. Among these, rural settlements are one of the secondary classifications under built-up land, referring to rural settlements independent of urban areas.
-
(2)
Road and river data: Sourced from OpenStreetMap 2020 (OSM) (https://www.openstreetmap.org).
-
(3)
Population density and GDP statistics: Collected from the China County Statistical Yearbook, local government official websites, and statistical bulletins. Missing values were filled using linear interpolation.
-
(4)
DEM data: Sourced from Geodata Spatial Cloud (http://www.gscloud.cn/) with a resolution of 250 m.
Identification of rural settlement expansion patterns
Previous studies have identified three types of patch expansion patterns: infilling, edge-expansion, and outlying (Fig. 3). The LEI is defined in Eq. (1).
where Ao represents the intersection area between the newly added rural residential patch and the original settlement patch, Av denotes the intersection area between the buffer of the newly added patch and the open space. Following the buffer size setting proposed by Liu et al. (2010), this study set the buffer size to 1 meter. When the LEI equals 0, it indicates an outlying patch. If 0 < LEI < 50, the patch is classified as edge-expansion. Otherwise, the patch is considered infilling. The area-weighted average method was employed to calculate the Global Landscape Expansion Index (GLEI) for each county, as shown in Eq. (2).
where LEIi and ai represent the area and perimeter of the new patch in county i, respectively. A denotes the total area of the new patch, while GLEI describes the degree of clustering of rural settlements, with higher values indicating a greater degree of patch aggregation.

a represents the infilling expansion; b represents the edge-expansion; c represents the outlying expansion.
Research methodology
Spatial hot spot analysis
Hotspot analysis can identify the presence of clusters and dispersed areas by evaluating the degree to which the attribute values of settlement elements are spatially clustered at the local level (Zhang et al. 2019).
The formula is as follows:
where ({{G}}_{{i}}^{* }({d})) is the rural settlement element i to be measured, n is the total number of rural settlements patches, ωij is the spatial weight within distance d, and xj is the j rural area property value of the rural settlement.
Average nearest neighbor index
The average nearest neighbor (ANN) analysis measures the average distance between each feature and its closest neighboring feature.
The formula is as follows:
where D0 is the observed average distance; De is the expected average distance; n is the number of features; d is the observed mean distance; A is the spatial unit area. If the index is <1, the pattern shows clustering; if this index is >1, the trend is dispersion.
Kernel density estimation
Kernel density estimation (KDE) intuitively shows changes in density by identifying where elements are clustered in space.
The formula is as follows.
where f(x, y) denotes the point (x, y) value of the kernel density; h is the bandwidth or smoothing parameter; k denotes the kernel function; di is the distance to be observed between the rural settlement location (x, y) of the ith sample and the rural settlement (xi, yi).
Standard deviational ellipse
The multidimensional spatial properties of the study object can be adequately reflected by the standard deviation ellipse (SDE) (Du et al. 2019). It consists of three basic elements: the long axis, the short axis and the azimuthal angle, and is usually used to reflect the dynamic evolution trend and its dispersion degree. The long and short axes reflect the range and direction of data distribution, the azimuth reflects the main trend direction of its distribution, and the mean center comes to reflect the evolution trajectory.
The formula is as follows.
where n denotes the number of counties; (({{x}}_{{i}},{{y}}_{{i}})) denotes the latitude and longitude geographic coordinates of the study object; ωi denotes the weight; ((bar{{X},}bar{{Y}})) denotes the average weighted mean center coordinates; θ is the azimuth of the ellipse; σx, σy denotes the ellipse x– and y axes of the standard deviation.
Results and analysis
Changes in the size of rural settlements
This study first identified the expansion patterns of rural settlement patches. Figure 4 shows the analysis at both the patch and county levels. From 2000 to 2020, the number of rural settlements steadily increased, with 810,765 new settlements covering 46,127.44 km2. The density of settlements varies significantly by region. The eastern side of the Hu Line, a demographic dividing line in China with a dense population in the east and a sparse in the west, shows much higher density.

a represents the LEI at the patch scale; b represents the GLEI at the county scale.
At the patch level, outlying expansion is the most common type, covering 40,322.74 km2 (87.42% of the total expansion), primarily in the north. Edge-expansion accounts for 12.46%, mainly in the south, while infilling expansion, with just 0.13%, is scattered in the central region (see Fig. 4a, Table 2). At the county level, outlying expansion is concentrated south of the Yellow River, while edge-expansion is mainly north, consistent with patch-level results (see Fig. 4b).
The study also found distinct patterns in hot and cold spots between 2000 and 2020 (see Fig. 5a, b). Hot spots were located in resource-rich and economically developed areas like the North China Plain, Northeast Plain, Southern Coastal Region, and Eastern Coastal Region. In contrast, cold spots were mostly in the Central Region, forming a “low-high-low” wavy distribution from the Northeast to the Southwest. New rural settlement hot spots were concentrated in the Beijing-Tianjin-Hebei region and scattered elsewhere (see Fig. 5c). Outlying expansion hot spots were concentrated in the Shandong Peninsula, southern Yunnan-Guizhou Plateau, and southern coastal areas (see Fig. 5d), while edge-expansion hot spots were in the Yunnan-Guizhou Plateau, southern coastal belt, and Sichuan Basin (see Fig. 5e).
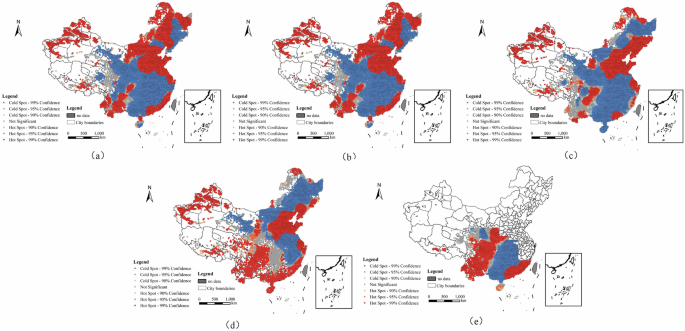
a Represents rural settlement hotspots in 2000; b represents rural settlement hotspots in 2020; c represents newly added rural settlement hotspots over the 20-year period; d represents Outlying rural settlement hotspots over the 20-year period; e represents Edge-expansion rural settlement hotspots over the 20-year period.
Spatial characteristics of rural settlements
Global analysis
The results of the kernel density analysis (Fig. 6a, b) indicate that the high-density agglomeration areas have remained relatively stable, with a significant increase in the degree of agglomeration. This concentration is primarily located in the plains stretching from the southern region of the Yellow River to the northern region of the Yangtze River. Additionally, several high-value areas have evolved into extremely high-value zones.
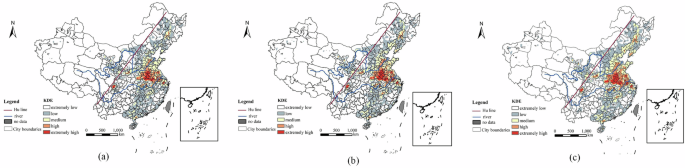
a Represents rural settlement kernel density in 2000; b represents rural settlement kernel density in 2020; c represents newly added rural settlement kernel density over the 20-year period.
The distribution of kernel densities for new rural settlements is illustrated in Fig. 6c. The evolution trend shows that areas with high densities of new rural settlements are concentrated in the North China Plain and the Northeast China Plain, with a gradual decrease extending along low-elevation regions and river valley networks. This distribution pattern exhibits distinct strip-like variations, particularly at the Anhui-Henan junction. Furthermore, in gently sloping, crop-rich regions such as the Songliao Plain, Guanzhong Plain, and the West Sichuan Plain, there is a notable presence of high-density distributions, characterized by “one main core, many scattered cores”. Conversely, areas distant from plains and land border zones generally exhibit low-density values. Notably, the Yangtze River Delta (YRD), as an economically developed region along China’s eastern coast, has recently emerged as a significant agglomeration core for new rural settlements. This trend suggests that new rural settlements tend to be located in areas with low relief, extensive river networks, high economic levels, well-developed infrastructure, and abundant employment opportunities.
Regional analysis
The ANN index of rural communities across all seven areas remained below 1 throughout the study period. Furthermore, the ANN values in 2020 were lower than those in 2000, indicating a significant increase in the clustering of rural settlements (see Table 3).
The newly established rural settlements form several distinct, high-density clusters, mainly located in plains regions (Fig. 7). Table 4 shows the proportion of rural settlements with different expansion patterns across the seven regions. Notably, rural settlements with outlying expansion have seen the most significant increase in density, particularly at the junction of Central China (CC) and northern East China (EC). These settlements primarily cluster around the North China Plain, forming a core agglomeration area, with additional point-like clusters in the Yangtze River Delta. The CC region displays a north-south divide in expansion patterns: the northern plains are predominantly characterized by outlying expansion, while the southern hills exhibit multiple high-density cores associated with edge-expansion.

a Represents Outlying rural settlement kernel densities; b represents Edge-expansion rural settlement kernel densities.
In northern China, all rural settlements exhibit outlying expansion. During the study period, the net increase in rural settlement land area was 10,637.57 km2 in North China (NC) and 6,961.93 km2 in Northeast China (NE). A distinctive stripe distribution pattern emerged: bounded by the Daxing’anling Mountains and centered on the northeastern plains, high-density areas are concentrated on the low-elevation plains and gradually extend to lower elevations on both sides.
In Southwest (SW) and Northwest China (NW), rural settlements are expanding over smaller areas, contributing 5.19% and 10.35% of the national rural settlement expansion, respectively. These regions feature multiple core areas with modest density increases: outlying expansion is mainly concentrated in the Hexi Corridor, while the Western Sichuan Plain is a high-density agglomeration area for edge-expansion.
In contrast, rural settlements in the South Central (SC) region are predominantly characterized by edge-expansion, accounting for 81.34% of the area’s expansion. Given that both the southern part of Central China (CC) and the SC region are hilly and serve as primary centers for edge-expansion, it is plausible that topography significantly influences the patterns of rural settlement expansion (Wang et al. 2022).
Evolutionary trajectory of rural settlements
The results of the standard deviation ellipse are presented in Fig. 8 and Table 5. Over the 20-year period, rural settlements predominantly shifted in a southeast-northwest direction, with significant migration observed between Heze in Shandong and Anyang in Henan. However, the overall movement remained concentrated in the middle reaches of the Yangtze River. Regarding the rotation angle, the values for 2000, 2020, and the entire 20-year period were 48.07°, 65.88°, and 87.12°, respectively, indicating a clockwise shift. The long axis lengthened from 1,079.07 km in 2000 to 1,127.32 km in 2020, incorporating the 1,331.52 km axis of newly added rural settlements over the 20 years, showing an overall increasing trend. Similarly, the short axis expanded from 710.49 km in 2000 to 792.86 km in 2020. Overall, rural settlements exhibited expansion in all directions, particularly in the northeast–southwest direction. The elliptic oblateness in 2020 was lower than in 2000, suggesting a decrease in directional bias in rural settlement development. These changes reflect the impacts of population growth and economic development, as well as regional disparities and trends in population mobility.
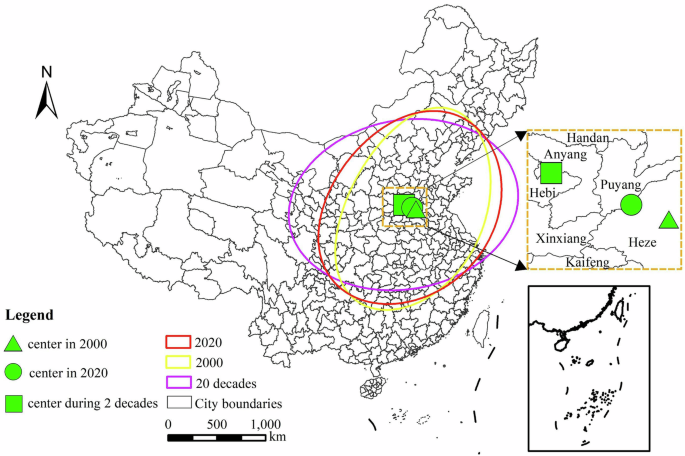
Spatial variation of standard deviation ellipses and mean centers in rural settlements.
Correlation analysis of new rural settlements with different factors
Altitude
As altitude increases, the size of rural settlements decreases (see Fig. 9). Most new rural settlements (65.58%) are located at low altitudes (≤200 m), where 90.13% of expansion occurs through outlying development, the highest among all elevation intervals. This suggests that rural settlements on flat terrain are more likely to expand through detached construction. At altitudes of 200–500 m, the percentage of patch area drops to 13.66%. Despite this decrease, infilling expansion becomes more significant. It increases from 0.10% to 0.39%, making it the highest across all intervals. The percentage of edge-expansion remains stable at 16–19% with rising elevation, indicating a greater tendency to expand along the edges of original homesteads in mid-to-high elevation areas. Although regions over 1,000 m cover much of China’s land, only 12.22% of newly constructed rural settlement areas are in these high-altitude regions, indicating their unsuitability for human habitation.
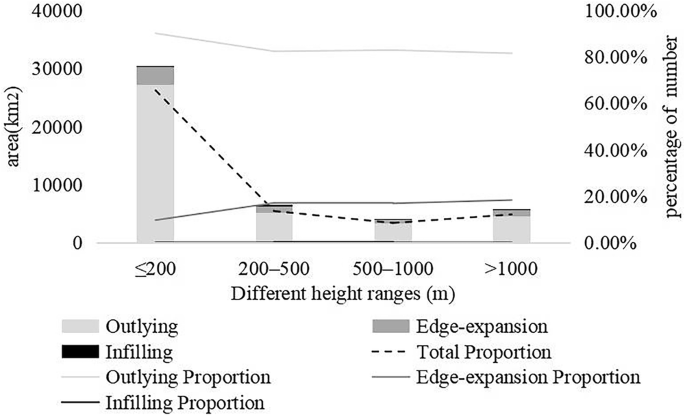
The horizontal axis represents different elevation ranges, the vertical axis on the left represents the area, and the vertical axis on the right represents the proportion of the number. The bar chart represents the areas of rural settlements with different expansion patterns within different elevation ranges. The line chart represents the proportion of the quantities of rural settlements with different expansion patterns within different elevation ranges.
Topographical conditions are crucial in shaping rural settlements and limiting their expansion (Li and Li, 2019). Low elevations are particularly favorable for farmers’ livelihoods and activities (Zhao et al. 2021). As altitude increases, natural conditions—such as lower temperatures, reduced transport connectivity, and a deteriorating agricultural environment—worsen. Therefore, high-altitude areas, with their harsh natural conditions, are generally unsuitable for large-scale rural settlement development and expansion, directly restricting their growth potential and direction.
Water systems
Water resources are essential to the structure of rural villages, serving the needs of both humans and livestock. In this study, river data were extracted from OpenStreetMap (OSM), with water system boundaries set at distances of 20, 40, 60, and 80 km from the river (see Fig. 10). The analysis shows a decline in the number of rural settlements as their distance from the river increases. Between 2000 and 2020, new rural settlements within 20 km of the river accounted for 51.41% of the total. However, beyond 80 km, the number of new settlements drops significantly to 35,683, representing only 4.40% of the total increase. Additionally, rural settlements with outlying expansion tend to be less dependent on proximity to water: as the distance from the river increases, the proportion of outlying expansion rises from 68.84% to 97.41%, while edge-expansion declines from 31.13% to 2.59%.
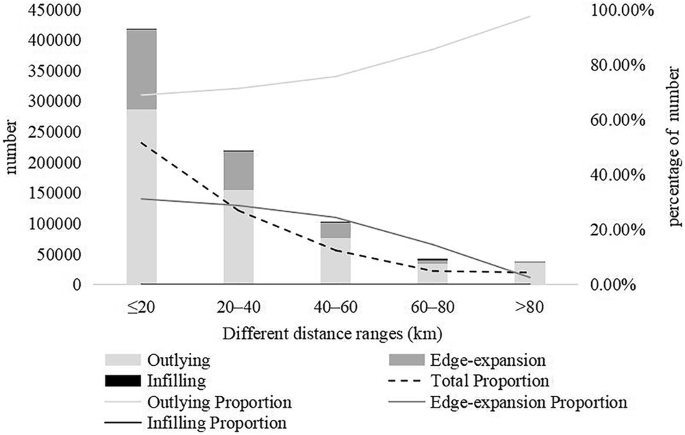
The horizontal axis represents different water system ranges, the vertical axis on the left represents the number, and the vertical axis on the right represents the proportion of the number. The bar chart represents the areas of rural settlements with different expansion patterns within different water system ranges. The line chart represents the proportion of the quantities of rural settlements with different expansion patterns within different water system ranges.
The “hydrophilic” nature of settlement distribution is evident. Water resources are fundamental to human survival and crucial for agricultural development (Forleo et al. 2017). Traditionally, most villages have been established near water bodies (Ma et al. 2017), forming regular and compact settlement patterns close to rivers to meet daily needs. Rivers also provide essential irrigation for farmland, supporting consistent crop growth. In contrast, outlying expansion is characterized by decentralization and spatial separation, where new rural settlements are established independently of original homesteads, forming new growth points with reduced reliance on water resources.
Transport
In recent years, the distribution of rural settlements along roads has changed significantly (Liu et al. 2022). The land area of villages near major transportation routes has expanded substantially (see Fig. 11). The number of rural settlements peaks at 562,586 (69.39% of the total) within a 10 km radius of roads, then gradually declines with increasing distance. Beyond a 40 km radius, the number of new settlements drops to just 16,753. In contrast, the proportions of outlying and edge-expansion settlements change only slightly across different distances.
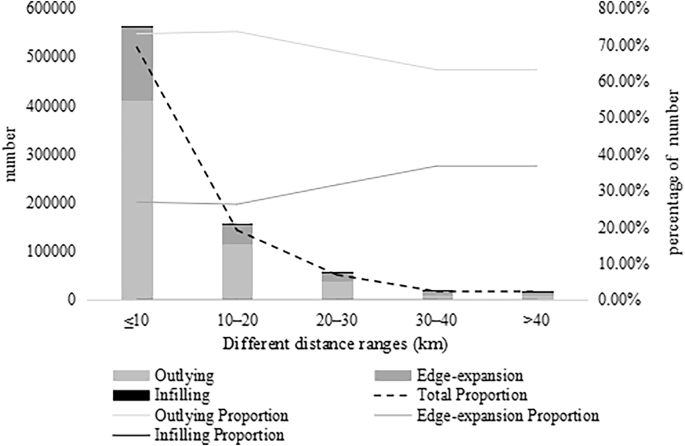
The horizontal axis represents different road ranges, the vertical axis on the left represents the number, and the vertical axis on the right represents the proportion of the number. The bar chart represents the areas of rural settlements with different expansion patterns within different road ranges. The line chart represents the proportion of the quantities of rural settlements with different expansion patterns within different road ranges.
Transportation remains a key factor influencing the evolution of rural settlements (Wang et al. 2022). As the primary means of connecting with the outside world and a crucial part of daily life, transportation is foundational to economic development (Wang and Zhang, 2021). Rural residents often build homes near major roads or routes linked to important transportation networks to reduce construction costs and ensure easy access to transit. These roads not only provide convenient travel options but also play a vital role in the growth of rural settlements (Zhang et al. 2018). Improved transportation conditions attract external investment and talent, promoting local economic development (Li et al. 2019). Additionally, good transportation facilitates the sale and distribution of agricultural products, thereby increasing farmers’ income (Steyn et al. 2015).
Population
Population is a key factor in the development of rural settlements, directly influencing their size and density. As shown in Table 6, in areas with a population density of less than 100, 62.33% of districts and counties experience outlying expansion. This percentage drops sharply to 37.81% as population density increases to 100–200, but then gradually rises to 74.28%, following a normal distribution pattern. Edge-expansion follows the opposite trend, indicating that as population density increases, rural settlements exhibit more diversified development.
Population growth has significantly influenced the evolution of rural settlements (Song and Li, 2020). In areas with exceptionally high population densities, limited land resources create pressure on land use. Outlying expansion can alleviate this strain by distributing settlements over a larger geographic area, promoting balanced growth in rural communities and reducing issues like traffic congestion, environmental pollution, and overcrowding. Conversely, areas with very low population density, while often resource-rich, tend to lag in economic development due to remote locations and poor transportation infrastructure. Decentralizing and expanding rural settlements in these areas can help better utilize local resources and stimulate economic growth.
Economic development
Socio-economic factors are key drivers of changes in rural settlement patterns. As shown in Table 7, the percentage of counties and districts experiencing outlying expansion has remained relatively consistent, ranging between 50% and 60% across different GDP per capita intervals. Notably, when GDP per capita exceeds 120,000 yuan, the proportion of counties and districts exhibiting outlying expansion rises to 63.91%, indicating that settlement expansion is more pronounced in areas with higher economic levels.
In highly industrialized areas, the formation of various types of industrial agglomerations has led to the relocation and merging of original settlements, significantly altering local settlement patterns (Li et al. 2022). A high GDP reflects strong economic vitality and a well-established industrial chain (Wang et al. 2022). Economic growth drives industrial diversification and expansion, creating more employment opportunities for rural residents, often with more comprehensive supporting facilities. This environment attracts further investment and talent, fostering industrial development and creating a virtuous cycle. Additionally, economic development increases the demand for living space, leading to significant expansion in rural settlements to accommodate these needs. Thus, economic development is a crucial external driver of the evolution of rural settlement size (Song et al. 2014).
Discussion
This study provides a comprehensive analysis of rural settlement expansion patterns in China from 2000 to 2020, revealing significant spatial heterogeneity and complex evolution dynamics at multiple scales. Our findings not only advance the understanding of rural settlement development but also have important implications for regional planning and policy making. The following sections discuss how our results compare with existing research, their implications for rural planning, and directions for future research.
Comparison with existing research
Our findings both align with and differ from previous research in several important ways. While earlier studies have identified the general expansion patterns of rural settlements, our nationwide multi-scale analysis reveals more complex dynamics and regional variations than previously documented. Regarding expansion patterns, our finding that outlying expansion dominates (87.42%) differs notably from studies focused on smaller regions. For instance, Chen et al. (2021) found a more balanced distribution between outlying and edge-expansion patterns in the Loess Plateau region. The observation of a clear southeast-northwest axis of settlement movement, with a clockwise rotation, provides a broader perspective than previous regional studies. While Tan et al. (2021) identified a wave-like distribution pattern from southeast to northwest in Hubei Province, our national-scale analysis shows this is part of a larger systematic movement pattern across China. Our findings on driving factors both support and expand upon existing research. Like Li and Jiang (2018), we found that natural factors significantly influence settlement distribution. However, our analysis reveals that the relative importance of these factors varies by region and expansion type – a nuance not captured in previous studies focused on smaller areas.
The integration of patch-level and administrative-unit analyses in our study addresses several key limitations in existing research and provides novel insights. This analytical approach offers a deeper understanding of the relationship between local expansion characteristics and broader regional patterns, addressing a key limitation noted by researchers like Zhang et al. (2022), who highlighted the need for multi-scale analysis but were limited by their focus on specific regions. The significant regional variations in expansion patterns revealed by our study challenge the generalizability of conclusions from local studies. For example, while Song and Li (2020) found predominant edge-expansion in Tongzhou District, our national analysis shows this pattern is more characteristic of southern regions, while northern regions tend toward outlying expansion. These findings highlight the importance of comprehensive, multi-scale analysis in understanding the complex dynamics of rural settlement evolution, suggesting that findings from local studies should be interpreted within their regional context rather than generalized nationally. This multi-scale perspective provides a more nuanced and complete understanding of rural settlement patterns, offering valuable insights for both theoretical research and practical planning applications.
Implications for rural planning
The analysis of this study reveals significant disparities in rural development across China, prompting the need for targeted policy actions. Below are the policy recommendations aimed at addressing these challenges and fostering balanced growth in rural areas.
Implementation of regionally differentiated policies
It is imperative for northern China to place a primary emphasis on fortifying ecological protection supervision. During the approval process of rural residential area expansions, precedence ought to be accorded to comprehensive ecological impact assessments, thereby precluding potential damage to ecologically fragile belts. In the southern region, measures should be taken to steer edge expansion towards a more organized and centralized pattern. This could involve meticulous planning and construction of ancillary industrial parks to catalyze the integration of production and residential functions. Meanwhile, in the central region, intensified efforts are required to revitalize and make efficient use of the idle land within extant rural residential areas, fostering infill development. Financial incentives could be provided to village collectives or individuals who utilize idle homesteads to erect public service facilities or initiate small-scale industries.
Adoption of a hybrid infrastructure layout combining decentralized and centralized modes
In the plains characterized by high-density agglomerations of rural residential areas, scientific planning of centralized residential communities is of utmost importance. Concurrently, an intelligent management system ought to be refined within these communities to augment the living standards of residents. Moreover, a reserved proportion of flexible space is necessary to accommodate any potential decentralized demands that may emerge in the future. With regard to infrastructure such as water supply and power provision, small-scale distributed stations could be erected in accordance with the spatial distribution of residential areas, which would effectively curtail construction and maintenance costs. For facilities like sewage treatment and garbage disposal, centralized treatment centers are recommended to enhance operational efficiency.
Prudent execution of adequate natural and locational assessments in the initial planning phase
In low-altitude regions and areas where the density along river networks is on the decline, it is essential to formulate a distinct ecological protection red line. This line would serve to demarcate the boundaries of permissible residential area expansions, while simultaneously promoting the adoption of environmentally friendly building technologies. Along riverbanks and transportation corridors, buffer zones should be meticulously planned to orchestrate orderly development and avert excessive encroachment upon ecological spaces. Grounded on economic and population metrics, in underdeveloped and sparsely populated regions, targeted investments in educational and medical resources are warranted to elevate the caliber of public services, thereby attracting population return and permanent settlement.
Limitations and future works
Although this study offers a valuable reference for the advancement of rural settlements, it is not without certain limitations. The most prominent deficiency resides in the oversight of the role played by policy text factors. In recent years, following the nationwide implementation of the Rural Revitalization Strategy, a succession of policies designed to propel rural development have been formulated and enacted, spanning land use regulations, subsidy and incentive mechanisms for agricultural modernization, as well as support for rural infrastructure construction. Nevertheless, in the current analysis, the potential implications of these policies on the evolution of rural settlements have yet to be comprehensively contemplated. For future research endeavors, in-depth analyses of specific policy texts are warranted to decipher the underlying intentions and implementation modalities. Additionally, surveys and interviews ought to be carried out among local government officials, policy enforcers, and rural inhabitants to gather first-hand data regarding the actual influence of policies on rural settlement development, thereby making more substantial contributions to both the research and practice of rural development.
Conclusions
This study presents a comprehensive multi-scale analysis of rural settlement evolution and its driving forces in China from 2000 to 2020, employing various spatial analysis methods and incorporating multiple influencing factors. Our findings reveal distinct patterns in the spatial distribution, temporal evolution, and expansion characteristics of rural settlements, providing valuable insights for rural planning and development policies. The main conclusions are as follows:
-
(1)
From 2000 to 2020, rural settlements expanded significantly, with dense settlements in the east and sparse settlements in the west, divided by the Hu Line. Outlying growth dominated this expansion, covering 40,322.74 km2 and accounting for 87.42% of the total expansion, primarily in the north. edge-expansion made up 12.46%, mainly in the south, while infilling expansion was minimal at 0.13% and scattered in the central region.
-
(2)
Rural settlements in China are shifting from centralized to decentralized patterns. High densities of new settlements are concentrated from the south of the Yellow River to the north of the Yangtze River, with the North China Plain as the primary center. Density decreases along low-elevation areas and river networks, showing distinct stripe patterns. High-density areas are also present in the Songliao Plain, Guanzhong Plain, and West Sichuan Plain, forming a pattern of “one main core and multiple scattered cores”.
-
(3)
The distribution of newly established rural settlements is significantly influenced by natural and locational factors, primarily concentrated in low-altitude areas, with a notable trend of expansion towards riverbanks and transportation routes. Meanwhile, per capita GDP and population density also have a significant impact on the distribution and expansion patterns of rural settlements.
Responses