Unveiling mechanistic intricacies of Chlorella pyrenoidosa-mediated pathogen removal from sewage

Introduction
Contaminated water presents an alarming global concern, with billions of people still lacking access to safe drinking water. As per a recent United Nations report, the world is not on track to achieve Sustainable Development Goal (SDG) 6, “clean water and sanitation for all”. The recent statistics reveal that every one in four persons lacks access to safe drinking water1. Consequently, the direct or indirect consumption of polluted water has increased the global disease burden. The estimates for global disease burden are startling, with ~4 billion cases of diarrhea per year, resulting in 2.2 million deaths. In India, around 37.7 million people per year are affected by waterborne diseases, with 1.5 million children lost to mortality2. The situation is exacerbated by climate change with increased unpredictability of water availability, water scarcity, and contamination of water supplies3. Overall, it is evident that consuming contaminated water and associated waterborne diseases is a worldwide challenge. The substantial gap between wastewater generation and treatment has further worsened the issue of water pollution4. The presence of waterborne pathogens in the disinfected effluent, i.e., post-chlorinated or ultraviolet (UV) treated water, has raised concerns regarding the need for additional treatment methods5,6,7. Hence, technological interventions are needed for appropriate wastewater management.
Phycoremediation exploits the potential of microalgae to utilize the wastewater nutrients, predominantly phosphate, and nitrate, for their growth and survival, thereby treating the wastewater. The role of microalgae in removing nutrients from wastewater is a well-established phenomenon8,9. Recent scientific literature has highlighted the potential of microalgae-based systems to remove various pathogens like coliforms, Escherichia coli, Pseudomonas sp., Enterococcus sp., Clostridium sp., adenovirus, and coliphages from wastewater10,11,12,13. A native consortium (dominated by Chlorella sp., Scenedesmus sp., Chlamydomonas sp.) based microalgal system achieved 1–1.2 log reduction value (LRV) for coliforms and E. coli from anaerobic treated sewage10. Some studies have also demonstrated the successful operation of microalgae-mediated pathogen removal (MAPR) at a pilot scale11,13. An LRV of 5 and 4.5 was reported for total coliforms and fecal coliforms, respectively, during phycoremediation of urban wastewater in a 100 L bubble column photobioreactor11. Likewise, a Galdieria sulphuraria-based 700 L microalgal system achieved complete removal of total and fecal coliforms during municipal wastewater treatment. An 82% decline was observed in the total abundance of the Bacteria kingdom during the phycoremediation process13. Previous research has also shown that incorporating MAPR in existing sewage treatment plants doesn’t impart additional environmental burdens or microbial health risks, demonstrating its real-life applicability14. Hence, it has become evident that implementing MAPR in wastewater treatment can produce pathogen-free water for safe reuse practices, which is crucial from a public health perspective.
The concepts and mechanisms of MAPR are relatively underexplored. Previous MAPR studies have hypothesized and postulated theories that microalgae-induced pH change, microalgae-mediated photooxidation, interkingdom competitive interactions, or pathogen attachment may mediate pathogen removal during MAPR. However, there is a lack of experimental evidence investigating the role of each plausible mechanism in MAPR. Only few studies have attempted to analyze some MAPR mechanisms or removal factors15,16. Žitnik et al.15 and Munasinghe-Arachchige et al. 16 have indicated the role of pH and nutrient concentration in MAPR. However, the studies provide preliminary results and does not entail an in-depth analysis of the mechanisms. For instance, ref. 15 demonstrated that the Chlorella vulgaris-mediated E. coli removal from blackwater was primarily influenced by electrical conductivity followed by microalgal concentration and pH15. Nonetheless, the study considered electrical conductivity as an indirect indicator of nutrient concentration while the pH experiments lacked control setups (pH maintained vs. unmaintained systems), and did not investigate a crucial factor i.e., illumination during MAPR. Moreover, the research was primarily limited to a cause-effect relationship of operational parameters, while no attempts were made to delineate the underlying mechanisms. Likewise, a low pH of 4 was identified as a crucial factor governing Galdieria sulphuraria-based pathogen removal from municipal wastewater16. However, the study employed an acidophilic microalga, optimum cultivation pH 4, which ultimately hindered E. coli growth and required wastewater pH adjustment for microalgae cultivation and treated water. Although aforementioned studies have hypothesized the possible attachment of bacteria to microalgal cells, there is a lack of in-depth investigations targeted at the identification of factors driving the attachment process.
Overall, none of the previous MAPR studies have conducted a comprehensive assessment of all plausible MAPR mechanisms, as attempted for the first time in the present study. Furthermore, the role of microalgae-enhanced photooxidation has not been investigated earlier, including the analysis of cellular oxidative stress vis-à-vis MAPR efficiency. The present study addresses the aforementioned research gaps by conducting an exhaustive analysis of MAPR mechanisms. At the optimized conditions, each plausible MAPR mechanism has been studied for the model C. pyrenoidosa–E. coli coculture and control systems (microalgal and bacterial monoculture). Initially, the role of live vs. dead microalgae in MAPR has been investigated followed by analysing the significance of microalgae-mediated pH change in MAPR. Subsequently, microalgae-enhanced photooxidation has been studied for estimation of total oxidative stress under combined ultraviolet and visible irradiation (mimicking solar radiation) followed by studying the impact of varied photoperiods on MAPR. Moreover, the photooxidation study entailed the identification of key reactive oxygen species (ROS), which remains an unexplored aspect of MAPR. The electron microscopy techniques were then employed to infer the role of attachment in MAPR followed by identification of attachment-mediating functional group. Overall, the present findings provide novel insights regarding the MAPR mechanisms, whereby, the optimal process conditions for C. pyrenoidosa-mediated E. coli removal from sewage have already been established in previous study17. An in-depth understanding of MAPR mechanisms shall provide a roadmap for future research aimed at targeted system designs to improve the efficacy and process viability of MAPR for real-world applications. The systems with improved efficacy can offer a promising and sustainable solution to the sanitation challenges of waterborne diseases, water availability, and inadequate management.
Results and discussion
Metabolically active microalgae are a prerequisite for MAPR
E. coli removal trend was observed for MAPR setups with untreated (live) C. pyrenoidosa vis-à-vis heat-treated (dead) C. pyrenoidosa. An LRV of 3.45 (99.97%) (p value <0.01) was achieved for E. coli in the presence of untreated C. pyrenoidosa. Alternatively, the E. coli population increased by 20 and 10% in the heat-treated and control setups, respectively (Fig. 1). E. coli feeding on the organic matter leached from dead microalgal cells resulted in a high bacterial abundance in the heat-treated setup, as evident in a previous study16.

Heat-treatment involved subjecting C. pyrenoidosa to 80°C to ensure a complete loss of cell viability.
The microalgal growth statistics further validated the E. coli removal trends. C. pyrenoidosa demonstrated appropriate growth with increased chlorophyll-a (chl-a) concentration from 0.79 (0 h) to 4.61 ± 0.01 mg L−1 within 24 h. Likewise, the biomass content increased from 0.66 ± 0.01 to 1.26 ± 0.01 g L−1 within 24 h. However, the chl-a concentration declined to 0.02 mg L−1 for the heat-treated setup with no increase in the biomass content. Some previous studies have attempted to explore the pathogen removal factors or mechanisms15,16. However, the role of live vs. dead microalgae in MAPR has not been investigated yet. The present results validate the hypothesis that metabolically active microalgae are essentially required for pathogen removal from sewage.
C. pyrenoidosa-mediated alkalinity is harmful to pathogens
Microalgae-mediated pH increase is a well-known phenomenon. The microalgal uptake of carbon dioxide for photosynthesis influences the dissolved carbon dioxide concentration, shifting the equilibria between carbon dioxide and carbonic acid. Consequently, a decline in the concentration of hydrogen ions occurs, resulting in increased alkalinity18. The toxicity of low (4) and high (>9.4) pH to various pathogens, including Gram-negative E. coli, is widely reported16,19. The effect of C. pyrenoidosa-induced alkalinity on E. coli survival was investigated at optimized MAPR conditions. The pH levels in the test setups were maintained at acidic (4), neutral (7), and alkaline (8, 9, 10, 11) conditions, while the pH was not controlled in the control setups. E. coli abundance and pH profiles for the different experimental setups are demonstrated in Fig. 2a, b, respectively. E. coli cell density profiles revealed a reduction in the total removal time with an increase in pH from 7 to 11. For the experimental setups with pH maintained at acidic and high alkaline values (10 and 11), complete E. coli removal was obtained in the presence of C. pyrenoidosa within 24 h, demonstrating that highly acidic and alkaline pH are harmful to E. coli survival. Similar to findings from previous study, E. coli continued to survive in the absence of C. pyrenoidosa without pH maintenance, as represented by the “pH (UM) E. coli” trend in Fig. 2a17. Alternatively, complete E. coli removal was achieved in the presence of microalgae without pH maintenance, pH (UM) setup, whereby C. pyrenoidosa demonstrated optimal growth (specific growth rate ⁓0.28 day−1). Relating bacterial abundance to the pH profile in the coculture (pH UM) setup revealed that the time point for complete E. coli removal coincided with that for maximum pH (⁓11), similar to the pH 11 maintained setup, pH 11 (M)19.
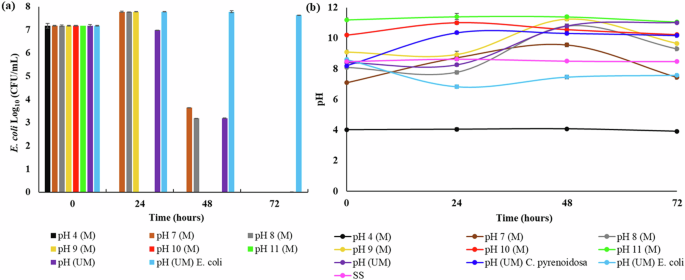
a E. coli abundance and b pH trends in different MAPR setups. “M” and “UM” within parenthesis symbolize conditions where pH was maintained and unmaintained, respectively. “pH (UM)”, “pH (UM) C. pyrenoidosa” and “pH (UM) E. coli” represent the coculture, microalgal monoculture (control), and bacterial monoculture (control) setups, respectively. “SS” represents synthetic sewage without any microalgal or bacterial inoculum.
Regarding microalgal growth, C. pyrenoidosa could not survive at an acidic pH of 4, while lower growth rates (specific growth rate ⁓0.04 day−1) were observed for alkaline pH setups. The decline in microalgal growth at pH 10 and 11 can be attributed to the reduction in the availability of nutrients under alkaline conditions20. The C. pyrenoidosa growth profile for all experimental setups is represented in Supplementary Figure 1. Overall, the findings prove that C. pyrenoidosa-mediated pH increase is one of the critical mechanisms resulting in E. coli decline during MAPR. Similar findings have been reported by previous studies where higher pathogen removal rates were observed at alkaline pH (≥10) during microalgae-based wastewater treatment11,15,21,22. However, studies involving wastewater treatment in open ponds or outdoor photobioreactors may challenge the accurate interpretation of microalgae’s role in observed pH increase. In the absence of positive and negative control setups, there might be perturbations in pH due to additional environmental factors. Hence, the current research, conducted in a controlled system with appropriate control setups, eliminated the effect of confounding factors and established a direct link between microalgae-mediated pH increase and E. coli decline.
Electron microscopy reveals E. coli attached to microalgae
As a conservative approach, both scanning electron microscopy (SEM) and transmission electron microscopy (TEM) were employed in the present work to study the role of attachment as an MAPR mechanism. Initially, SEM imaging represented individual E. coli cells or E. coli clusters attached to the surface of microalgal cells, as depicted in Fig. 3a–c. The present SEM results validate previous findings relating to bacterial attachment as one of the key MAPR mechanisms17. Building upon the SEM results, TEM microscopy was then employed to authenticate the C. pyrenoidosa-E. coli attachment. The results of TEM analysis are represented in Fig. 3d–i. The present TEM images were compared with the scientific literature relating to TEM studies of Chlorella sp., cyanobacteria-bacteria coculture systems, and E. coli23,24,25. Comparison with the previous TEM studies enabled accurate interpretation of E. coli-C. pyrenoidosa attachment. The E. coli attachment on C. pyrenoidosa cells or the microalgal extracellular matrix (ECM) is represented in Fig. 3d–f, highlighted by red circles. The attachment or adsorption of pathogens on the microalgal cell or entrapment within the microalgal ECM has been reported by previous studies26,27. A recent study demonstrated the attachment of phycospheric bacteria on microalgae Phaeodactylum tricornutum and Nannochloropsis salina28. Furthermore, the TEM images revealed a significant increase in C. pyrenoidosa ECM in the presence of E. coli as compared to the control (E. coli absent), depicted by red arrows in Fig. 3f–i, respectively. A recent study by Zhang et al. 29. reported a direct link between microalgal ECM and arsenic adsorption capacity in C. pyrenoidosa. It was revealed that the functional groups of the protein moieties in extracellular polymeric substances (EPS) served as the binding sites for inorganic arsenic29. Similar results were observed in the present study, where E. coli was attached to microalgal cells or ECM. Further, an increase in ECM production in the presence of E. coli might indicate a stress response of microalgae to the presence of other microbes. Previous research has highlighted that the presence of E. coli strongly induced the production of EPS in P. tricornutum30. The study indicated that the bacterial population influenced EPS production via soluble amino acids. The bacteria-mediated change in the dissolved free amino acids pool was identified as one of the controlling factors for EPS secretion in P. tricornutum30.
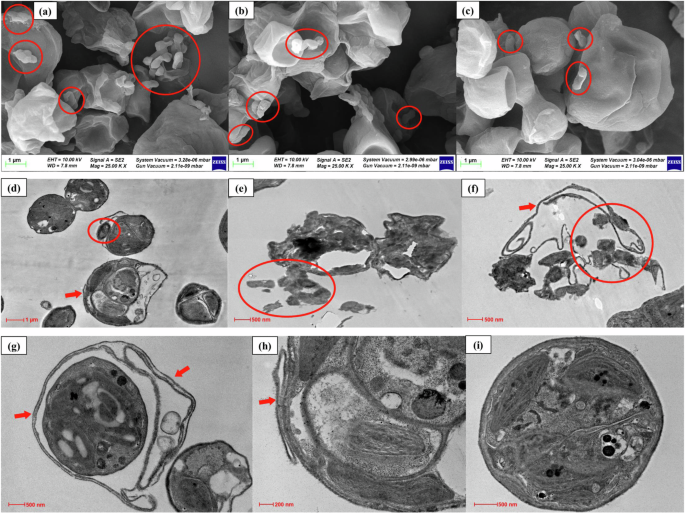
a–c Scanning electron microscopy; d–i Transmission electron microscopy. E. coli attached to the microalgal cells are highlighted by red circles, and arrows indicate the microalgal extracellular matrix.
Hydroxyl group crucial in C. pyrenoidosa-E. coli attachment
The microbial surface charges and suspension stability disclosed the prevalence of attractive forces in the coculture conditions. Subsequent to microscopic analyses, efforts were made to study the microbial surface charges during the microalgae–bacteria attachment. Zeta potential (ZP) measurement is a useful technique to analyse the charge of microbial cell surfaces. The absolute value of ZP provides information regarding the stability of the cell suspension. At the beginning of MAPR, the ZP values for C. pyrenoidosa + E. Coli, C. pyrenoidosa only, and E. coli only were −26.30 ± 0.14, −26.71 ± 0.15, and −28.71 ± 0.19 mV, respectively. At an LRV of 3.66 (99.98% removal) for E. coli, the ZP for all samples was measured again. The time point of complete E. coli removal corresponded to ZP values of −27.01 ± 0.19 mV for C. pyrenoidosa + E. coli, −35.02 ± 0.25 mV for C. pyrenoidosa only and −31.01 ± 0.15 mV for E. coli only. A detailed analysis of the initial and final ZP values in the test and control setups provides crucial insights. First and foremost, the negative ZP values reveal that both the microalgal and bacterial cells exhibit a negatively charged cell surface in all the experimental (test and control) conditions. The change in the absolute value of ZP was analyzed in the initial vs. final samples for all experimental setups to infer the stability of the cell suspension. Almost similar ZP values at the beginning of MAPR indicate that the microalgal and bacterial systems exhibit comparable stability. The final ZP (absolute) value was observed to be significantly (p value <0.01) higher for C. pyrenoidosa only (control), followed by E. coli only (control) and coculture (test) setup. Higher absolute values of ZP indicate the prevalence of repulsive forces; thus, the cells would be stable in the dispersed form. On the contrary, lower absolute values of ZP indicate that attractive van der Waals forces are predominant in the system. Interestingly, the final ZP for C. pyrenoidosa + E. coli was much lower than that for control setups and was nearly the same as initial values. The findings indicate the presence of additional attractive forces in the coculture conditions. The attractive forces, like van der Waals or acid-base interactions, are balancing and counteracting the repulsive forces31,32. Thus, despite being negatively charged, the microalgae and bacteria interact in such a way that the overall coculture system is relatively stable, hence minimizing any changes in ZP. Similarly, a recent study revealed efficient harvesting of C. pyrenoidosa by a bacterial-fungal combination of Citrobacter freundii and Mucor circinelloides33. All three microbial species exhibited a negative ZP within a broad pH range of 3–10: −20 to −25 mV for microalgae, −2 to −20 mV for bacteria, and −25 to −32 mV for fungus. Hence, the successful flocculation was attributed to net trapping and bridging, while the symbiont formation was not mediated by electrical neutralization. Similar observations were reported by ref. 34 for the adsorption of Aspergillus niger mycelial pellets for Chlorella vulgaris despite both being negatively charged at pH 7–10. It was observed that the adsorption was primarily mediated by EPS (84%) followed by ZP (11%)34. Overall, the current findings are consistent with previous research demonstrating the presence of attractive forces between negatively charged microbial species. However, the attachment of bacteria on microalgal cells as a MAPR mechanism has not been studied previously. The results reveal that attractive forces are prevalent in the presence of both C. pyrenoidosa and E. coli, while repulsive forces dominate within the individual microbial populations during MAPR.
Zeta potential analyses indicate the role of hydroxyl group
The ZP is governed by the functional groups on the cell surfaces and the pH of the culture medium34. Generally, hydroxyl, carboxyl, phosphate, and amine groups are present on the cell surface of any microorganism. Depending upon the dissociation constant (pK) of each functional group and the pH, these groups may be positively charged (pH<pK) or negatively charged (pH>pK). At pH=pK, a point of zero charge is attained, whereby the surface charge gets neutralized due to a balance between the protonated and the deprotonated groups. While recent studies have investigated the ZP of microalgae or bacteria35,36,37 however, no prior ZP studies have been conducted for MAPR.
A detailed study of ZP of individual microalgal and bacterial cells provides insights into the major functional groups involved in C. pyrenoidosa–E. coli interaction. Regarding C. pyrenoidosa, its point of zero charge is reported at pH 3.0. During MAPR experiments, the pH increases from an initial value of 8.4 to 11 at complete pathogen removal. Recent studies have reported the pK values for Chlorella sp. as 4–6 for carboxyl, 6–7 for phosphoryl, 8–9 for amino, and 11–12 for hydroxyl functional group38. Thus, only the hydroxyl group is associated with a pK higher than the pH prevalent in the MAPR setups. The findings are supported by recent studies demonstrating that microalgal growth is related to an increase in the concentration of hydroxyl sites on the cell surface39,40. Regarding E. coli, pK values of 2–6 and 5–7 have been reported for carboxyl and phosphoryl groups, respectively. Thus, the carboxyl and phosphoryl groups will remain negatively charged, with the charge increasing with an increase in pH. Among the hydroxyl (pK 9.6) and amine groups (pK 9.1), the hydroxyl groups play a significant role in governing the overall pK41. Based on the ZP values and the pK values for each functional group on microalgal and bacterial cell surfaces, it can be inferred that the hydroxyl group plays the most significant role in C. pyrenoidosa-E. coli attachment.
Prevalence of hydroxyl group verified by FTIR spectroscopy
The ZP analysis indicated that the hydroxyl group might mediate the microalgal-bacterial attachment. The MAPR samples were analyzed by Fourier Transform infrared (FTIR) spectroscopy to validate the abundance of hydroxyl groups. The FTIR spectra for the coculture samples at initial and final time points (corresponding to complete E. coli removal) are represented in Fig. 4. The peak characteristics at different wavenumbers were compared with the existing literature to identify the functional groups42,43,44. The analysis revealed a high abundance of hydroxyl groups in the final MAPR sample with characteristic peaks at 3200–3600 cm−1 (O-H stretch; intermolecular bonded), 1350–1450 cm−1 (O-H bend), and 600–700 cm−1 (O-H bend). Further, distinct peaks were observed at 1023 and 1112 cm−1, corresponding to the C-O stretch of primary and secondary or tertiary alcohol, respectively. Peaks were also observed for the S-H stretch of thiol at 2594 cm−1. Comparing the FTIR spectra for initial and final MAPR samples, a high abundance of hydroxyl groups was observed in the final sample with a predominant band for intermolecular bonded O-H stretch. The initial sample was characterized by the presence of both intermolecular and intramolecular bonded O-H stretches at 3200–3600 cm−1 and 2700–3200 cm−1. The increase in hydroxyl groups in the final MAPR samples can be attributed to the production of hydroxyl-rich compounds during metabolic activities, including the production of extracellular metabolites, as the microalgal cells progress from the active growth phase to the maturation phase39. Overall, the FTIR analysis confirmed the ZP results and validated the high abundance of hydroxyl groups in the MAPR coculture samples.
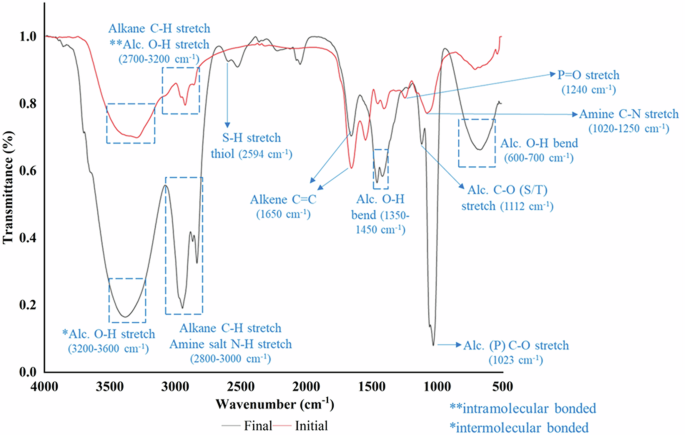
The initial time point corresponds to the start of the experiment, and the final time point represents the complete E. coli removal achieved during MAPR.
C. pyrenoidosa amplifies photooxidative damage to E. coli
The role of photooxidation as a MAPR mechanism was assessed by measuring the total oxidative stress in the MAPR setups. The total ROS levels were estimated in terms of the mean signal intensities obtained at different time points by CellROX®-based microplate fluorimetry. Figure 5 represents the fluorescent intensities and E. coli abundance in various MAPR setups. As expected, higher fluorescence intensities (representing ROS abundance) were observed in the C. pyrenoidosa + E. coli treated setup (16.33 ± 0.47 to 119.33 ± 1.51 a.u.) as compared to its untreated control (11.33 ± 0.94 to 54.31 ± 1.14 a.u.), depicted in Fig. 5a. The results indicate that the oxidative stress amplifies when the MAPR system is exposed to UV radiation. Further, higher fluorescent intensities were observed for the coculture (treated) setups compared to the monoculture (treated) system. For instance, corresponding to the time point of maximum ROS production, the mean signal intensity of 119.33 ± 1.51 a.u. in C. pyrenoidosa + E. coli treated setup was significantly (p value <0.01) higher than the E. coli only (81.03 ± 0.98 a.u.) treated setup. The enhanced ROS levels in the presence of C. pyrenoidosa can be attributed to oxygen production during microalgal growth. The molecular oxygen plays a crucial role in photooxidative damage as it reacts with excited photosensitizers to produce ROS. Natural organic matter, including humic substances and photosynthetic pigments, are common exogenous (outside cell) photosensitizers in water. The endogenous (inside cell) photosensitizers include flavins and porphyrin derivatives inside the bacterial cells45. Overall, the findings confirm that ROS production is enhanced in the presence of both C. pyrenoidosa and UV irradiation. Similar results were reported by a previous study where higher E. coli inactivation rates were obtained in the presence of both sunlight and microalgae G. sulphuraria. The microalgae-enhanced photooxidation was analyzed in terms of microalgae (presence or absence), solar irradiation (presence or absence), and E. coli abundance16. Likewise, 99% removal of total coliforms and E. coli were reported at the highest illumination intensities during sewage treatment in a microalgal open raceway pond10. Although previous studies have indicated the role of photooxidation in MAPR; however, the oxidative stress within the microalgae-based treatment systems has not been assessed yet.
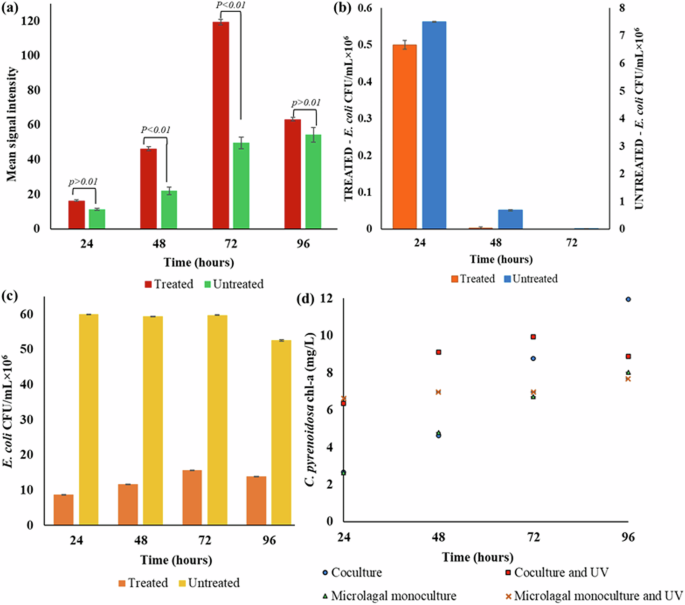
a CellROX® fluorescent intensity; b E. coli abundance in the presence of microalgae; c E. coli abundance in the absence of microalgae; d microalgal growth profile.
In addition to ROS production, the E. coli abundance was also monitored to infer the role of oxidative stress in pathogen removal. Figure 5b depicts the E. coli removal trend in C. pyrenoidosa + E. coli UV-treated and untreated MAPR samples. Analysis of E. coli abundance revealed rapid pathogen removal under UV-treated conditions. Further, complete removal was observed after three treatment regimes whereas the removal was delayed in the untreated setups. Hence, the results indicate that UV irradiation and a 16-h photoperiod expedite pathogen removal in MAPR. Further analysis of the E. coli population in monoculture (microalgae absent) demonstrated that the bacteria survived under both treated and untreated conditions, as represented in Fig. 5c. The prolonged E. coli survival in the absence of microalgae resolves the dilemma regarding the role of C. pyrenoidosa in the observed oxidative stress. Regarding C. pyrenoidosa growth, the microalgal cells survived under both UV-treated and untreated conditions. As anticipated, microalgae demonstrated better growth in untreated conditions with increased chl-a content from 2.66 ± 0.01 mg L−1 to 13.23 ± 0.02 mg L−1 (p value <0.01). Further, no fluorescent signal was detected up to 96 h with weak intensities thereafter, i.e., around 4.5 ± 1.5 a.u. On the other hand, a constant growth was observed under treated conditions with chl-a content around 8 to 9 mg L−1 during MAPR, with a gradual increase in ROS levels (0 to 27.33 ± 2.62 a.u.). The microalgal growth profile in the test and control setups is represented in Fig. 5d. Overall, the ROS profile and pathogen abundance trends in various test and control setups revealed that microalgae exhibit a crucial role in MAPR. The present findings demonstrated that maximum oxidative stress and complete E. coli removal are achieved in the presence of C. pyrenoidosa and UV irradiation. Thus, the results support the hypothesis that MAPR would likely be more efficient under outdoor conditions with exposure to solar irradiation.
An increased pH (up to 11) during MAPR may have further increased ROS production. Changes in the environmental pH can impact the redox state of the photosynthetic electron transport chain, thereby influencing ROS production46. A significant increase in ROS production (365 ± 15 to 805 ± 70 a.u. fluorescence intensity) was observed with an increase in pH from 7.5 to 9.5 under 84% dissolved oxygen conditions in Neochloris oleoabundans. The increased ROS production was hypothesized as a consequence of the reduction in the activity of pH-dependent antioxidant enzymes. Similarly, ROS production was significantly enhanced in Chattonella marina at a high pH of 9 to 9.5, probably resulting from changes in enzyme activity47. Hence, C. pyrenoidosa-mediated pH increase may have amplified the oxidative stress in MAPR systems at high illumination, thus resulting in rapid pathogen removal.
Singlet oxygen is a crucial ROS for photooxidation in MAPR
Electron paramagnetic resonance (EPR) spectroscopy was employed to identify ROS produced during photooxidation in MAPR. Samples were analyzed with different spin traps to test the presence of singlet oxygen, hydroxyl, and superoxide radicals. EPR spectroscopy revealed the presence of singlet oxygen in the C. pyrenoidosa + E. coli UV-treated setup. MAPR samples with 2,2,6,6-tetramethylpiperidine (TEMP) showed the three characteristic peaks confirming the presence of singlet oxygen during photooxidation in MAPR, as depicted in Supplementary Fig. 2. TEMP undergoes oxidation in the presence of singlet oxygen, resulting in the formation of EPR-active product TEMPO, 2,2,6,6-tetramethyl-4-piperidone-N-oxyl. Along with the peak characteristics (number and position), the calculated g-value was 2.0058, which confirmed the formation of TEMPO, further validating the presence of singlet oxygen48,49. However, the MAPR samples with 5,5-dimethyl-1-pyrroline N-oxide (DMPO) and 5-tertbutoxycarbonyl-5-methyl-1-pyrroline N-oxide (BMPO) spin traps were observed to be EPR silent. The samples for DMPO and BMPO traps, tested at different concentrations of spin traps and varied temperature conditions, were also EPR silent. A literature review was conducted to select specific values for temperature and spin trap concentrations50,51,52. The absence of peaks in the DMPO and BMPO samples may be due to the short half-life of the hydroxyl (1 nsec) and superoxide radicals (1 µsec). A short half-life and high reactivity make the radical unavailable to be trapped by the spin traps, hence rendering it undetected by EPR spectroscopy. On the other hand, singlet oxygen is relatively more stable and has a half-life of 4 µsec, thus being easily detected by EPR spectroscopy53,54. Hence, further optimization regarding spin trap concentrations and EPR conditions is required to detect hydroxyl and superoxide radicals in MAPR samples.
The presence of singlet oxygen validated the CellROX-based fluorimetry results. The analysis confirmed the prevalence of oxidative stress in MAPR coculture systems when exposed to UV irradiation and a 16-h photoperiod. Singlet oxygen is a photosynthesis-associated ROS produced due to the energy transfer between triplet chlorophyll and molecular oxygen. The singlet oxygen is generated at the photosystem II reaction center under high-light conditions. It is highly reactive and interacts with the neighboring macromolecules, modifies nucleic acids, or executes lipid peroxidation. However, the chloroplasts contain many photoprotective pigments like tocopherols and carotenes which quench the singlet oxygen to protect the cells from extreme oxidative damage and cell death55.
There are numerous pathways through which the singlet oxygen might contribute towards the observed pathogen removal. Studies have revealed that ROS can act as a signaling molecule in C. pyrenoidosa for increased exopolysaccharides (EPS) production, thereby facilitating pathogen entrapment. An increase in EPS production was reported for Microcystis aeruginosa upon exposure to UV-B radiation56. The increased EPS was rationalized as an adaptive microalgal response under light-induced stress conditions. The EPS can play a role in microalgal adaptation to UV-B by absorption of UV-B by tryptophan-like substances in EPS or reduce photooxidative damage to microalgal cells by increased shading mediated by EPS-induced cell aggregation56. Similarly, another study demonstrated changes in the expression of EPS genes in response to variations in the light quality and ROS content in the cyanobacterium Nostoc flagelliforme57. Based on the results of differential gene expression analysis, ROS scavenging studies, and hydrogen peroxide treatment, it was observed that EPS production was primarily regulated by intracellular ROS levels rather than direct oxidative stress57. The microalgal EPS can also act as an exogenous photosensitizer, thus resulting in indirect photooxidative damage to the pathogen. In this regard, a recent study demonstrated efficient photolysis of tetracycline by EPS of C. vulgaris during municipal wastewater treatment58. The tetracycline degradation was attributed to the presence of photoactive compounds, including proteins, fulvic acid, and humic acid, in the microalgal EPS. Further, singlet oxygen (produced in the presence of microalgal oxygen) has been known to form hydrogen peroxide precursors and mediate catalase damage in E. coli59.
Extended photoperiods promote pathogen removal
The role of photooxidation as a pathogen removal mechanism in MAPR was initially investigated through UV irradiation studies. Subsequently, the microalgae-mediated E. coli removal was studied under different photoperiods, namely L16:D8, L24:D0, and L0:D24. As predicted, rapid E. coli removal was obtained under L24:D0 followed by L16:D8 conditions, as depicted in Fig. 6. The E. coli removal trend in L16:D8 followed the previously observed patterns, with complete removal around 72 hours17. On the other hand, E. coli continued to survive under L0:D24 conditions, which can be attributed to the lack of microalgal growth during the dark conditions. Being a mixotroph, C. pyrenoidosa survived in high-strength synthetic sewage (SS) under L0:D24 conditions, yet it did not exhibit any increase in growth characteristics such as chl-a content or biomass concentration. Consequently, E. coli decline was also not observed under dark conditions, signifying the role of actively growing microalgae for MAPR. The microalgal growth profile in terms of chl-a and biomass concentration for various photoperiods is represented in Table 1. C. pyrenoidosa demonstrated better survival with a specific growth rate of 0.26 day−1 under optimized conditions of L16:D8. Further, a lower growth rate of 0.24 day−1 was observed under L24:D0, indicating a slightly reduced photosynthetic efficiency, likely due to photoinhibition under an extended photoperiod. However, the rapid E. coli removal compensates for the slight decline in microalgal growth rates under L24:D0 conditions. The present results are antagonistic to the findings reported by ref. 60 where a decline in the removal of E. coli and P. aeruginosa and an increase in E. faecalis removal was reported at L24:D0 as compared to the L16:D8 conditions. The test pathogens were spiked in a combined microalgal-bacterial system comprised of C. vulgaris and activated sludge. The presence of activated sludge might have complicated the microalgal-bacterial interactions, resulting in reduced removal efficiency at L24:D0. Further, the lack of a control setup (microalgae or activated sludge only) at L24:D0 hinders the accurate interpretation of the overall pathogen removal efficiencies.
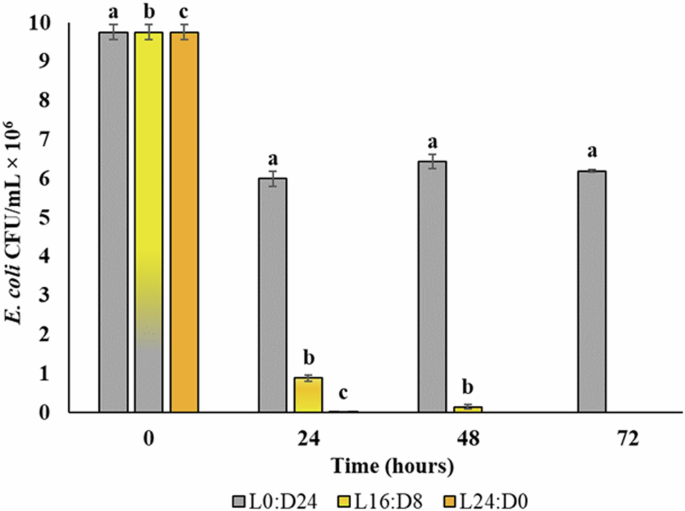
The photoperiods L0:D24, L16:D8, and L24:D0 represent 24 h dark, 16 h light and 8 h dark, and 24 h light, respectively.
The C. pyrenoidosa + E. coli MAPR samples were further analyzed for soluble chemical oxygen demand (sCOD) concentration to infer the presence of EPS under varied photoperiods. The sCOD for L24:D0 samples was compared with that for L16:D8 for 12 days. The sCOD concentration increased from 401 ± 1 mg L−1 (day 0) to 659 ± 1 mg L−1 (day 3) for L24:D0 while sCOD increased to 530 ± 1 mg L−1 (day 3) for L16:D8 setup. The sCOD for L24:D0 samples were around 23–35% higher than that for L16:D8 during the entire batch study. The sCOD values for the L24:D0 setup was 815 ± 1 mg L−1 (day 6), 979.1 ± 0.3 mg L−1 (day 9), and 1048 ± 2 mg L−1 (day 12). Alternatively, the sCOD values for L16:D8 samples were 605 ± 1 mg L−1 (day 6), 795 ± 1 mg L−1 (day 9) and 815 ± 1 mg L−1 (day 12). Overall, the results revealed a high sCOD under L24:D0, indicating the production of EPS under longer photoperiods during MAPR. The increased EPS may facilitate pathogen removal by attachment or entrapment, thereby improving the overall MAPR efficiency, as observed under the L24:D0 regime. Previous studies have also highlighted the increase in microalgal EPS production under high-light conditions. A recent study demonstrated EPS production as an adaptation strategy in endolithic microalgae and cyanobacteria inhabiting the interior of gypsum deposits in the Atacama Desert61. It was ascertained that the UV-absorbing components of EPS might be involved in protecting the microbial communities from excessive solar irradiation in the desert. Likewise, EPS production quadrupled in the desert cyanobacterium Trichormus sp. upon increase in light intensity from 3.2 to 9.6 W m−2 62.
The FTIR spectroscopy was subsequently employed for biochemical characterization of the biomass obtained under L24:D0 vs. L16:D8 conditions. FTIR spectra revealed a high abundance of specific functional groups in the L24:D0 biomass, represented in Table 2. The unprocessed and second derivative spectra of MAPR biomass, depicted in Supplementary Fig. 3, clearly illustrate the presence and absence of functional moieties between the different samples. The FTIR peaks corresponding to hydroxyl, phenol, ester, amine, sulfate, and alkenes were not observed in the L16:D8 MAPR biomass. Additionally, a high abundance of polysaccharides (corresponding to C-O-H and C-O-C) was obtained in L24:D0 biomass. FTIR peaks were also obtained for aromatic rings and phenol groups in L24:D0 MAPR biomass. The presence of sulfate groups within the EPS may mediate pathogen adsorption through electrostatic interactions63. Also, the antimicrobial activity of microalgal sulfated polysaccharides against bacterial, viral, and fungal pathogens is well-reported64,65. The FTIR results indicated the presence of EPS, including sulfate groups and aromatic compounds, in the L24:D0 MAPR biomass. Overall, the FTIR results coincide with the sCOD findings, where an increased EPS production was obtained under the L24:D0 light regime.
The present work represents a pioneering effort in the field of microalgal biotechnology by conducting an in-depth investigation of probable MAPR mechanisms. The findings demonstrated that C. pyrenoidosa-mediated E. coli removal from sewage was primarily governed by microalgae-induced alkalinity and photooxidation. The findings established that metabolically active microalgal cells are a prerequisite for MAPR, as 99.97% E. coli removal was achieved in the presence of actively growing C. pyrenoidosa. The microalgae-mediated increase in pH (up to 11) was identified as a crucial factor governing MAPR. Additionally, the microalgae-enhanced photooxidation was another crucial mechanism as high ROS levels vis-à-vis E. coli removal was obtained in the presence of C. pyrenoidosa, under longer photoperiods or combined visible-ultraviolet irradiation. The increased production of microalgal ECM resulting in enhanced entrapment of E. coli was observed as a consequence of photooxidation. Overall, the present study addressed a critical research gap concerning the pathogen removal mechanisms during microalgae-based wastewater treatment. It provides a roadmap for the development of improved microalgal systems for efficient wastewater treatment. Furthermore, preliminary investigations in the present work indicated competitive microalgae–bacteria interactions. Nonetheless, techniques like stable isotope labeling and secondary ion mass spectrometry (SIMS) are pivotal for single-cell studies to track the carbon dynamics in coculture systems. Further, investigating the microalgal or bacterial exometabolites in the phycosphere can provide valuable insights into the microalgal-bacterial dynamics.
Methods
Microbial cultures and reagents
Chlorella pyrenoidosa (NCIM 2738) and E. coli (MTCC 1687) were selected as the model microalga and representative sewage pathogen, respectively, for MAPR. C. pyrenoidosa has been selected as a model strain due to its robustness and significant pathogen removal ability17. Alternatively, E. coli has been selected as the surrogate pathogen for MAPR as it serves as the standard indicator organism for assessing water quality66. The procurement details, routine cultivation, and maintenance conditions for the microbial strains have been described in previous work17. The growth media, namely BG-11 broth (Cat. No. 1541), Miller Luria Bertani (LB) broth (Cat. No. M1245), and HiCrome™ Chromogenic Coliform (CCA) agar (Cat. No. M1991I), were purchased from Himedia (India). All other chemicals and reagents, including SS components, glutaraldehyde, hydrochloric acid (HCl), sodium hydroxide (NaOH), methanol, and DMPO, were procured from Merck Life Science (India). The CellROX® Green Reagent (Cat. No. C10444) was purchased from Invitrogen (India). The remaining chemicals were obtained from commercial sources.
Pathogenic bacteria removal experiments
Experiments investigating MAPR mechanisms were conducted at previously optimized conditions of 12000 lux (⁓100 W.m−2) illumination, 37 °C temperature, and a 16/8 h light/dark cycle in a fabricated cultivation chamber17. All experiments were conducted in 50 mL high-strength SS with an initial A680 ≈ 0.2 for C. pyrenoidosa and a spiking mean cell density of 106 to 107 colony-forming units per mL (CFU mL−1) for E. coli. MAPR efficiency was estimated in terms of LRV, calculated from CFU mL−1 data, till complete E. coli removal was achieved in the treatment process. E. coli CFU mL−1 was enumerated by dilution plating on LB, as per the pre-defined methodology17. C. pyrenoidosa growth was measured daily in terms of chl-a content and biomass concentration, according to the method outlined by ref. 17.
MAPR setups for mechanistic studies
The MAPR experiments were conducted for each plausible pathogen removal mechanism, namely, microalgae-mediated pH change, pathogen attachment, and microalgae-enhanced photooxidation. Each MAPR experiment consisted of triplicates for each setup i.e., coculture (C. pyrenoidosa and E. coli), microalgal monoculture (C. pyrenoidosa only), bacterial monoculture (E. coli only) and SS only (without any microbial inoculum), in 50 mL high-strength SS.
Presence of live vs. dead microalgae cells
Different experiments were conducted to analyze E. coli removal in the presence of (i) normal or untreated C. pyrenoidosa (live cells), (ii) heat-treated C. pyrenoidosa (dead cells), and (iii) without C. pyrenoidosa (control). E. coli was spiked in all the flasks, and the CFU mL−1 trend was monitored. The C. pyrenoidosa culture was subjected to heat treatment at 80 °C for 2 h to ensure the complete loss of cell viability67.
Effect of microalgae-mediated pH change
The pH experiments were conducted to infer the effect of C. pyrenoidosa-mediated alkalinity increase on E. coli removal from SS. For this purpose, different experimental runs were performed. For the test experiment, denoted as C. pyrenoidosa + E. coli maintained the pH was maintained at 4, 7, 8, 9, 10, and 11. The pH was checked and maintained every 24 h, using 0.2 N HCl and 0.2 N NaOH21. Initially, the pH was checked for each system, followed by the gradual addition of HCl or NaOH to achieve the target pH. pH values were selected based on the previous studies relating to the pH of raw sewage and the pH trends in high-rate algal ponds and photobioreactors11,15,16,21. E. coli was spiked, and the CFU mL−1 trend on CCA agar plates was monitored. The daily monitoring and adjustment of pH in the setup creates a possibility of contamination with other microbes. Hence, a conservative approach was undertaken and a selective growth media such as CCA was employed for accurate E. coli enumeration. The pH was not maintained in the control setups, including (i) C. pyrenoidosa + E. coli unmaintained, (ii) C. pyrenoidosa only, (iii) E. coli only, and (iv) SS only.
Attachment of bacteria onto microalgal cells: primary investigations by microscopic analyses
The possibility of E. coli attachment to C. pyrenoidosa cells was initially investigated by microscopic techniques. Previous SEM findings have revealed the presence of E. coli clumps on the surface of C. pyrenoidosa cells17. SEM imaging was conducted again for the MAPR samples to validate the previous results. Subsequently, TEM was employed to further validate E. coli attachment and investigate the changes in the structure of microalgal cells. For TEM analysis, the harvested samples were initially washed with 3% glutaraldehyde (in 0.1 M phosphate buffer, 7.2 pH) to obtain a media-free sample. This was followed by centrifugation, decanting, and primary fixation in 3% glutaraldehyde at 4 °C for 4 h. The primary-fixated sample was centrifuged, washed with phosphate buffer, and resuspended in buffer. This was followed by secondary fixation, block preparation, ultramicrotomy, and TEM imaging (Thermo Scientific Talos S).
Attachment of bacteria onto microalgal cells: identification of attachment-mediating functional group
ZP analysis and FTIR spectroscopy were employed to identify the functional group involved in the E. coli-C. pyrenoidosa attachment. Sample aliquots were withdrawn at different time intervals from C. pyrenoidosa + E. coli (test), C. pyrenoidosa only (control), and E. coli only (control) for the analysis. The ZP of aliquots was recorded using the electrophoretic light scattering method at 25 °C in the Malvern Zetasizer Nano ZS90 (Malvern, Worcestershire). For FTIR spectroscopy, the harvested biomass was stored at −20 °C for 24 h, followed by freeze-drying (LaboGene CoolSafe 110-4). About 1 mg of the lyophilized sample was then homogenized with potassium bromide and scanned from 400 cm−1 to 4000 cm−1 (TENSOR II Bruker, Massachusetts). The position of the peak and its characteristics (strength: strong, medium or weak, and shape: sharp or broad) were analyzed to identify the functional groups.
Microalgae-enhanced photooxidative damage
A microplate-based fluorimetry assay was employed to estimate the ROS production in different test setups, namely, C. pyrenoidosa + E. coli, C. pyrenoidosa only, and E. coli only. The test setups were exposed to 16 h of visible light followed by 4 h dark and 4 h UV treatment68. The aforesaid setups were replicated and illuminated with 16 h of visible light followed by an 8-h dark period to serve as the control conditions. The UV treatment included exposure to UV-A (Actinic BL TL 8 W 1.6 W.m−2) and UV-B (UV-B Narrowband PLL/PL-S 9 W 1.2 W.m−2). A combination of UV-A and UV-B was employed along with visible light to mimic solar radiation under natural outdoor conditions. Samples were withdrawn from the test and control setups at various time points during the light/dark cycle and UV treatment to measure oxidative stress, growth profile, and E. coli abundance. The ROS were quantified using the CellROX® Green Reagent following the manufacturer’s instructions. The excitation/emission spectra were recorded at 485/520 nm by a microplate reader (BioTek Synergy HTX Multi-Mode Reader).
ROS identification by EPR spectroscopy
EPR spectroscopy was employed to identify the ROS involved in photooxidation during MAPR. Spin traps, namely TEMP (20 mM), DMPO (50 mM, 100 mM), and BMPO (25 mM, 50 mM), were used to validate the formation of singlet oxygen, hydroxyl radicals, and superoxide radicals, respectively69,70. A 30 µL sample was mixed with a 30 µL spin trap, loaded in a quartz capillary tube, and sealed for analysis. The EPR spectra were recorded in a 3350 G magnetic central field for a sweep width of 250 G, 9.41 GHz frequency, and 100 kHz modulation frequency (Bruker BioSpin EMXmicro, Germany). The obtained spectra were analyzed for the number of peaks, peak position, and the g-spectroscopic splitting factor (g-factor) value, calculated using Eq. (1).
where h is Planck’s constant (6.626 × 10⁻³⁴ J.sec), ν is the microwave radiation frequency used in EPR (9.41 GHz), μB is Bohr’s magneton (9.274 × 10⁻²⁴ J T−1), B is the magnetic field strength (in Tesla).
Effect of varied photoperiod
The MAPR experiments conducted at 16/8 h light/dark (L16:D8) cycle were compared to the tests conducted under 24 h light (L24:D0) and 24 h dark (L0:D24) conditions. The analysis aimed to infer the role of light duration in E. coli removal during MAPR. The E. coli removal trend and microalgal growth were analyzed for C. pyrenoidosa + E. coli setup under each photoperiod. Additionally, the sCOD was measured to examine the production of EPS during MAPR. Sample aliquots were harvested at 6900 rpm for 10 min, and COD was then estimated by HACH Reactor Digestion Method 8000 using DR2700 HACH spectrophotometer71. Initially, 2 mL sample was taken in a COD digestion reagent vial followed by gentle mixing and heating at 150 °C for 2 h. After digestion, the vials were inverted for mixing and cooled to room temperature, followed by colorimetric COD determination in DR2700 (Program 435 COD HR). Subsequently, FTIR spectroscopy was employed for biochemical profiling. The FTIR spectra were processed using a second-order derivative in Origin Pro 10.0.5 and analyzed for various functional groups72.
Statistical analysis
All experiments were conducted in triplicates. ANOVA and two-sample t-test were carried out to estimate the statistical significance (p value <0.05) of the results. The results were reported in terms of mean value and standard deviation (mean ± SD) or represented as error bars in graphs.


Responses