Urban growth strategy in Greater Sydney leads to unintended social and environmental challenges
Main
Australian cities and many cities worldwide have grown rapidly in the past five decades, increasing the pressure on environmental and social conditions. While much progress has been made in urban areas in education, life expectancy, poverty levels, personal income and access to water, declining social and environmental indicators present challenges and risks for societies1. For example, population growth in urban areas has increased energy consumption2, waste generation3, loss of green spaces3, housing costs4 and time spent commuting5,6.
Previous research highlights the need to shift urban planning from primarily focusing on economic growth to sustainable development policies with a broader conceptualization of societal well-being7,8,9. For many decades, urban planners have promoted economic growth and infrastructure investment through development plans driving an urban growth agenda10,11. These urban growth policies have negatively impacted the environment12 and people’s quality of life10,13,14 and have failed to achieve the objectives espoused in these urban development plans15. Societal well-being depends not only on economic prosperity but also on the quality of the environment and social capital in our communities16,17. Policymakers and scientists increasingly recognize the need to adopt a broader perspective of societal well-being when developing and evaluating public policies and strategies to advance society18,19.
The social and environmental challenges facing urban policymakers involve interdependencies among social, economic and environmental dimensions of well-being and also interdependencies between urban planning strategies and these dimensions20,21,22. Rather than focusing on the individual parts of the urban system in isolation, continued improvement of societal well-being requires analyzing how the different parts of an urban system interact and how policy action can be coordinated22,23. While there have been advances in understanding how urban growth creates social and environmental challenges10,13,14, we still need to integrate the different parts to understand the overall urban system and operationalize sustainability24,25,26.
This study identifies the urban planning strategies of policymakers in Greater Sydney over time by capturing policymakers’ perceptions of causal relationships at work in the complex urban system. We chose Greater Sydney as a case study due to its worldwide status, well-known quality of life, the rapid urban growth of the area27,28,29 and the social and environmental challenges facing the city. We elicited policymakers’ urban planning strategies from three published governmental urban plans in Greater Sydney between 1968 and 2018, comprising 500 written pages30,31,32. The three reports were all published by the same state government agency, though the agency name changed over time. We coded the text from these reports into causal maps showing policymakers’ perceptions about causal relationships in the urban system. The causal maps are a well-established research method for representing decision-makers’ perceived causal relationships and have been used extensively in urban planning33,34.
Although the urban reports do not explicitly use the phrase ‘societal well-being’, policymakers emphasize a number of indicators that directly relate to societal well-being, including travel time, housing affordability, green areas, pollution, job opportunities, economic prosperity, water availability and heat island effects. Throughout this paper, we discuss the impacts of Greater Sydney’s urban planning strategy on ‘attractiveness of the city to residents’ as a proxy for societal well-being. We adopt the WEALL objective definition of societal well-being as ‘what we need to live well together as a society, now and into the future’16. This definition includes economic, social and environmental quality of life dimensions (see Supplementary Information for additional discussion about our and other definitions of societal well-being). Societal well-being and sustainability represent different constructs. Sustainability is often associated with protecting and maintaining the health of the environment over time. On the other hand, societal well-being is a broader term that refers to the status of economic, social and environmental capitals at any point in time35.
Emphasis on economic and public infrastructure growth
Our analysis of the 1968, 2005 and 2018 urban plans shows that policymakers adopted a dominant urban planning strategy for the past 50 years in Greater Sydney to grow economic prosperity and public infrastructure. In the 1968 urban plan, policymakers’ emphasized the importance of ‘strong industrial growth fundamental to Sydney’s expansion’30 to guarantee full employment. The 2005 plan established an urban development strategy over 25 years, between 2005 and 2030, ‘to secure Sydney’s place in the global economy by promoting and managing growth’31. The 2018 plan outlined initiatives ‘to maximize economic growth and cater for population growth’32. Prioritizing and pursuing economic and public infrastructure growth defined the dominant urban development strategy for Greater Sydney since 1968 (see Supplementary Information for some description about the context in which each report was written).
Figure 1 shows the dominant growth strategy underpinning the 1968, 2005 and 2018 urban development plans. The causal relationships highlight the principal mechanisms policymakers adopted to promote growth in the economy and public infrastructure to make Greater Sydney more attractive to business firms and residents over time. The ‘economic opportunities’ loop (labeled R1) in the center of the causal map shows policymakers’ perceptions about the benefits of economic growth. As the city becomes more attractive to firms, more new business firms startup or move into the city, increasing the number of business firms and leading to greater economic opportunities and prosperity. Increasing economic opportunities and prosperity create more jobs, which in turn increases the attractiveness of the city to (current and potential future) residents and results in a higher population growth rate. As the Greater Sydney population increases, the demand for commercial goods and services also increases, making the city even more attractive to firms. These causal relationships form a reinforcing feedback loop, whereby an initial change compounds in the same direction with each cycle around the loop. Quotations from the planning reports were used to ground and support each of the causal relationships in the ‘economic opportunities’ feedback loop. For example, the 2005 report stated, ‘The economic strength and quality of life of Sydney mean more people are attracted to live in this city. While two-thirds of the net population growth derives from natural increase (more births than deaths), the city is also a magnet for migrants from elsewhere in Australia and overseas seeking economic and life opportunities’31.

This causal map shows the principal strategy themes policymakers adopted in the 1968, 2005 and 2018 urban development plans to promote growth in the economy and public infrastructure and improve the attractiveness of the city to people and business firms. The arrows indicate the direction of causality. The signs at arrowheads (‘+’ or ‘−’) indicate the polarity of the relationship. A ‘+’ sign denotes that an increase in the independent variable causes the dependent variable to rise above what it would have been, ceteris paribus (and a decrease causes a decrease). A ‘−’ denotes that an increase in the independent variable causes the dependent variable to decrease beyond what it would have been. Formally, ‘+’ is defined as X → +Y ⇔ ∂Y/∂X > 0, and ‘−’ is defined as X → −Y ⇔ ∂Y/∂X < 0. The loop label ‘R’ indicates reinforcing (positive) feedback49. The rectangles represent stocks, and the arrows with valves represent flows. Formally, the Greater Sydney population (GSP) is represented as ({{mathrm{GSP}}}_{(t)}={{mathrm{GSP}}}_{({t}_{0})}+{int }_{{t}_{0}}^{t}[{mathrm{population}}; {mathrm{growth}}; {mathrm{rate}}]{{mathrm{d}}t}).
An increase in economic opportunities and prosperity also improves the attractiveness of the city to even more business firms and leads to even further growth in the number of business firms locating in the city. On the right-hand side of Fig. 1, these causal relationships close the ‘attracting business firms’ reinforcing loop (R2). Another quote from the 2005 urban plan illustrates the grounding for the causal relationship between number of business firms and economic opportunities and prosperity, ‘a key driver for economic and employment growth is the successful startup and establishment of small businesses’31.
The left side of Fig. 1 shows policymakers’ perceptions about the benefits of public infrastructure growth. As the population of Greater Sydney grows, the demand for more public city services and facilities increases. In response, the government increases public investment to expand the infrastructure for city services and facilities, including expansion and improvements in the public transport network, health facilities, the education system and the utilities network. The intent is for increasing public investment to provide city services and facilities that the growing population needs in close proximity to where residents live, making the city more attractive to residents and leading to even further population growth. These causal relationships close the public services and infrastructure reinforcing loop (R3). Policymakers stated in the 1968 urban report ‘…to ensure that the scale of public investment in expanding public utilities, communications, and social services is adequate to meet the needs of economic growth and a living environment of high quality’30 and in the 2018 urban report that ‘…infrastructure will be sequenced to support growth and delivered concurrently with new homes and jobs’32.
Importantly, few city governments invest to keep ahead of population growth, and there can be very long-time delays in perceiving the need to invest, allocating resources to fund such investments, getting approvals to expand infrastructure in specific locations and constructing buildings, utilities, subway lines or light rail once construction begins. In a growing city, these time delays often result in demand for infrastructure growing much more rapidly than supply.
These three reinforcing loops capture policymakers’ dominant strategy to pursue economic and public infrastructure growth for Greater Sydney over the past five decades (see Supplementary Information for more evidence of the perceived causal relationships that compose these reinforcing loops and the overall urban growth strategy). In the absence of other feedback effects and without considering other indicators of progress, this boundedly rational strategy would lead to a growing, vibrant city. However, there have been numerous social and environmental challenges that stem, at least partly, from this urban growth strategy that have somewhat diminished Greater Sydney’s societal well-being. Policymakers did not recognize these social and environmental impacts as unintended consequences of the urban growth strategy. Instead, at different points in time, policymakers highlighted these issues as challenges to overcome in the urban development planning process.
Socioenvironmental consequences of urban growth strategies
Figures 2–4 show the social and environmental consequences of the strategy to pursue economic and public infrastructure growth over a long time period. The impacts of these consequences emerged as challenges or problems in our analysis of the 1968, 2005 and 2018 urban development reports. We present these challenges sequentially, focusing on the new causal pathways that emerge from one urban report to another. This enables examination of how policymakers’ perceptions evolved over time.
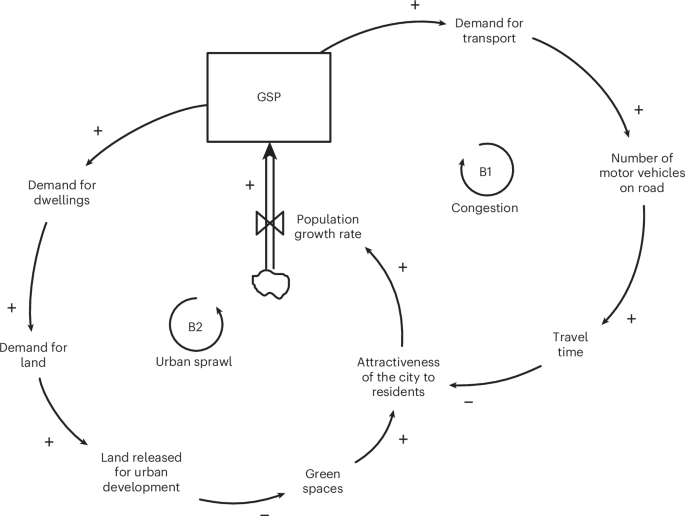
The label ‘B’ indicates negative (balancing) feedback. GSP, Greater Sydney population.

Top: an increase in the number of business firms also increases the number of motor vehicles on the road and, therefore, the pollution level. Also, the two loops in Fig. 2 were also understood in the 2005 urban plan, but for clarity, we do not show those same causal relationships here. Instead, we only included new causal relationships and feedback loops identified in the 2005 report (see Supplementary Information for quotes from the 2005 urban plan grounding the causal relationships in Fig. 2 and here). GSP, Greater Sydney population; CBD, central business district.

Top: an increase in the number of business firms also increases the waste generation and consumption of energy. Also, the two loops in Fig. 2 and the three loops in Fig. 3 were also understood in the 2018 urban plan. For clarity, we do not show those same causal relationships here. Instead, we only included new causal relationships and feedback loops identified in the 2018 report (see Supplementary Information for quotes from the 2018 urban plan grounding the causal relationships in Figs. 2–4). GSP, Greater Sydney population.
Figure 2 illustrates the ‘social congestion’ loop (B1) and the ‘environmental urban sprawl’ loop (B2) from the 1968 urban plan. In the ‘congestion’ loop, as attractiveness of the city to residents increases (because of growing economic opportunities and prosperity and increasing city services and facilities), the population growth rate increases, the Greater Sydney population increases and the demand for transport rises. This leads to an increase in the number of motor vehicles on the road and the average travel time within the city. Increasing average travel time reduces the attractiveness of the city to residents relative to what it would have been if all conditions had remained the same. These causal relationships close the ‘congestion’ balancing loop (B1). In the 1968 urban plan, policymakers recognized that population growth led to an increase in the number of motor vehicles: ‘…notwithstanding a substantial population increase, there has been a decline in the use of public transport and at the same time a growth in motor vehicle registrations’30.
The ‘urban sprawl’ loop (B2) shows that as attractiveness of the city to residents increases, the population growth rate increases, the Greater Sydney population increases, and the demand for dwellings and land increases, which increases the land released for urban development. As more land gets designated for housing development, fewer green spaces (that is, undeveloped bush or forest areas) reduce the attractiveness of the city to residents relative to what it would have been if all conditions had remained the same. These causal relationships close the ‘urban sprawl’ balancing loop (B2). In the 1968 urban plan, policymakers anticipated that population growth would increase demand for land, as ‘Sydney’s expected population growth of about 2,750,000 will require the zoning of an additional 250,000 acres’30.
Analysis of the 2005 plan identifies four additional social and environmental challenges, shown in Fig. 3, that emerged by adhering to the dominant growth strategy. In the ‘pollution’ loop, as attractiveness of the city to residents increases, the population growth rate increases, the Greater Sydney population increases, the demand for transport rises and the number of motor vehicles on the road rises. The increasing number of motor vehicles on the road increases pollution and waste, decreasing the attractiveness of the city to residents relative to what it would have been if all conditions had remained the same. These causal relationships close the ‘pollution’ balancing loop (B3). Policymakers were concerned in the 2005 urban plan that ‘…there is increasing awareness of the health impacts of air pollutants and noise emissions from transport’31.
The ‘too expensive to live’ balancing loop (B4) shows that increasing attractiveness of the city to residents increases the population growth rate and, therefore, increases the Greater Sydney population. The growing population increases the demand for dwellings, which erodes housing affordability due to increasing housing prices and rents. Declining housing affordability (that is, rising house prices and rent) reduces the attractiveness of the city to residents relative to what it would have been if all conditions had remained the same. These relationships close the ‘too expensive to live’ balancing loop (B4). In the 2005 urban plan, policymakers recognized that the growth of the city was leading to increased pressure on housing supply: ‘…as the city has grown, so too has pressure on roads, on housing supply and on infrastructure and services’31.
Decreasing housing affordability, in and close to the central business district in the city center, also pushes some residents to move to housing further from the center and, thereby, increasing the average distance from the central business district to access affordable housing. Greater distance increases the average travel time to and from work and reduces the attractiveness of the city to residents relative to what it would have been if all conditions had remained the same. These causal relationships close the ‘far from work’ balancing loop (B5). The 2005 urban plan highlighted declining housing affordability as an important problem for Greater Sydney and suggested boosting public investment to increase the number of dwellings. However, as shown in loop B2 of Fig. 2, building additional housing to supply the demand for dwellings requires developing additional land, resulting ‘in continual clearing and fragmentation of native vegetation and habitats in Sydney’31, increasing ‘the demand on infrastructure and services across the region’32, and increasing the urban footprint of the city.
As shown in Fig. 4, analysis of the 2018 plan identifies a further five social and environmental challenges. In the ‘waste’ balancing loop (B6), as attractiveness of the city to residents increases, the population growth rate increases and the Greater Sydney population increases, leading to more waste generation in the city. As waste generation in Greater Sydney increases, the pollution level increases, reducing attractiveness of the city to residents relative to what it would have been if all conditions had remained the same. Policymakers recognized that ‘Greater Sydney currently consumes energy and water resources and creates waste well beyond what can be managed within its boundaries’32 and that ‘Greater Sydney faces challenges providing and managing waste services as the population grows’32.
The ‘heating the city’ loop (B7) shows that as attractiveness of the city to residents increases, the population growth rate increases, the Greater Sydney population increases and the demand for dwellings increases. As a result, the demand for land rises, the land released for urban development increases and the amount of undeveloped green spaces (that is, open spaces and bushland) decreases throughout the city and surrounding areas. Less green space leads to intensifying the heat island effects throughout the city and decreases the attractiveness of the city to residents relative to what it would have been if all conditions had remained the same. These relationships close the ‘heating the city’ balancing loop (B7). Policymakers highlighted in the 2018 urban report that ‘…heatwaves and extreme heat have a significant impact on human health’32 and that ‘…extreme heat makes it less attractive for people to walk and cycle and spend time outdoors’32.
In addition, as attractiveness of the city to residents increases, the population growth rate increases, and the Greater Sydney population increases and leads to increasing consumption of energy and increasing consumption of fossil fuels (for example, electricity generation to power homes and office buildings). Increasing the consumption of fossil fuels increases the pollution level, reducing the attractiveness of the city to residents relative to what it would have been if all conditions had remained the same. These relationships close the ‘pollution from energy use’ balancing loop (B8). Policymakers estimated in the 2018 urban plan that ‘…the combined emissions from electricity and gas used in buildings, transport and waste in Greater Sydney contributed 50 million tonnes of greenhouse gases into the atmosphere’32.
Higher levels of pollution also increase the probability and frequency of climate events, such as heat island effects (and also other climate events not displayed in Fig. 4, such as floods and bushfires), reducing the attractiveness of the city to residents relative to what it would have been if all conditions had remained the same. These relationships close the ‘climate hazard’ balancing loop (B9). Policymakers noted in the 2018 urban report that ‘urban hazards such as air pollution, noise and soil contamination need to be managed to protect the region’s liveability and sustainability’32.
Finally, as attractiveness of the city to residents increases, the population growth rate increases and the Greater Sydney population increases and leads to increasing consumption of water. Higher water demand and usage reduces the amount of reliable and affordable water supply in dams and reservoirs for the city. When water supply levels fall enough, water usage restrictions become active and reduce the attractiveness of the city to residents relative to what it would have been if all conditions had remained the same. Policymakers projected in the 2018 plan that ‘…population growth, drought, climate change and changing community expectations present challenges and can increase demand for water’32. These relationships close the ‘water supply’ balancing loop (B10).
Table 1 lists the feedback loops identified in Figs. 1–4 categorized as part of (1) the dominant urban growth strategy, (2) a social consequence of the urban growth strategy or (3) an environmental consequence of the urban growth strategy. Policymakers highlighted these social and environmental impacts in the city as challenges to overcome in the urban planning process but did not recognize them as unintended consequences of their urban growth strategy. The dominant urban growth strategy consists of three reinforcing loops. Three balancing feedback loops represent the social challenges, and seven balancing loops capture the environmental challenges. Figure 5 shows the full set of causal relationships combined from Figs. 1–4. It is important to note that much urban development happens independently of the formal planning processes and that the urban plans published as part of institutionalized planning processes often do not come to fruition15. As such, the causal relationships shown in Fig. 5 do not include elements from overarching sociocultural change, sociotechnical innovation and other areas outside of the formal policymakers’ remit, unless these elements feature in one or more of the formal urban planning reports. In addition, the content of the urban planning reports, including the overall strategy themes described in each report, reflects the collective knowledge and discourse of Greater Sydney planners involved in developing each report. This knowledge was not held within one person or shared as a consensus mental model across the urban planning team, but instead, each planner involved probably held a partial mental model of the urban planning system.

All three reinforcing loops and ten balancing loops identified in the Greater Sydney Urban Plans of 1968, 2005 and 2018 presented in Figs. 1–4 are combined here. GSP, Greater Sydney population; CBD, central business district.
Discussion
This research finds that policymakers in Greater Sydney adopted a dominant urban development strategy promoting economic, population and public infrastructure growth that has successfully achieved the growth aspirations. However, this urban growth strategy has also compromised societal well-being by leading to numerous negative social and environmental consequences over the past 50 years. These consequences emerged as unintentional outcomes stemming from early urban planning and natural urban development. Urban policymakers—once they recognized the seriousness of these problems—sought ways to address and mitigate these challenges. However, we find no evidence that policymakers either identified these challenges as unintended consequences of their urban growth strategy or attempted to fundamentally change the strategy to address these issues. Instead, the Greater Sydney growth strategy has changed little during the past 50 years. The mental models about the virtues of continuously pursuing growth are strongly held in many modern societies, including among urban planners and policymakers. Our findings provide evidence of the formal urban planning process as serving to perpetuate this growth mental model9,10,11.
Our study also demonstrates how policymakers’ perceptions about causal relationships in the urban system can be explicitly represented through causal mapping. The Greater Sydney causal maps reveal the interconnections among urban policies and strategies discussed separately in literature12,13,14,36 and among the societal well-being dimensions and highlight the importance of shifting from primarily pursuing economic growth to urban strategies emphasizing sustainable development with a broader conceptualization of societal well-being7. These causal relationships may be generalizable to other cities that focused on economic and infrastructure growth for many decades and are now dealing with social and environmental challenges.
Unintended impacts on social and environmental dimensions
The social consequences of the Greater Sydney urban growth strategy contribute to our understanding about the impact of population growth on housing affordability37; the impact of urban area size on housing affordability because of the concentration of high-income and high housing costs38; the socioeconomic implications of congestion based on the area of a city, population size and planning39; urban transport challenges facing transportation network companies40; and urban planning and commuting time5,6. Our findings integrate these different social aspects of well-being that are typically examined piecemeal.
The environmental consequences of the Greater Sydney urban growth strategy include declining undeveloped green spaces and bushlands, increasing energy consumption, more frequent and intense climate events (for example, heat island events, bushfires and floods)41, decreasing water storage and supply42 and rising pollution and waste levels43. Our analysis shows the interconnections among economic growth, environmental degradation and societal well-being44, the loss of natural areas in the city due to urban expansion45, the loss of food production near the city as a consequence of urban growth27, water stress42, the impact of vehicle emissions on pollution levels in urban areas46 and climate policies and urban planning26,47. Importantly, the results show that continuing to pursue the dominant urban growth strategy negatively impacts the livability and sustainability of Greater Sydney for future generations.
Policymakers did not intend to contribute to these negative social and environmental consequences, but misperceptions about the feedback structure of the system48 enabled these urban challenges to become larger and more pressing over time11. Policymakers became increasingly aware of these social and environmental problems but, nevertheless, continued prioritizing and pursuing growth in the economy and public infrastructure. Even though the urban plans discussed the causal relationships linking this urban growth strategy to creating more social and environmental pressures, policymakers did not expand their mental models to recognize the social and environmental problems as consequences (at least partially) of the strategy.
Evolution of policymakers’ perceptions
The causal maps from the 1968, 2005 and 2018 urban development plans show similarities in aims, variables and causal relationships. In all three reports, the focus on growth aims to make the city attractive to current and prospective residents and business firms and to prosper economically. In all three reports, policymakers were aware of some social and environmental challenges. As the environmental and social challenges emerge over time in policymakers’ discourse, these differences also appear in the causal maps.
This sequential appearance and evolution of policymakers’ perceptions about social and environmental challenges captured in the causal maps bears attention. In the 1968 plan, policymakers’ primary social concern was the concentration of activities and population and how to reduce congestion in the Business Commercial Center of Sydney. In 2005 and 2018, policymakers’ were mainly concerned about decreasing housing affordability, increasing commuting time and the need to distribute jobs and services throughout Greater Sydney to reduce traffic congestion in the city center. The results show a similar pattern for environmental challenges. In the 1968 plan, policymakers were concerned primarily with land use and local spaces to grow. In the 2005 plan, the key concerns were air and noise pollution levels from traffic congestion. In the 2018 urban plan, the key concern was the consumption of natural resources (that is, energy and water), increasing waste generation, loss of green areas, the need for more renewable energy and increasing pollution (that is, water, air and noise) and climate hazards, such as heat island effects and floods.
Methods
Data collection
We use written archival data to capture, analyze and compare policymakers’ perceptions about the causal relationships operating in the complex urban system of Greater Sydney. Written archival data were collected from governmental urban plans. The written documents are rich information sources for identifying policymakers’ perceptions about causal relationships using text coding analysis and developing causal map diagrams49,50,51,52. Policymakers generate written documents periodically to communicate perceptions about cause–effect relationships, policies and strategies to apply in the immediate or upcoming future53,54. Written data are more widely available than verbal interview data and provide ‘a recording of information from the mental store’ that ‘contains concepts and abstractions that interpret other information sources’53. Each urban development plan offers rich information about how policymakers understand and think about urban areas. We chose Greater Sydney as a case study because it is recognized for having a high quality of life (www.eiu.com/n/campaigns/global-liveability-index-2023/), participates in multiple sustainability networks of global cities (www.c40.org/cities/sydney), develops many sustainability initiatives (www.arcadis.com/en-au/knowledge-hub/perspectives/global/sustainable-cities-index) and leads in introducing numerous urban development innovations (www.innovation-cities.com/worlds-most-innovative-cities-2022-2023-city-rankings/26453/). However, similar to many other cities around the world, rapid urban growth in Greater Sydney over the past five decades has negatively impacted food production27, urban heat stress28, cost of living (ipsos.com/en-au/lifeinsydney), housing affordability29, traffic congestion (https://www.bitre.gov.au) and other social and environmental indicators.
We elicited policymakers urban planning strategies from 500 pages of three published governmental urban plans in Greater Sydney between 1968 and 2018: (1) Sydney Region: Outline Plan, 1970–2000 AD—A Strategy for Development30 published by the New South Wales (NSW) State Planning Authority, (2) City of Cities. A Plan for Sydney’s Future31 published by the NSW Department of Planning and (3) A Metropolis of Three Cities—Connecting People32 published by Greater Sydney Commission, an independent organization funded by the NSW state government, which later merged with the NSW Department of Planning, Housing and Infrastructure. All of these agencies were essentially the same organization under different names. The NSW Department of Planning, Housing and Infrastructure and its predecessor agencies were in charge of producing and publishing the urban reports in 1988 (NSW Department of Planning), 1995 (NSW Department of Planning), 1998 (NSW Department of Urban Affairs and Planning), 2010 (NSW Department of Planning) and 2014 (NSW Department of Planning and Infrastructure). Having the same Government agency in charge of planning Greater Sydney enables examination of how policymakers’ perceptions evolved over time.
We started with the 1968 urban plan because the previous plan, the County of Cumberland plan in 1948, was published by a different government agency using a different method to define the boundaries and population of Greater Sydney. The 2018 report represented the latest urban plan published when the research project began, so we chose the most recent report as the end date. Between 1968 and 2018, the Department of Planning, Housing and Infrastructure and its predecessor agencies published six urban plans in 1988, 1995, 1998, 2005, 2010 and 2014. The urban plans published in 1995 and 1998 both focused primarily on preparing the city to host the Olympic Games in 2000, so these two plans were very similar to each other and we thought of them as one combined urban plan. We selected the 2005 urban plan for our analysis because it served as the halfway point between the 1968 and 2018 urban plans in terms of the number of urban plans published.
Text coding and causal mapping
We use a systematic and iterative coding process to convert text data into causal map diagrams to analyze each urban development plan by capturing policymakers’ perceptions about causal relationships. Causal maps focus researchers’ attention on eliciting the causal structure of the information feedback system of interest55. Agents operating in a system have a great deal of knowledge about the system, and eliciting their perceptions about causal relationships helps explain how the system operates49,52,55,56.
We use a coding process adapted from Kim and Andersen51 and Eker and Zimmermann57. The Kim and Andersen51 coding process includes (1) discovering themes in the data, (2) identifying variables and their causal relationships, (3) transforming text into words-and-arrow diagrams, (4) generalizing structural representations and (5) linking maps to the data source. The Eker and Zimmermann57 coding process includes (1) identifying concepts and discovering themes in the data, (2) categorizing and aggregating themes into variables, (3) identifying causal relationships between aggregated variables and (4) transforming the coding dictionary into causal diagrams. We adapted steps 1 and 2 from Kim and Andersen51 and Eker and Zimmermann57 into a single step to identify the aggregated variables directly from the data and implement Eker and Zimmermann57 and steps 3 and 4 to identify and record the causal relationships between aggregated variables and develop the causal map. This iterative coding process increases reliability by constantly reviewing the raw data as the analysis advances. Checking the raw data at each step reduces the likelihood of omitting important information and allows evaluation of the relevance of each quotation extracted from the text of the urban planning reports. The iterative process also helps define the system boundary by selecting relevant causal arguments51. The coding process identifies variables and causal relationships between variables58 and enables mapping the relationships using causal maps50.
Each causal relationship is recorded following the procedure proposed by Kim and Andersen51 and Eker and Zimmermann57 and using computer-aided qualitative data analysis software. Each causal relationship is supported by at least one quotation extracted from the urban reports51,59. The causal relationships are used to develop the causal map58,60, revealing the causal perceptions of policymakers’ embedded in each urban report61. Sentences and paragraphs in each report are analyzed to identify the causal relationships between variables51,54,62. We use sentences as the minimum unit of analysis to identify variables and causal beliefs. After coding the first urban report, we used the variables identified from that report as the starting point for coding subsequent reports. The variables displayed in Figs. 1–5 represent aggregate variables to improve readability. For instance, population growth rate serves as an aggregate variable to represent births, deaths, immigration rate and emigration rate. The number of city services and facilities, as shown in Fig. 1, aggregates different types of service and facility discussed in each report. Similarly, pollution level is an aggregate variable to represent water, noise and air pollution.
Whenever possible, we maintained the variable names as they appeared in the urban reports. However, in some instances, we revised variable names using more operational terminology49 to improve the clarity and logic of the causal maps. Once we identified the variables, we next identified the causal relationships among the variables. We use keywords in the raw text data, such as boost, improve, decrease, rise and increase, to identify and define causal relationships between two variables. In the absence of keywords, the context of the discussion is crucial to identify relationships between variables63.
We build the causal map using the variables and causal relationships identified from coding the text. The raw data grounding each causal relationship identified between two variables is recorded using a computer-aided qualitative data analysis software57,58. Importantly, each relationship comes from separate fragments of text within each urban report rather than the analysis of a continuous paragraph. In addition, the causal relationships included in the causal diagrams do not contain a full picture of Greater Sydney´s urban development. Areas outside the formal policymakers’ remit, such as overarching sociocultural change and sociotechnical innovation, are also not included in our analysis unless these elements are featured in one or more formal urban planning reports. In addition, we have omitted some of the ‘supply’ constructs in the causal diagrams discussed in the urban planning reports, such as housing supply, transport infrastructure capacity, water supply, supply of land and the supply of other public infrastructure to keep the causal diagrams as parsimonious as possible.
The feedback loops result from combining causal relationships coded from different text fragments found throughout the reports. Thus, the feedback loop structure of each report did not emerge directly from one or more consecutive text paragraphs but instead from linking multiple causal relationships identified at different points throughout the reports. The resulting causal maps reveal cause–effect chains contained within the text, including a number of reinforcing and balancing feedback loops. A reinforcing loop amplifies the dynamic behavior in the system. A balancing loop produces goal-seeking, self-correcting dynamic behavior. To identify the social and environmental challenges, we focused on the deleterious causal relationships between variables identified in the text (see Supplementary Information for more details).
To follow the causal logic in a feedback loop, we must read each relationship between two variables independently. For example, the causal relationship between demand for dwellings and housing affordability is a negative polarity causal link. The causal relationship between housing affordability and attractiveness of the city to people is a positive polarity causal link. If the demand for dwellings goes up, housing affordability goes down, all other things being equal. The ‘−’ sign polarity between these two variables indicates these variables move in the opposite direction. To continue with the causal logic, we move to the next set of two variables. As housing affordability goes down, attractiveness of the city to people goes down, all other things being equal. The ‘+’ sign polarity between these variables indicates these two variables move in the same direction. In other words, if housing affordability goes up, attractiveness of the city to people goes up. If housing affordability goes down, attractiveness of the city to people goes down.
The combined set of causal relationships identified in each urban report resulted in a highly complex map. In coding the text for the 1968 urban plan, which was 112 pages in length, we initially identified a total of 38 variables and 85 relationships, with 71 positive causal link polarity relationships and 14 negative causal link polarity relationships. In coding the 2005 urban plan, which was 280 pages in length, we initially identified a total of 41 variables and 96 relationships, with 80 positive causal link polarity relationships and 16 negative causal link polarity relationships. In coding the 2018 urban plan, which was 194 pages in length, we initially identified 56 variables and 167 relationships, with 131 positive causal link polarity relationships and 36 negative causal link polarity relationships. We subsequently simplified the causal maps by focusing on policymakers’ perceived causal relationships underpinning urban strategy themes and also focusing on the perceived causal relationships for the social and environmental challenges policymakers identified in each reports.
Limitations
Our study has several limitations. Due to the length of the urban reports, only three reports were analyzed. Across all three urban planning reports, over 500 pages of written text were examined to capture policymakers’ perceptions about causal relationships. However, the analysis of more data from additional urban planning reports could be useful to understand more subtle changes in urban development strategy over time. Another limitation involves the coding procedure and analysis being conducted by a single coder because of the labor-intensive and time-consuming process. However, the results were discussed among several researchers multiple times to reduce this potential bias. In addition, the procedure implemented to analyze the urban plans opens the code for explicit review.
Another limitation is that this study includes only urban development plans by the Greater Cities Commission and its predecessor agencies. Although the urban development plans were discussed with different stakeholders, this study did not include other urban area stakeholders such as businesses, inhabitants, nongovernmental organizations or other public institutions. Including the perceptions about causal relationships of other stakeholders would potentially increase the understanding of how urban planning strategies shape societal well-being over time and represents a potential path for future research.
Reporting summary
Further information on research design is available in the Nature Portfolio Reporting Summary linked to this article.
Responses