Urban inequality, the housing crisis and deteriorating water access in US cities
Main
The global financial crash of 2008 is widely recognized as a major crisis and catalyst for structural reorganization and capital accumulation in the US housing sector1,2,3,4,5. Foreclosure signs, untidy lawns and eviction notices were familiar sights in many US cities as residents faced a post-crisis housing landscape replete with new rules, regulations and corporate landlords5,6. A few years after the crash, US cities experienced a growing ‘housing crisis’ as the surge in housing expenses relative to stagnant wages and income made urban housing unaffordable, leading to rising levels of homelessness and instability for low-income owners and renters7,8,9.
The housing financial crisis is rarely—if ever—recognized as a water crisis for urban dwellers in the United States, despite growing evidence that water poverty, insecurity and unaffordability are flourishing in high-income countries10,11,12,13,14,15,16,17,18,19,20,21,22,23. To close this gap, this Article identifies key trends in the changing nature of urban inequality as it relates to the social reproduction of US households through the lens of water access. Presenting a longitudinal analysis of household access to running water at this scale, we analyze trends in ‘plumbing poverty’—measured here as households without piped running water, using census microdata—in the 50 largest US cities before and after the 2008 crisis, a pivotal moment in the economic restructuring of US housing. Drawing on theories of urban economic geography and social reproduction, we advance research at the housing–water nexus by identifying a key mechanism in the urbanization of US water poverty since the 1970s—what we call the ‘reproductive squeeze’.
We define the ‘reproductive squeeze’ as systemic and compounding pressures on household social reproduction, including the collective weight of unaffordable housing, increased utility and consumer debt, stagnant wages and similar pressures that affect the ability of people to live and work24,25,26,27,28,29. By social reproduction, we refer to the capacities of people to reproduce themselves on a daily and societal basis, often supported by unwaged labor or state-supported social infrastructures, such as municipal water systems and provision25,26,27,28,29. In this Article, we track the unequal geographies of the reproductive squeeze through the lens of water access—an infrastructural lifeline for households to survive and thrive. Alarmingly, our evidence shows that conditions of ‘plumbing poverty’—a lack of household access to running water10—have concentrated in cities since the 1990s and expanded to more US cities since the 2008 crisis, especially for households of color. Indeed, our analysis finds that plumbing poverty has expanded from ‘coastal elite’ cities—such as Los Angeles, New York City and San Francisco—to a more diverse typology of US cities now experiencing more severe housing crises, including Austin, Birmingham, Houston and Portland (Oregon). Notably, these trends are profoundly racialized: we show that people of color represent most individuals without access to running water at disproportionate levels in 12 of the 15 largest US cities, including Los Angeles (82%), Miami (79%), San Francisco (74%) and Houston (71%). Furthermore, we find that water access worsened for people of color between 2000 and 2021, even in cities with healthy economies and population growth. We probe the case of Portland (Oregon)—the whitest large city in the United States—to illustrate the racialized nature of the reproductive squeeze under a housing crisis.
Together, the findings here establish a key driving force at work: the cost-of-living crisis and lack of safe, affordable housing in US cities has forced more households—especially households of color—into conditions of plumbing poverty. Put differently, we argue that socioeconomic pressures seeded by 2008-era changes in the political economy of housing have ‘squeezed’ urban low-income households, forcing people to downgrade their living arrangements to housing without running water. We argue that the reproductive squeeze—and its pernicious effects on human life—is racialized and expanding in scope and severity to a broader array of US cities, showing few signs of slackening or abating.
Results
The urbanization of water poverty
Over the twentieth century, the story of water access inequality in the United States has morphed from a predominantly rural to a majority urban problem—a process we call the urbanization of water poverty. Nationwide, the United States has made great strides in improving water and sewerage access since the 1970s, when 3.5 million households lacked indoor running water and a flush toilet. Still, in 2021, more than half a million US households (1,100,000 people) lacked running water in their homes, a population equivalent to Austin, Texas (the tenth-largest city in the United States). Today, more than seven in ten US households without running water are in cities (71.7%), including major urban areas along the West Coast, Eastern seaboard and Sunbelt regions (Fig. 1). Clearly, while rural areas continue to suffer from exclusion and racial disparities in access to municipal drinking water systems30,31, the nature and character of plumbing poverty in the United States is decidedly urban.

Cities with notable concentrations are listed by name. Source data: US Census Bureau.
Source data
When did the urbanization of plumbing poverty gain traction? Across the United States, we identified a clear shift in the demographic composition of plumbing poverty—measured as households without access to running water (Methods)—from majority rural to majority urban beginning in 1990, a shift we call the ‘urban pivot’ (Fig. 2a). During the 1970s and 1980s, the percentage of households without running water started to rise in urban areas, but the process accelerated >50% in the decades after the pivot (Fig. 2a).
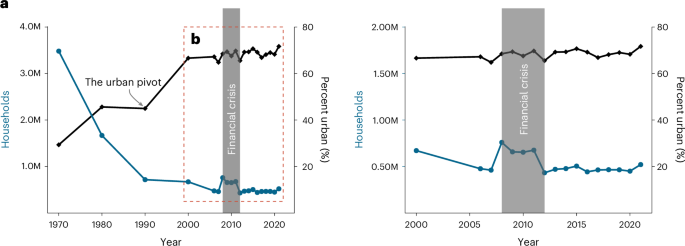
a,b, Dual-axis line plots show (1) an overall decline in the total number of US households without running water (blue) and (2) an increase in the urban share of all US households (black) without running water relative to the nationwide total during 1970–2021 (a) and 2000–2021 (b). The ‘urban pivot’ marks a shift in the share of plumbing poverty to >50% in urban areas. The grey box marks the immediate period of housing instability and foreclosures following the 2008 financial crisis. Source data: US Census Bureau.
Source data
Plumbing poverty rapidly urbanized between 1990 and 2000 as the urban share jumped from 45% to 66.6% in just ten years (Fig. 2a). During this period, plumbing poverty increased by 124,000 households in urban areas (323,000 to 447,000, a 38.4% increase) and decreased by 171,000 households in rural areas (395,000 to 224,000, a 43.3% decrease). Plumbing poverty’s urban pivot coincided with a nationwide expansion of home mortgage lending—fueled by cheap loans and financialized assets—and a concentration of housing wealth3,4,6,32. In 1990, 59,031,378 US residents (64.2%) owned their own home. By 2000, the number of US homeowners increased by roughly 10 million people to 69,815,753 (66.2%), an increase of 18.3% in ten years. As US cities grew vis-à-vis ownership and speculation in the housing market, affordable housing options—in terms of renting or owning—for low-income residents began to evaporate3,4,6,32.
A closer examination of the 2000–2021 period revealed that swings in plumbing poverty corresponded with major shocks in housing affordability, particularly for low-income, asset-limited households (Fig. 2b). The global financial crisis of 2008 and its aftermath—a period known as the ‘Great Recession’ in the United States—was a major catalyst for economic transformation and structural change in the US housing sector, with implications for safe and secure water access. In the years directly following the crisis, US cities struggled with high foreclosure rates, vacant properties and repossessed homes1,4,8. By 2012, more restrictive mortgages and a post-crisis rental demand drew new actors and large-scale investors to the single-family rental property market, including private equity firms and corporate landlords3,4,5,8,32. In many US cities, the housing market rebounded and grew, leading to steep rises in median rent and home sales that ‘squeezed’ low-income urban dwellers, especially people of color3,4,33.
Indeed, our analysis shows the housing financial crisis pushed more households into plumbing poverty. Results indicate a two-pronged uptick in the number of US households without running water, first evident in 2008 and then again, at a slower rate, starting in 2016 (Fig. 2b). Following the 2008 crash, the number of US households without running water immediately shot upwards (the first uptick) from 461,000 in 2007 to 760,000 in 2008, an increase of 300,000 households (65%) (Fig. 2b). As the country emerged from the crash and households adapted to a newly restructured housing landscape, the total stabilized at approximately 475,000 households without running water until the middle of the decade. A second, steadier uptick began in 2016 and continued through the COVID-19 pandemic: from 465,000 households without running water in 2019 to 534,000 households in 2022, an increase of 15%.
In sum, despite an overall improvement in household water access at the national level since the 1970s, our results identify two pernicious and persistent trends: first, a concentration of plumbing poverty in US cities; and second, a clear relationship between significant ‘shocks’ in the political economy of housing and increased rates of plumbing poverty.
The racialized nature of water access trends
In a closer examination of pre- and post-crisis trends in the 50 largest US cities—home to roughly half (47%) of all US households without running water—we discovered that water access worsened for people of color between 2000 and 2021, even in cities with healthy economies and population growth.
First, the good news: across the country, levels of plumbing poverty declined or remained steady in many US cities over the last 20 years. We found 83,200 fewer households without running water across the largest 15 US cities in the 2017–2021 period as compared to 2000, a 37.5% decrease (Table 1). Despite having some of the largest numbers of households without running water, New York City, Los Angeles and Chicago recorded the largest absolute drops and Miami; Boston; Detroit and Washington, DC, also registered significant declines (Table 1). In New York City, for example, there were 35,000 fewer households without running water in 2017–2021 compared to 2000, a 58.6% decline. Still, New York City remained home to the most households without running water (24,700) in 2021, followed by Los Angeles (17,400) and San Francisco (12,900); combined, an estimated 127,000 people in these three cities live without running water. Elsewhere, rates of plumbing poverty stagnated: meaning the numbers of households without running water remained virtually unchanged. Little to no change occurred in San Francisco and Seattle, which averaged 14,000 and 5,000 households (respectively) without running water in the most recent period (Table 1).
However, a second finding confirms a worsening scenario for households of color in US cities since 2000. Despite overall improvements across US cities, our analysis found that household water access ‘gains’ are racially skewed towards White improvement—in some cities, at several orders of magnitude. People of color represent the majority of individuals without access to running water in 12 of the 15 largest US cities, including Los Angeles (82%), Miami (79%), San Francisco (74%) and Houston (71%) in the 2017–2021 period (Table 1). Our analysis indicates substantial overrepresentations relative to city-specific racial distributions, expressed as the ‘racial disparity rate’ in Table 1. For example, in 2021, people of color comprised 54% of the population in New York City compared with 68% of its population without access to running water, an overrepresentation of 14% (Table 1). Racial disparity rates were the highest in Philadelphia (26%), followed by Phoenix (23%), Detroit (22%), Boston (15%), New York City (14%), Portland (12%), San Francisco (12%) and Chicago (12%). Taken together, our results suggest that improvements for White urban households came at the expense of urban households of color, most evidently in cities with otherwise progressive policies and healthy economies.
Third, we find that plumbing poverty has selectively increased since the COVID-19 pandemic, despite the fact that many US cities (and states) adopted temporary but expansive COVID-era welfare policies such as water and energy shut-off moratoriums (which prevented utility service disconnections) and household support programs such as unemployment benefits, childcare tax credits and student loan forbearance24. Between the 2013–2017 and 2017–2021 periods, the numbers of households without running water increased in 12 of the 15 largest US cities (Fig. 3 and Table 1), with the largest numerical increases in Dallas–Ft. Worth; Philadelphia; Washington, DC; Houston and Chicago ( ≥ 1,000 households per city; Table 1). We calculated the percentage change for each city (Fig. 3) between 2017 and 2021 and found increases in Portland, Oregon; Phoenix; Houston; Atlanta; Dallas–Ft. Worth; Philadelphia; Washington, DC; Boston; Miami and Chicago—cities that, as we explain below, experienced a dramatic rise in housing and living costs during and after the pandemic. In sum, our analysis indicates that the most recent phase in the urbanization of water poverty—characterized by a reproductive squeeze in affordable housing and a selective erosion of conditions for low-income households of color—shows no signs of slackening or reversal.
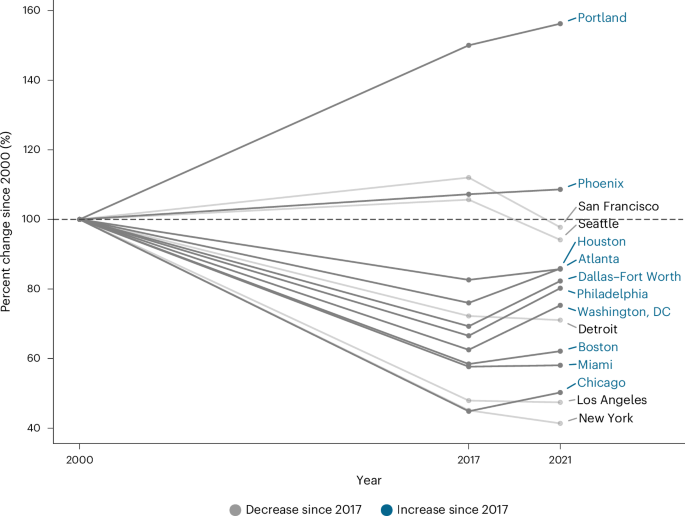
Indicates directionality and percentage change in plumbing poverty among the 15 US cities with the largest absolute number of households without access to running water between 2000 and 2021. Ten cities (in blue) experienced an increase in the percentage change from 2017–2021, meaning their access levels have deteriorated relative to other cities. All cities recorded statistically significant changes between 2000 and 2017–2021 (except Phoenix, San Francisco and Seattle). Source data: US Census Bureau.
Source data
The reproductive squeeze
Portland provides a bellwether case to understand the core mechanism at work in these trends: the reproductive squeeze. In this concept, the capacities of people to reproduce themselves on a daily and societal basis—defined as ‘social reproduction’—are ‘squeezed’ in advanced capitalist societies as capital restructuring and austerity policies transform or roll back support infrastructures, in effect downloading social responsibilities onto individuals in uneven ways25,26,27,28,29. Here we argue that a confluence of political–economic trends, driven by post-crisis changes in the housing market, have squeezed low-income and racialized urban households into more precarious but less expensive living arrangements. Put differently, the cost-of-living crisis and lack of safe, affordable housing in US cities have forced more households into homes without running water, resulting in deteriorating levels of household water access even within the United States’ most prominent cities.
As Fig. 3 indicates, Portland ranked worst among 15 US cities for the percentage change in plumbing poverty since 2000 (a nearly 60% increase), despite its reputation as a model of sustainable urbanism with progressive urban planning34. From 2000 to 2021, we found that plumbing poverty in Portland increased by 1,800 households (56.3%) during a period of rapid population and economic growth and significant wealth gains in the homeownership market. Several structural changes particularly squeezed low-income Portlanders. Whereas median household income in Portland increased by US$16,700 (or 23%) over the last decade (US$72,600 in 2012 and US$89,300 in 2022), the median home sales price increased by US$325,100 or 140% (US$231,900 in 2012 and US$557,000 in 2022) during that same period35,36. Portland renters now face a rental housing landscape that has far outpaced household earnings: median rent increased from US$900 to US$1,600 between 2012 and 2022, a US$700 increase (77.8%)37. Moreover, as a local journalist reported, professional and corporate investors have made significant inroads as owners in the Portland rental housing market, taking advantage of population growth and low vacancy rates to drive up rents well beyond the means of low-income households38 (also refs. 4,5). Many Portlanders have left the city; since 2020, Multnomah County (which includes nearly all of Portland) has experienced the first population decline in 40 years. For the Portlanders who have remained, they must find new ways to pay higher living costs—including, we suggest, moving into less expensive housing without running water.
Alarmingly, our evidence shows that the reproductive squeeze—as explored here through its effect on water access—is expanding to different kinds of US cities, beyond the usual urban suspects. In Fig. 4a–c and Supplementary Video 1, we graphed the movements of the 50 largest US cities from 2000 to 2021 relative to two leading indicators of water insecurity: race and income inequality, both identified as significant predictors of household water access in prior modeling efforts16 (see Methods for details; Fig. 5). The graphs yield three main insights about how the ‘reproductive squeeze’ is working within and across major US cities: (1) the entrenched racialization of plumbing poverty; (2) a relative stagnation and unimprovement in large US metros and (3) the expansion of the reproductive squeeze in deindustrialized metros.
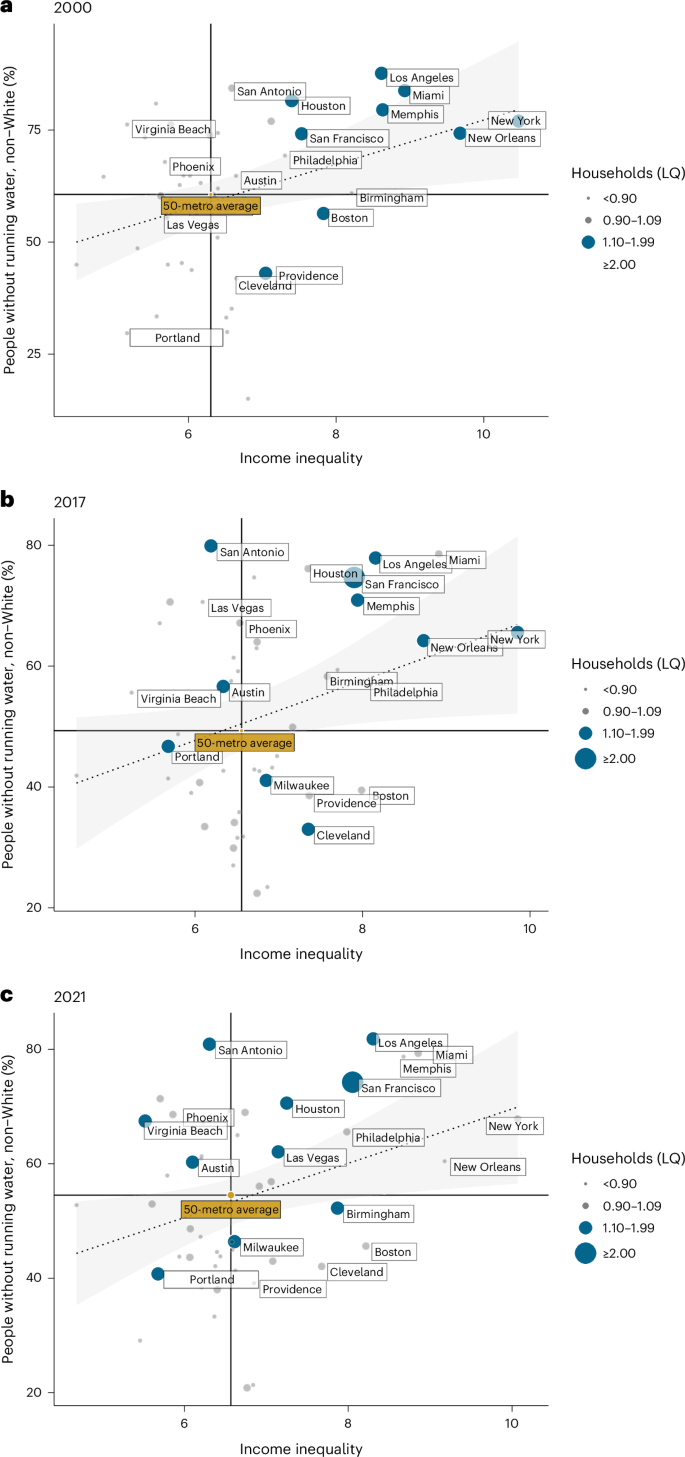
Graphs display the share of households without running water in individual US cities (the bubbles) relative to race, income inequality and the 50-city average (yellow bubble) from 2000 to 2021. a–c, Graphs present city distributions for 2000 (a), 2013–2017 (b) and 2017–2021 (c). To ensure comparability between cities, we calculated a transformed location quotient (LQ)—a statistic that expresses a ratio value—to measure each metro’s share of households without running water relative to the 50-metro average. Income inequality refers to the Palma ratio, which measures gross income between top 5% of population to the bottom 20% of the metro population (Methods); for example, each value of 8 indicates that the top 5% population has a gross income 8× of the bottom 20%. The dotted line is a visual aid, representing a linear-model trendline of each year’s x and y values. The shaded area represents the 95th CI of the trendline. This figure visualizes microdata from combined samples and therefore does not report the corresponding margin of error values. Supplementary Video 1 provides dynamic visualization. Source data: US Census Bureau.
Source data
Source data: US Census Bureau.
Source data
The ‘dance’ of the bubbles in Fig. 4 illustrates the changing conditions of social reproduction (through household water access) as cities responded to a housing and socioeconomic landscape profoundly transformed by the 2008 financial crisis. In 2000, three major cities are clustered in the upper-right quadrant of Fig. 4a: Los Angeles, New York City and Miami, the ‘coastal elites’ of plumbing poverty, characterized by high levels of income inequality, high shares of non-White households and above-average shares of households without running water. Most cities with above-average levels of plumbing poverty (with the exception of Boston and Providence) are situated in the upper-right quadrant of Fig. 4a—a situation we would expect. In the three other quadrants, the distribution is rather unremarkable: most cities enjoyed greater income equality, less racialized plumbing poverty and below-average shares of households without running water.
By 2017, the configuration changes. Following the global financial crisis, cities with above-average levels of plumbing poverty are no longer exclusive to the upper-right quadrant. In 2017, San Antonio, Austin, New Orleans, Cleveland, Memphis, Portland and Milwaukee emerge with above-average shares of plumbing poverty, scattered across different quadrants (Fig. 4b). San Antonio and Austin (fast-growing Sunbelt cities) sit in the upper-left quadrant of Fig. 4b, exhibiting lower rates of income inequality and high shares of non-White individuals without running water. Milwaukee and Cleveland (classic Rust Belt cities) are located in the lower-right quadrant, demonstrating higher rates of income inequality and lower shares of non-White individuals without running water. All four of these cities scored above-average shares of households without running water.
By 2021, three additional trends are evident that illustrate the changing nature of the reproductive squeeze (Fig. 4c): first, a general vertical shift across all quadrants, indicating the increasingly racialized (non-White) nature of insecure water access in cities; second, the addition of Virginia Beach, Birmingham, Las Vegas and Houston as new hotspots of plumbing poverty; and third, the consistency of Milwaukee’s position in 2017 and 2021 and the addition of Birmingham in 2021. Together, these results indicate that the reproductive squeeze has expanded reach from typical ‘coastal elite’ cities—places with a longer history of cost-of-living and affordable housing crunches—towards new, different urban profiles, such as deindustrialized cities.
Birmingham offers an important example here. A once-thriving industrial center of the American South in the early twentieth century, Birmingham’s fortunes turned negative in the 1950s as it suffered the effects of deindustrialization and toxic race relations during the Civil Rights movement. Today, Birmingham’s main industries include health care, professional and scientific services, finance and insurance. In recent years, Birmingham has promoted urban redevelopment efforts, driven by affordable housing, an increasingly diverse regional economy and an emerging food scene. In short, the dynamic changes presented by Fig. 4 suggest that deindustrialized cities—such as Birmingham—and other places that do not neatly fit the ‘coastal elite’ profile are playing an increasingly prominent role in the evolving story of plumbing poverty.
The relationship of institutionalized racism in shaping water poverty in the United States is well established10,13,16,18,30,31,39,40,41,42,43,44,45. Our analysis uniquely illustrates these dynamics over a significant period in the US housing sector, as households of color are increasingly excluded from the ‘gains’ of universal water access in US cities. In Fig. 4, the relationship between racialized water access and income inequality (dotted line) is consistent over time, suggesting these variables remain important predictors. However, vertical dispersion in the top two quadrants away from the average line, combined with already high levels of income inequality across the time periods, together suggests that race (non-White) is becoming an increasingly important predictor of urban plumbing poverty. Across US cities, low-income households of color are being left behind from secure water access in ways even more severe than in 2000.
Why? Again, Portland, Oregon—the whitest large city in the United States—offers a sobering example of the racialized nature of the reproductive squeeze. The number of Portlanders of color without household running water has more than doubled from 1,800 to 4,700 during the past 15 years (Table 1). In 2000, fewer than 250 Black Portlanders lived in homes without running water, just 3.9% of all Portlanders living without access. By 2013–2017, this number had almost quadrupled to >1,100 Black Portlanders (11% of all Portlanders without running water), an increase of 359%. This increase coincided with a period of post-crisis wealth accumulation in greater Portland, in which the growth of various technology industries, real estate development and increased housing values benefitted some Portlanders at the expense of others24. Coupled with Portland’s post-crisis decline of affordable housing (rental and ownership), weakened protections for renters, stagnant wages and a welfare state with few support mechanisms to alleviate household debt (such as utility bills, student loan repayments and medical debt), we have a scenario in Portland that quietly reinforces and expands systemic disparities at the nexus of housing and water. Without stable housing, there is no secure water access. Such trends do not bode well in terms of meeting the Sustainable Development Goals for sustainable cities (SDG 11) and universal water and sanitation access (SDG 6), in Portland and other US cities facing similar pressures.
Discussion and conclusion
Urban inequality is expanding in the United States, including in the ways that households must reproduce themselves on a daily and intergenerational basis. This Article elicits comparative and temporal trends in urban inequality, social reproduction and household water access—a vital infrastructure for a healthy and thriving society. We argue that the reproductive squeeze of households is racialized and expanding in scope and severity across a broader set of US cities. Plumbing poverty, formerly the bastion of a select group of ‘coastal elites’—cities with high levels of absolute and relative statistics, namely Los Angeles, New York and San Francisco—is now growing in cities such as Austin, Atlanta, Birmingham, Portland and Phoenix as structural changes in the political economy of housing have planted the seeds for crisis at the housing–water nexus. Notably, we provide evidence to suggest that post-crisis conditions—unaffordable housing, stagnant wages and a cost-of-living crisis—have led to a reproductive squeeze that has pushed more households into situations of plumbing poverty as people end up in housing without secure or reliable running water. In contrast to the goal of ‘water for all’—a cornerstone of SDG 6—we find the erosion of water access for low-income and racialized households in a widening set of the country’s largest and most affluent cities.
The housing crisis now dominates many state and local politics in the United States, but its implication in inequitable and unjust water access receives far less attention. We show that the reproductive squeeze is also a water and sanitation crisis for US households at the sharp end of uneven wealth accumulation and a hollowed welfare state. Further case study research, especially the cities highlighted in this Article, is urgently needed to unpack dynamics that produce these conditions and inform policy actions that could improve metrics and interrupt these trends. A first port of call is to reform and improve the US Census Bureau’s capacity to collect important nationwide data about household water access, and in particular about the extent of water service shut-offs, a practice that thrives in the dark24.
Our findings raise alarm bells for the prospect of safe housing and universal water access in the United States. Across many US cities, the legacy of the COVID-19 pandemic—notably, stagnant wages, weakened protections for renters, health vulnerabilities and a widespread affordable housing crisis—suggests that low-income households will continue to suffer the squeeze, making insecure water access a very likely scenario for the future. Meeting the development goals for sustainable cities (SDG 11) and universal water and sanitation (SDG 6) in the United States will involve a heroic and paradigmatic transformation of housing conditions and social infrastructures, in a way that centers the support of all households and thriving lives.
Methods
Aims, design and conceptual approach
This Article sought to understand the changing nature of urban inequality as it relates to the social reproduction of households, using household water access as our prism. As a theory and mode of explanation, social reproduction draws on Marxist and feminist political economy to refer to the daily and long-term societal reproduction of populations: including the waged and unwaged renewal of labor power and the social relations that underpin the circulation of capital through the exploitation of social difference. In other words, social reproduction goes beyond a classical political economy approach to consider life-making at the everyday scale—such as housework, childcare, education, health care, clean water provision and so on—as imperative to societal (re)production under capitalism and, indeed, wholly entwined with labor–capital relations. Feminist theorists have analysed the material social practices of social reproduction to reveal the production and reproduction of a differentiated labor force mobilized across lines of difference, including, but not limited to, those associated with gender, race and class25,26,27,28,29. In the context of this Article, we understand social reproduction as the capacity of people to reproduce themselves on a daily and societal basis in relation to capital accumulation, the expressions of which expand, reproduce and reshape inequalities underpinning processes of uneven development in cities.
In terms of research design, the aims of our analysis were threefold: (1) to develop a longitudinal understanding of the rural–urban dynamics of household water access in the United States since the 1970s; (2) to identify trends in household water access and changing urban contexts in the 50 largest US metropolitan areas (referred to as ‘cities’ in this Article) between 2000 and 2021, before and after the 2008 global financial crisis; and (3) to explore major factors for the expansion and deterioration of access trends across a growing number of US cities, even as the national picture for household water access has improved. Combined, this research design allowed us to establish key trends since the 1970s—such as the urbanization and racialization of water poverty—and to probe the scale and direction of urban trends since the 2008 crisis, therefore providing a robust empirical basis for hypothesis generation and ground-level investigation in future case study research.
Conceptually, this study advances theory and explanation in urban political economy and household water insecurity. Notably, we provide evidence to suggest that post-2008 political and economic conditions in a growing number of US cities have produced a ‘reproductive squeeze’—for example, the compounded effects of unaffordable housing, stagnant wages and a cost-of-living crisis—that is forcing low-income households into more precarious living arrangements, including housing without running water. We use a conceptual framework, drawing on critical urban studies, that posits infrastructure (such as piped running water) as the material outcome of relations of power, ideology and struggle10,46,47,48. This framing allows us to move beyond ‘technical’ narratives of infrastructure provision to probe its socioeconomic, political and uneven spatial character across cities.
Plumbing poverty describes a condition of infrastructural inequality that is produced by social and spatial relations10. To explore this condition with data, we measure plumbing poverty as households without running water, using an access-based definition and metric collected by the US Census Bureau (next section). Access to running water—whether due to lack of service or physical connection—is just one component of household water insecurity: a widely recognized umbrella concept defined as a lack of safe, reliable, sufficient, acceptable and affordable water for a thriving life49. Due to data limitations, our analysis focuses only on the ‘access’ dimension of household water insecurity: specifically, the presence of running water in a household.
Data, definitions and limitations
In this Article, we measured plumbing poverty as people living in households without complete access to running water, as defined and collected by the US Census Bureau. Even with its limitations (below), census data offer the most comprehensive and long-term picture of drinking water access at the household level in the United States (and Puerto Rico). To explore urban and temporal trends, we used census microdata: data at the household scale, composed of individual records about persons and household units50,51,52.
Since 1940, the US Census Bureau has collected household-level data on water access and sanitation, colloquially known as the ‘plumbing question’. Until recently, the Bureau defined what they call ‘complete plumbing’ as whether an occupied household had (1) a flush toilet, (2) hot and cold running water and (3) a bathtub or shower, all located within the housing unit and used only by the occupants. In 2016, the Bureau changed the plumbing question and eliminated the ‘flush toilet’ portion, in effect erasing the roughly 43,000 households (or 106,000 people) living without a flush toilet53,54,55. The elimination of the flush toilet variable introduces complexity in data comparison and unfortunately erases a key metric for gauging sanitation coverage in the United States53,54,55. Nonetheless, we adopted the Bureau’s definition of complete plumbing as our access metric because the running water element remains consistent in the data before and after 2016.
We used census microdata due to their coverage, flexibility, comparability and granular focus on the household unit10,16,50. Unlike the more familiar ‘summary’ census data or predefined tabulations (which are compiled statistics), the use of census microdata allows researchers to create customized data tabulations to answer a range of research questions50. As flagged by Deitz and Meehan10, the use of census microdata further sidesteps the well-known methodological problem of ecological fallacy, a source of statistical bias that occurs when researchers make individual or household-level inferences from aggregate data such as census blocks or tracts56. In short, our preferred approach allows us to make and scale inferences about households—including types of household (and their water access) in and between cities.
Census microdata for 2013–2017 and 2017–2021 are sourced from the US Census Bureau, and 2000 microdata are from the University of Minnesota’s Integrated Public Use Microdata Sample, specifically IPUMS-USA51,52. Both sources are public entities and provide access to the same census microdata. We used census microdata from the 2000 Census (SF 3) and the American Community Survey (ACS) five-year combined estimates (2013–2017 and 2017–2021). The ACS is the largest annual sample of households in the USA, providing social, demographic and economic data about individuals and communities. The decennial census (SF 3) and ACS are both drawn from a statistical sample and therefore contain sampling errors that are quantified vis-à-vis margin of error. To improve the reliability of these estimates, we analyzed microdata from the combined samples (that is, instead of a single year) and therefore do not report the corresponding margin of error values.
In this Article, we use the umbrella term ‘cities’ for ease of communication to broader audiences, who may be unfamiliar with technical terminology in planning and government. In practice, we used Metropolitan Statistical Areas (MSAs) as our urban units of analysis; in short, when we refer to ‘cities’ or ‘metros’ in this Article, we technically refer to MSAs. The MSA is a geographic region containing a densely populated core urban area of at least 50,000 inhabitants and neighboring countries with close economic and social ties, as defined by the US Office of Management and Budget. The MSA is commonly used by the US government, planners and urban analysts, as it privileges the spatial and social linkages and coherence of an interconnected urban region, such as the ‘Phoenix metropolitan area’.
A major limitation of MSAs is that their boundaries often change after each decennial census, introducing spatial error and making accurate comparisons over time extremely difficult (J.R.J. et al., manuscript in preparation). To address this problem, we innovated a new dataset and created dynamic metropolitan definitions of the 50 largest US cities that preserve greater definitional consistency of urban areas over time, leading to improved longitudinal precision and data accuracy. This improved dataset is guided by robust criteria that ensures a more urban-focused approach to longitudinal analysis than existing approaches and is available for public download and use in a citable format (J.R.J. et al., manuscript in preparation).
Three limitations of US census data suggest that our results probably underestimate the scale and magnitude of insecure water access in the United States. First, census enumerations often incorrectly omit or include certain individuals, leading to undercounts and overcounts, respectively. Individuals more likely to be excluded or undercounted from the census are ‘hard-to-count’ populations, which include people of color, foreign-born individuals, children, LGBTQIA+ individuals and people experiencing homelessness57. In the 2020 Census, for example, an estimated 3,100,000 (5%) of Hispanic/Latino individuals were excluded from the count, an example of racialized data exclusion (ref. 58 and J.R.J., manuscript in publication). Because many ‘hard-to-count’ populations are the same social groups most likely to experience a lack of running water and sewerage10,13,16,30,40, we expect that our results here in fact underestimate the scale and magnitude of water access problems.
A second limitation is that many people experiencing homelessness—a growing population in many US cities—are either undercounted or excluded from census data. For example, people living in housing arrangements that are managed by an organization—such as shelters or group homes—are counted as ‘group quarters’ residents by the Bureau, and these individuals are not included in the dataset. Put simply, the Bureau does not query ‘group quarters’ residents about their running water access or other forms of critical infrastructure provision. At the same time, research shows that people who experience homelessness in the United States are more likely to lack secure access to water and sanitation and to shift between phases of security and insecurity at regular intervals55,59,60,61. Therefore, such data limitations mean that we probably missed many unhoused people in our tabulations, meaning the scale of insecure water access could be even more severe or widespread.
Finally, a third limitation is an issue of opacity and data justice62. Currently, the US Census Bureau uses the ‘plumbing question’ to ask respondents about their household running water status (“Does this house, apartment, or mobile home have hot or cold running water?”), a phrasing that introduces complexity and confusion for households that lack access due to water service suspensions, a widespread practice in the United States24. Limitations of US Census data phrasing mean we cannot discern whether plumbing poverty is a direct result of infrastructural shortcomings, landlord neglect, water service shut-offs, voluntary ‘off-grid’ existence and so on. Nor does the Census phrasing clearly distinguish between a temporary or permanent lack of running water. In sum, the Census questionnaire may undercount or miss households that experience shut-offs at times outside of the sampling frame; and, conversely, the definition may lead to impressions that access problems are strictly about physical infrastructure, rather than about socioeconomic, political and affordability issues. In line with ongoing efforts to improve accurate and scalable data for improved public health and well-being55, we recommend future research and policy action to investigate and improve the plumbing question in ways that strengthen the Bureau’s capacity to collect important, nuanced data about the state of household water and sanitation, with an eye towards improving metrics to achieve universal water access.
We anticipate that at least some of the US household respondents who are categorized as ‘plumbing incomplete’ are experiencing water service suspensions by utilities. This is a hidden problem. Indeed, a related data limitation at the national scale is the complete lack of any comprehensive policy or nationwide dataset on water service disconnections in the United States—an issue of social and data justice. To date, much of the early applied research, policy action and public awareness around water shut-offs has been done at the community scale in cities, such as citizen-scientists in ‘We the People of Detroit’ or by motivated elected leaders, community practitioners and municipal agencies in the City of Philadelphia—two signatory cases. In line with the above policy recommendations, we urge for an overhaul of the ‘plumbing question’ in a way that clearly measures and monitors water shut-offs.
Methods of analysis
To examine trends in urban inequality, we analyzed census microdata in three steps: (1) by spatial data visualization (Fig. 1); (2) using descriptive statistics and summative techniques (Fig. 2, Table 1 and Fig. 3) and (3) through a comparative, interpretive analysis of changes in the 50 metros from 2000 to 2021, relative to two household-level predictors of insecure water access: first, a metric of spatial income inequality and second, a metric of racialized access to running water (Fig. 4). We chose income inequality and racialized access because they were the most statistically significant predictors of plumbing poverty in a previous regression model16. We present static versions of the bubble plots in the Article (Fig. 4a–c) and we strongly urge readers to consult the moving video animation in Supplementary Information.
To develop Fig. 4, which presents results for the years 2000 (Fig. 4a), 2013–2017 (Fig. 4b) and 2017–2021 (Fig. 4c), we compiled data on household water access at the metro level for the 50 largest US cities. To ensure comparability between cities, we calculated a transformed location quotient (LQ)—a statistic that expresses a ratio value—to measure each metro’s share of households without running water relative to the 50-metro average. As a ratio value, the location quotient enables fairer and more accurate comparison between cities. To interpret Fig. 4: the bigger the bubble, the larger-than-average proportion of households without running water for that specific city.
To guide our comparison, we bracketed the visualization with two significant household-level predictors of insecure water access16: first, a metric of spatial income inequality (x axis) and second, a metric of racialized water access, calculated as the percentage of people without running water who are non-White (y axis). Selection of these two variables is supported by a now-substantial literature that reveals a long and unjust history of racialized drinking water access in the United States—a legacy still experienced by communities of color today10,13,16,17,18,30,40,41,42,43,44,45,59,63,64.
Previously, we used the Gini coefficient to measure income inequality16. In this study, we used a modified version of the Palma ratio to measure income inequality (x axis), an improvement on past efforts. The Palma ratio is the ratio of gross income between the top 10% of the population relative to the bottom 40% and is often used to represent income disparities between ‘rich’ and ‘poor’ groups65. Recent advances in development studies suggest that the Palma ratio is a preferred technique to compare income inequality among groups, especially at the national scale, because it is less sensitive to changes in mid-tier income groups65.
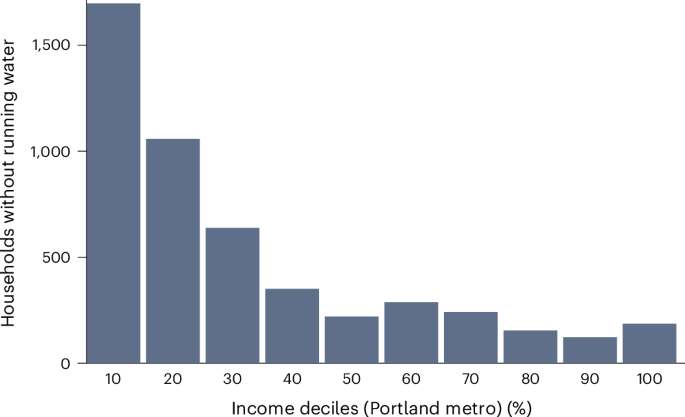
We made slight modifications to the thresholds of the Palma ratio to improve the measurement of our target population: we adjusted the top threshold to 5% and the bottom threshold to 20% of income quantiles. When we tested the income distribution of US urban households without running water (our target population), we determined a bottom threshold of 20% allowed a more precise focus on wealth gaps—the main goal of inequality metrics such as Palma—due to the relatively small sample concentrated at the lowest-income tiers. For example, Fig. 5 shows the distribution of households without running water in the Portland metro area across income deciles. An estimated 55% of households without running water in metro Portland have household incomes below Portland’s 20% income decile, indicating a severe concentration in low-income deciles (Fig. 5). Therefore, an adjusted Palma ratio (to a bottom threshold of 20%) better captures and represents our households of interest.
Spatial data visualization
To create Fig. 1, we used hexagons as spatial units to display household data across the United States. This technique—a tessellated hexagon grid via spatial area interpolation—is a preferred visualization method for maps such as Fig. 1 as it reduces spatial bias and prevents overrepresentation and disappearance of phenomena (for example, households) in small enumeration units (for example, counties, cities or census tracts), therefore improving interpretation of geographic data16,66. Hexagonal cells are preferred to square cells because of their ability to capture non-orthogonal spatial phenomena that would otherwise be lost in a square-cell grid. The hexagon is also the preferred level of granularity needed to identify trends at multiple geographic scales. For example, Fig. 1 shows a noticeable concentration of households without running water within and near urbanized areas in the United States.
The map is intended to show, on a national level, where spatial concentrations of households without running water are located and how they mirror concentrations of major urban population centers. Nominal counts are used instead of proportions because the map uses a regularized tessellated grid instead of irregular enumeration units such as counties or states. Because the geographic units are all the same size, mapping a nominal count within them is akin to mapping density. Breaks used in the legend of Fig. 1 are partially based on quantile breaks with manual adjustments to improve the legibility of hot/cold spots. Quantile breaks (and other methods such as k-means or Fisher) are based on the specific distribution of a dataset, which, if the distribution is skewed (as Fig. 1 is), results in irregular break points and often a large ‘tail’ bin which contains outliers.
In terms of process, we converted counts of households without running water at the county level to hexes via areal-weighted interpolation: a method that estimates population values for overlapping polygons67. This method allocates estimates based on the percent of surface area overlap between the hexagon and any intersecting enumeration unit.
Reporting summary
Further information on research design is available in the Nature Portfolio Reporting Summary linked to this article.
Responses