Urban-rural digitalization evolves from divide to inclusion: empirical evidence from China
Introduction
Since the advent of the digital era, Information and Communication Technologies (ICTs) have profoundly influenced human production and life, acting as a transformative force and propelling rapid digitalization1,2. The world is increasingly driven by a digital logic, reshaping traditional economic and societal paradigms3,4,5,6. For instance, Internet access now extends to 60% of the global population, with users spending over 40% of their waking life online7,8. Digitalization is widely recognized as a significant opportunity, especially for urban and rural areas9. Urban-rural digitalization (URD) represents a digitally-driven future for these areas, with the potential to mitigate adverse economic externalities in cities5 and alleviate poverty and deprivation in villages10,11,12. Despite the benefits, the digital divide has become a growing concern, exacerbated by the COVID-19 pandemic, which highlighted the disparity between digitally advanced nations and those with less robust digital infrastructures13.
Indeed, digital inequality between urban and rural areas constitutes the most serious digital divide, stemming from longstanding conflicts and gaps between these areas. Rural areas, which are always at a disadvantage, lag behind their urban counterparts in digital race14. For instance, in China, the number of rural Internet users is less than half that of urban areas. Furthermore, the potential pitfalls of urban-rural inequality manifest under the umbrella of digital divide15,16,17,18. The digital divide is not merely a digital term but also relates to the socio-economic dimensions19, exacerbating the dichotomy between rural decline and urban ascendancy. Hence, it is noted that the digital dividend coexists with the digital risk20,21. Global digitalization presents a new challenge for urban-rural areas, emphasizing the necessity of building inclusive digital ecosystems to leave no one behind in the digital society1.
Prior studies have explored digital issues within the urban-rural context, adopting two perspectives to analyze URD: 1) the separate perspective and 2) the contrastive perspective. The former discusses digitalization in isolation, focusing exclusively on either urban digitization22,23,24 or rural digitization25,26. This approach highlights the digital dividends specific to urban and rural areas. In urban settings, digital technologies are viewed as effective tools for addressing challenges arising from rapid urbanization27 and even for achieving Sustainable Development Goals (SDGs)28. The positive impacts of digitization on urban development have been underscored across economic, social, and environmental dimensions29,30,31,32,33. For rural areas, digital opportunities have been discussed with respect to agricultural and non-agricultural sectors. ICTs drive traditional agriculture transform into modern paradigm34, promoting sustainable food production that balances various interests35,36. Facilitated by ICTs, villages can overcome spatial friction and alleviate the locational disadvantages37. For instance, rural areas develop e-commerce38 to benefit from the digital economy39,40, engaging in remote and reshaping status on the global stage12,41.
Contrastive perspective concentrates on the digital inequality42,43, revealing that digitalization yields both benefits and drawbacks, with the urban-rural digital divide being particularly prominent. The understanding of this divide has evolved through three orders. The first-order digital divide refers to a binary separation between the cities with ample access to ICTs and the villages lacking such access14,44. The second-order digital divide, a more expansive concept, has garnered attention for its focus on the usage gap25,26,45. Recently, scholars have studied the outcome gap of internet use, known as the third-order digital divide46. Two main factors contribute to these divides: 1) the path-dependence of facility layout, which prioritizes digital facilities and services in cities44,47; 2) the gap between urban and rural residents in the speed of adaptation to and ability to use digital technology48,49. In shadow of this digital inequality, rural areas are further marginalized compared to their urban counterparts.
Despite the above efforts, a notable deficiency persists in providing scientific evidence to support urban-rural areas in leveraging digital technology while mitigating associated risks. The separate perspective recognizes the benefits, while the comparative perspective highlights the risks. However, they ignore that digitalization for urban-rural areas is not a binary Benefit/Risk but a complex process. Consequently, previous studies still struggle to accurately reflect the true state of URD from two existing perspectives. There is still no consensus on whether URD moves towards inclusion or divide, leaving it unclear whether ICT functions as a factor to bridge inequality or cause a new type of inequality50,51 between urban and rural areas. This uncertainty hampers problem diagnosis. Current digital challenges in the urban-rural areas remain unclear but cannot be neglected. More challenges must be jointly faced by urban and rural areas, due to the increasingly blurred boundaries. There is a thirst for coping with digital problems together and seeking integrative solutions9. However, a clear lack of an integrated perspective that encompasses both urban and rural contexts is shown. More evidence is required to inform tailored policy for urban-rural areas to jointly face with digital challenges.
Similar to the absence of perspective, the assessment also suffers from incomplete consideration. Digital development and digital gaps are always studied separately. Some studies focus exclusively on the development, overlooking the concurrent gaps52,53, while others examine the gaps but neglect development54. However, there is potential for the development and the gap to coexist. In fact, a pattern where heightened development is accompanied by pronounced gaps is unsustainable, and a low gap with simultaneous developmental lag fails to capture the true state of URD. Effective URD should balance the development with addressing gaps. Yet, to the best of our knowledge, few analyses have simultaneously considered both aspects. Although ref. 15 explores the relationship between development and gaps on a urban scale, empirical assessment particularly within urban-rural contexts remains surprisingly scant.
To this end, we try to rethink digitalization in the urban-rural context. The overarching aim of this work is to explore the comprehensive state of URD across geographic space and over time. We introduce an integrated perspective to foster a comprehensive understanding of URD. Utilizing this new lens, we depict the evolutionary process of URD (Fig. 1) and present a groundbreaking framework termed D-G-I (Development-Gap-Integration) (Fig. 2). There are two states and three axes that can demonstrate URD, with further details provided in the “Methods” section. Subsequently, we assess the spatio-temporal performance of URD and judge its state. This enables us to answer whether URD moves towards a gradual integration representing digital inclusion or a widening gap representing digital divide. Some pitfalls of URD are also unveiled and tailored policies for addressing these pitfalls are proposed. We hope this work contributes to achieving digital inclusion to leave no one behind in both urban and rural areas, aligning with the Agenda 2030 for Sustainable Development (i.e., SDGs 10 and SDGs 11) and Digital Strategy (2022–2025) from UNDP.
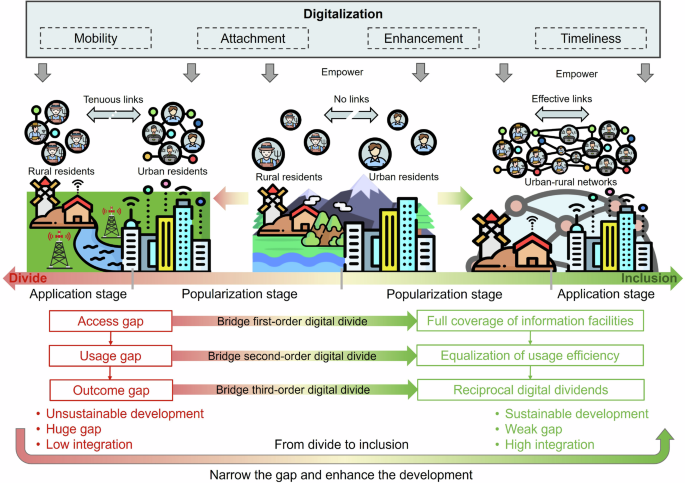
From top to bottom, the digitalization that affects urban and rural areas, the external manifestations, the two states, and the evolution from divide to inclusion are shown in turn. The image is created by us and some elements of this image are from the public database Flaticon (https://www.flaticon.com/) with open access, including portraits of inhabitants, urban and rural architectures.
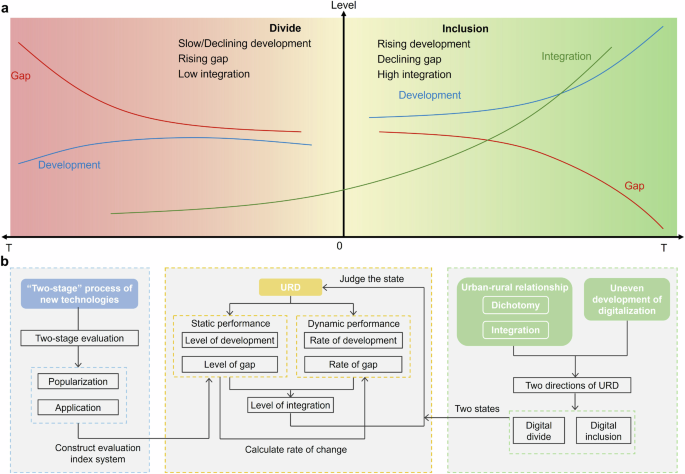
a The line graph illustrating the levels of development, gap and integration under the divide or inclusion states respectively. b The road-map for assessment of URD.
China is selected as the study area for two reasons: a nation 1) which becomes the world’s largest telecommunication market as well as the leading exporter of digitalization42; 2) where urban-rural conflicts are apparent, yet there exists an aspiration to transition towards integration55. Hence, China is inevitably a typical example for exploring urban-rural digital issues. Moreover, this study offers valuable insights for other countries urgently seeking strategies for urban-rural development in the digital era.
The subsequent sections of this paper are structured as follows: “Results” presents some results of this research; “Discussion” highlights key contributions and delves into the implications; “Methods” describes specific methods.
Results
By using data collected from China, we did this work at provincial scale from 2000 to 2020. The evaluation was divided into two stages: the popularization (2000–2011) and the application (2012–2020). This section presents the main empirical findings in five blocks: 1) development performance; 2) gap performance; 3) integration performance; 4) regional disparity; 5) four patterns.
Development performance of URD
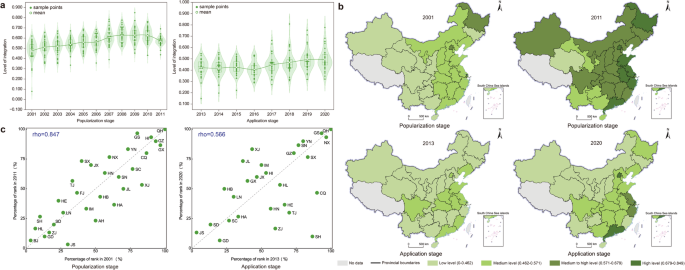
In Fig. 3a, the density distributions of provincial points during both the popularization and application stages exhibit clustering in the center and bottom, indicating that the majority of provinces are at low levels of development. The finding is also supported by a positive skewed distribution, with skewness values greater than 0 (see Table S1 in Supplementary Information). Furthermore, the mean values exceeding the median values demonstrate the significant impact of outliers, revealing that a few high-development provinces have values that far surpass those of the majority with low or medium development.
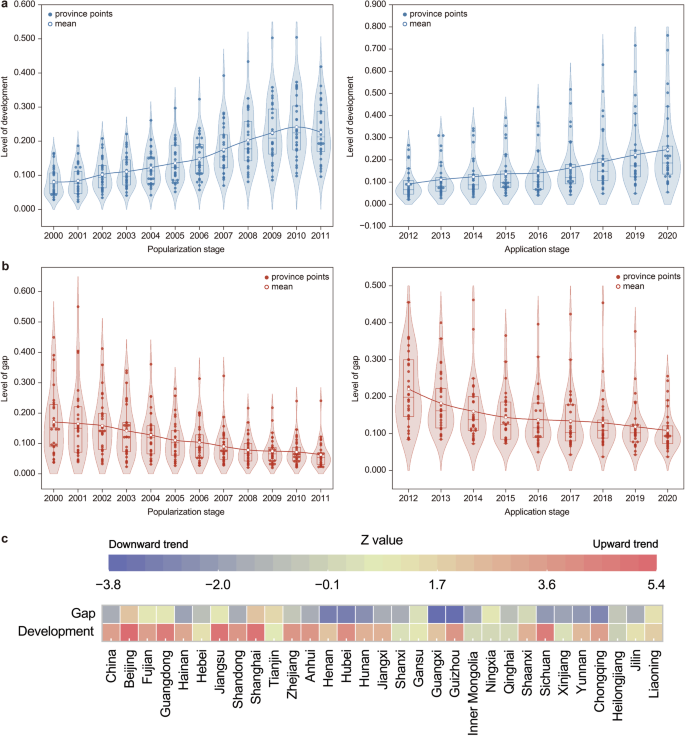
a Level of development at popularization and application stages. b Level of gap at popularization and application stages. c Trends of development and gap from 2000 to 2020. Z-score values indicate the monotonic trends in provinces, with color closer to red representing a more significant upward trend or color closer to purple representing a more significant downward trend.
By tracking how the levels of development move during popularization and application stages (marked as ({D}_{P}) and ({D}_{A})), obvious upward trends are captured (Fig. 3a). This is substantiated by the increasing averages (increasing by 182.47% and 170.91%, respectively) and medians (increasing by 182.67% and 184.64%, respectively). The upward trend of ({D}_{P}) fluctuates slightly, while ({D}_{A}) maintains a steady trend. Average of ({D}_{P}) rises from 0.081 to a peak of 0.242, followed by a slight decrease to 0.227. Median of ({D}_{P}) rises from 0.075 to a peak of 0.224, before declining to 0.212. Meanwhile, average of ({D}_{A}) steadily climbs from 0.091 to 0.246 and median of ({D}_{A}) rises from 0.065 to 0.186. Notably, the upward expansion in density and the consistently rising median further support the improvement in ({D}_{P}) and ({D}_{A}) for most provinces.
Such improvement can also be proved by trend test. The red color of Z value indicates a notable upward trend for China as a whole from 2000 to 2020 (Fig. 3c). Specifically for each province, most of them show significant upward trends, including Beijing, Fujian, Guangdong, Hainan, Jiangsu, Shandong, Shanghai, Zhejiang, Anhui, Hubei, Guizhou, Shaanxi, Sichuan, and Chongqing. Some provinces display weaker upward trends, including Hebei, Tianjin, Henan, Hunan, Jiangxi, Shanxi, Gansu, Guangxi, Inner Mongolia, Ningxia, Qinghai, Xinjiang, Yunnan, Jilin, and Liaoning. However, Heilongjiang shows a downward trend. The findings reveal that development is progressing towards a higher level not only at the national level but also at the provincial scale.
Regarding the spatial distribution of development, Fig. 4a illustrates a pattern characterized by high levels in the east and lower levels in the west. The evolutionary trajectory from low to high development is spatially marked by a spread from the coastal areas towards the inland regions. In 2000 of popularization stage, eleven provinces presented a medium ({D}_{P}), whilst the remaining provinces were at a low level. The spatial performance of ({D}_{A}) in 2012, an early application stage, was even more dismal, with only six provinces achieving a medium level. As noted in temporal performance, there has been significant advancement. Similarly, this spatial lens also proves that ({D}_{P}) and ({D}_{A}) have extensively increased to higher levels in the vast majority of provinces. For ({D}_{P}), most provinces showed medium development and medium to high development in 2011, such as Shanghai, Jiangsu, and Zhejiang. Guangdong and Heilongjiang even reached high levels, while Qinghai remained at a low level. For ({D}_{A}), most provinces showed medium development in 2020. Beijing, Shandong, Jiangsu, Shanghai, Zhejiang, and Guangdong reached the high levels. Sichuan, Hubei, Henan, and Anhui were at medium to high levels. However, Qinghai, Gansu, and Ningxia remained at low levels. Comparing the two stages, the popularization stage exhibited a more uniform spatial distribution, with a large number of provinces clustering at the same level. But for the application stage, ({D}_{A}) displayed a mosaic pattern, characterized by provinces of different levels interspersed across the space, with extreme levels (either high or low) clustering in a few adjacent provinces.
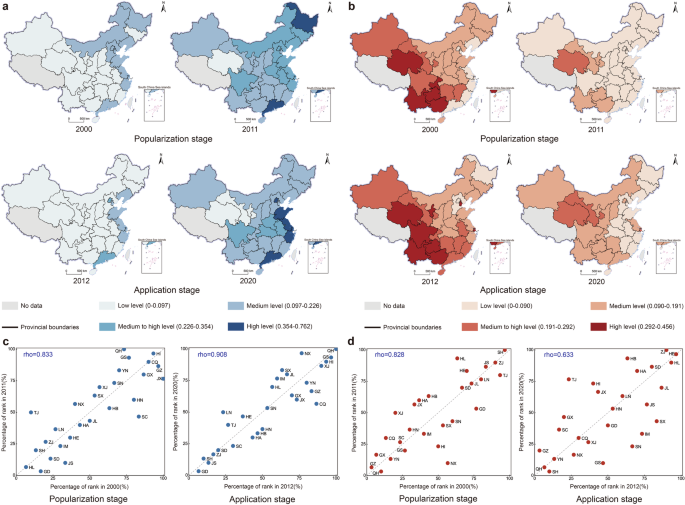
a Development of 30 provinces. b Gap of 30 provinces. c Rank-size changes of development. d Rank-size changes of gap. The abbreviations of provinces in China are: AH Anhui; BJ Beijing; CQ Chongqing; FJ Fujian; GS Gansu; GD Guangdong; GX Guangxi; GZ Guizhou; HI Hainan; HE Hebei; HA Henan; HL Heilongjiang; HB Hubei; HN Hunan; JL Jilin; JS Jiangsu; JX Jiangxi; LN Liaoning; IM Inner Mongolia; NX Ningxia; QH Qinghai; SD Shandong; SX Shanxi; SN Shaanxi; SH Shanghai; SC Sichuan; TJ Tianjin; XJ Xinjiang; YN Yunnan; ZJ Zhejiang. The standard deviation method is used to delineate different zones of level.
To clearly portray the spatial structures of ({D}_{P}) and ({D}_{A}), we ranked the provinces in ascending order according to their levels of development. The changes in Rank-size of development are illustrated in Fig. 4c. The ranks of both high-level and low-level provinces remain relatively unchanged, whilst the ranks of medium-development provinces are unsteady. The scatters of the top-ranking and bottom-ranking provinces are close to the diagonal line, indicating minimal rank changes. Spearman’s rank correlation test can measure the overall correlation of Rank-sizes between the initial and final years. The closer ({rho}) is to 1, the less changing the rank of provinces is and the more stable the overall structure is56. We find that the overall Rank-size structure is stable, evident by the ({rho}) for the popularization stage (0.833) and the application stage (0.908). This stability of Rank-size structure reveals the steady spatial structures of ({D}_{P}) and ({D}_{A}) on the provincial scale.
Gap performance of URD
For the temporal performance of gap (Fig. 3b), most provinces exhibit low-level gaps, with some experiencing deeper disparities. Province points cluster in the center and at the bottom, and the skewness values are greater than 0 (see Table S1 in Supplementary Information). Similar to the development, the position of the average is over the median.
However, the dynamic performance of gap differs from development. During both the popularization and application stages (marked as ({G}_{P}) and ({G}_{A})), significant reductions in gap levels are observed, evidenced by declining averages (decreasing by 63.19% and 50.91%, respectively) and medians (decreasing by 65.05% and 52.93%, respectively). Average of ({G}_{P}) steadily declines from 0.171 to 0.063 and median shows a constant drop from 0.153 to 0.053. Average of ({G}_{A}) decreases from 0.221 to 0.183 and median falls sharply from 0.199 down to 0.094. In addition, most provinces gradually move towards a medium-level gap, evident by the widening density shape in the middle and the average getting closer to the median. The above findings provide ample evidence for gap reduction of URD, not only during the popularization stage but also in the application stage.
In detail, provincial trends of ({G}_{P}) and ({G}_{A}) are illustrated in Fig. 3c. The overall trend in China is downward, depicted by purple color of the Z value. However, there is significant provincial heterogeneity in gap trends. Thirteen provinces exhibited extensive decreases in gap values, such as Hainan, Anhui and Hubei. Seven provinces displayed a slight downward trend, including Hebei, Shandong, Zhejiang, Shanxi, Qinghai, Heilongjiang, and Jilin. Conversely, there is a weak upward trend in nine provinces. Dating back to the trend of development, provinces with an upward gap can be categorized into two types: 1) the synchronized growth that represents a rising gap with rising development, such as Beijing, Guangdong, and Shanghai; 2) the weak change that represents a slight trend of both gap and development, including Tianjin, Gansu, Ningxia, and Liaoning. Therefore, most provinces have narrowed the urban-rural digital gap, but a few provinces, especially those with high development, still grapple with the challenge of gap accumulation.
For the spatial performance, the level of gap exhibits an overarching pattern of high in the west and low in the east, decreasing from the western to the eastern regions (Fig. 4b). For ({G}_{P}), some western provinces were at a high level in 2000 (e.g., Qinghai and Yunan), while the eastern seaboard provinces were already at a low level. In 2011, the high-level zones decreased from 5 to 0, and most provinces became low level. Qinghai still kept a medium to high level gap and six provinces had a medium gap. For ({G}_{A}), there were eight provinces at a high level and nine provinces at a medium to high level in 2012. Provinces like Heilongjiang, Beijing, and Hebei had a low-level gap. By 2020, most provinces had transitioned to medium and low levels, with fourteen provinces at medium level and thirteen at low level. The high-level zones decreased from 8 to 0, and the zones of medium to high level decreased from 9 to 3, with only Shanghai, Gansu, and Qinghai still struggling with a medium-high gap. Comparing the two stages, the gap reduction of ({G}_{P}) is more pronounced than that of ({G}_{A}), evidenced by the number of low-level zones. In contrary to development, ({G}_{A}) has a more even spatial distribution than ({G}_{P}). Notably, the coexistence of high development and high gap is observed in some coastal provinces with developed economy during the application stage. This finding reveals a novel pattern, contrasting with two prevailing patterns: 1) low development accompanied by high gap and 2) high development accompanied by low gap.
Rank-size changes of ({G}_{P}) and ({G}_{A}) are shown in Fig. 4d. The Rank-size change associated with ({G}_{P}) is similar to those of ({D}_{P}) and ({D}_{A}), indicating steady ranks of high- and low-gap provinces. The ({rho}) (0.828) proves that the overall Rank-size structure is stable, reflecting a steady spatial structure of ({G}_{P}). However, the situation of ({G}_{A}) is slightly different. The scatters of provinces are not close to the diagonal line and most provinces exhibit a decline in Rank-size. Thus, spatial structure of gap is stable but ({G}_{A}) is a little more fluctuating on provincial scale.
Integration performance of URD
When development and gap have been calculated, we can further assess integration. Static performance and dynamic performance (i.e., level and rate) are employed to evaluate the integration level and judge the state of URD. A low integration represents a trend towards digital divide, whilst a high integration represents a trend towards digital inclusion. Further details can be found in the “Methods” section.
Temporal performance of the integration level during popularization and application stages (marked as ({I}_{P}) and ({I}_{A})) is presented in Fig. 5a. URD in China has progressed and deepened towards a state of inclusion, evident by the integration values ranging from 0.4 to 0.6 and an upward trend. Average of ({I}_{P}) increases by 19.98% from 0.475 to 0.571 and median of ({I}_{P}) increases by 14.11% from 0.499 to 0.570. Average of ({I}_{A}) experiences a slight climb of 16.88% from 0.422 to 0.493 and median of ({I}_{A}) rises by 8.74% from 0.433 to 0.470. Notably, there is a difference in density distributions between ({I}_{P}) and ({I}_{A}). ({I}_{P}) exhibits a negative skewed distribution, whilst the skewed distribution of ({I}_{A}) changes from negative to positive (see Table S1 in Supplementary Information). This difference indicates that most provinces move towards higher integration in popularization stage, but provinces in application stage had low integration.
a Temporal performance. b Spatial distribution. c Rank-size change.
For the spatial distribution (Fig. 5b), integration shows a pattern of high levels in the east and low levels in the west, with the evolutionary process from low to high spreading from the coast to the inland. For ({I}_{P}), most provinces were at a low or medium level in 2001. Heilongjiang, Beijing, and Shanghai showed medium-high integration. In 2011, zones of medium to high and high levels increased to 17 and 7, respectively. However, Qinghai was still at a low level. For ({I}_{A}), ten provinces showed a medium level and the remaining provinces were at a low level in 2013. In 2020, high-integration zones increased from 0 to 2, and medium-high zones increased from 0 to 3, concentrated in the east. Central China remained in a medium-level zone, whilst the northwest stayed at a low level. Comparing ({I}_{P}) and ({I}_{A}), most provinces showed a higher level in ({I}_{P}) than in ({I}_{A}). There was high-value aggregation during popularization stage, but high-value zones of ({I}_{A}) showed a dot-dispersed distribution. These characteristics indicate that integration during popularization stage is better than during the application stage.
In addition, a steady overall spatial structure is also observed in integration and ({I}_{P}) shows a more stable spatial structure than ({I}_{A}) (Fig. 5c), evident by the (r{ho}) of ({I}_{P}) (0.847) and ({I}_{A}) (0.566). During the popularization stage, the top 25% percent of provinces were clustered around the diagonal line, including Beijing, Guangdong, Zhejiang and Shandong. Similarly, provinces in the bottom 25% displayed the same feature. During the application stage, the Rank-size change was more significant in some top- and mid- rank provinces, such as Guangdong, Zhejiang and Hubei.
Overall, these findings highlight the progress of achieving digital integration across China’s provinces, with notable advancements during the popularization stage and more varied performances during the application stage.
Regional disparity of URD
The difference within a province is a group inequality between urban and rural residents, whilst the difference existing in urban-rural areas between provinces represents a regional disparity. URD clearly moves towards an inclusion state within provinces, revealing that group inequality on an intra-provincial scale has been dissolving. However, regional disparity on the inter-provincial scale is surprisingly captured in China.
Rising development is accompanied by a widening regional disparity, whilst the inter-provincial disparity of gap decreases. In box plot, the length of box represents the range of data distribution. In Fig. 3a, an expanding length indicates that the inter-provincial disparity of development has increased. In contrast, the shortening length of gap shows a falling inter-provincial disparity (Fig. 3b). This demonstrates that the gap reduction has occurred on both the intra-provincial and inter-provincial scales. By observing box lengths, we also find the regional disparity in integration (Fig. 5a). Inter-provincial disparity of ({I}_{P}) declines, evidenced by the shortening length of box. However, for ({I}_{A}), a widening length shows that disparity during application stage slightly increases between provinces.
These findings are further supported by variances in development, gap and integration (Fig. 6). There is an upward trend in the variance of development but a downward trend in the variance of gap (Fig. 6a), proving a widening disparity for development and a narrowing disparity for gap. Variance of ({D}_{P}) rises from 0.002 to 0.007 and variance of ({D}_{A}) rises from 0.004 to 0.030. Conversely, variance of ({G}_{P}) decreases from 0.012 to 0.002 and variance of ({G}_{A}) decreases from 0.009 to 0.003. For the variance of integration, however, is different between popularization and application stages (Fig. 6a). Variance of ({I}_{P}) shows an unstable declining trend from 0.011 to 0.002, whilst variance of ({I}_{A}) slightly rises from 0.006 to 0.010. This indicates that inter-provincial disparity during the application stage is more apparent, as also reflected in the variances of development and gap. Variance decompositions shows that eastern and western provinces are prone to larger regional disparities (Fig. 6b). During the popularization stage, variance of ({D}_{P}) is most prominent among eastern provinces, whilst variances of ({G}_{P}) and ({I}_{P}) are more significant among the western provinces. During the application stage, variances of ({D}_{A}), ({G}_{A}) and ({I}_{A}) are all most prominent among eastern provinces.
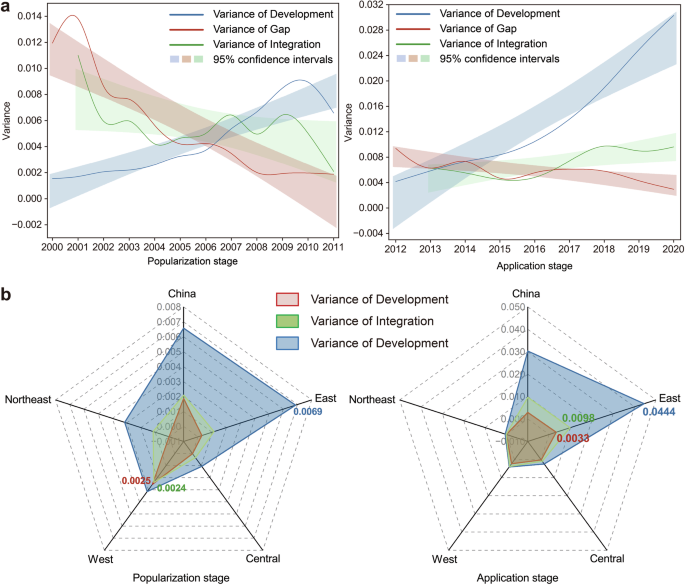
a Variance trends at popularization and application stages. b Variance decompositions at popularization and application stages. We divide China into four regions according to its economic management system: 1) The eastern region including Beijing, Fujian, Guangdong, Hainan, Hebei, Jiangsu, Shandong, Shanghai, Tianjin, and Zhejiang; 2) The central region including Anhui, Henan, Hubei, Hunan, Jiangxi, and Shanxi; 3) The western region including Gansu, Guangxi, Guizhou, Inner Mongolia, Ningxia, Qinghai, Shaanxi, Sichuan, Xinjiang, Yunnan, and Chongqing; 4) The northeastern region including Heilongjiang, Jilin, and Liaoning.
In summary, while China has made progress in reducing intra-provincial disparities, inter-provincial disparities remain significant. The disparities in development are widening, whereas the disparities in gaps are narrowing. Integration shows a mixed trend with declining disparities during the popularization stage but increasing disparities during the application stage. These findings highlight the need for targeted policies to address regional disparities, ensuring more equitable digital inclusion across all provinces.
Four patterns to portray URD
Based on the performance relative to development and gap, we find four patterns of URD (Fig. 7): 1) high-high pattern (I); 2) low-high pattern (II); 3) low-low pattern (III); 4) high-low pattern (IV). Pattern II and Pattern III are most prevalent in the early years of the two stages (Fig. 7a, b). Most provinces show low development, with some western provinces, such as Qinghai, Guizhou, and Guangxi, exhibiting a high gap. With the growing digitalization, Pattern IV becomes more common in the later years of both stages (Fig. 7a, b), indicating increased development and reduced gap. Notably, Pattern I, unexpected yet rare, is found in two provinces during the application stage (Fig. 7b), specifically Shanghai and Guangdong. Interestingly, this high-high pattern is only observed in developed provinces during the application stage.
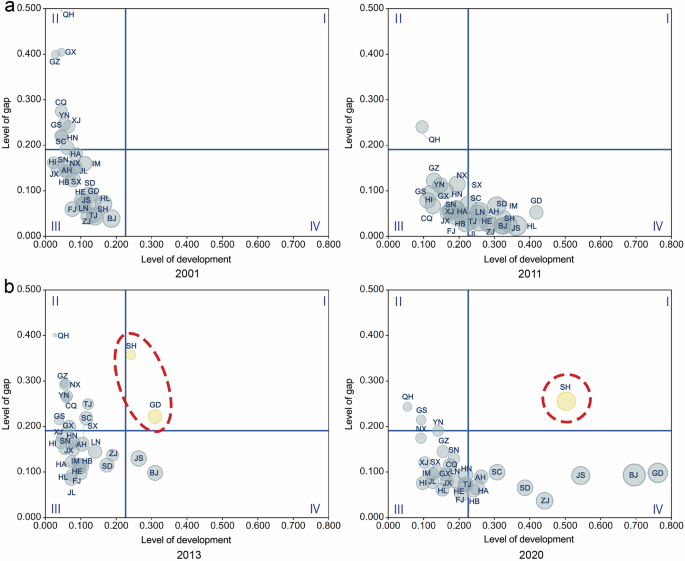
a Patterns during popularization stage. b Patterns during application stage. The X-axis represents the level of development and the Y-axis represents the level of gap. The size of the bubbles represents the level of integration. Provinces show four patterns: I) high-high pattern (high development and high gap); II) low-high pattern (low development and high gap); III) low-low pattern (low development and low gap); IV) high-low pattern (high development and low gap).
The existence of Pattern I implies that development and gap are not negatively correlated. This observation is further supported by the trend of “synchronized growth,” where both the gap and development rise together. It is noted that development and gap can coexist at the same time, supporting our argument in the Introduction section and the soundness of our theoretical framework. Digital development does not inherently guarantee a reduction in the gap. In this pattern, integration is inevitably low because a high gap prevents high development from being sustainable. This implies the importance of addressing both development and the gap simultaneously to achieve sustainable and inclusive digital growth.
Discussion
We initiate an integrative lens that facilitates a more nuanced analysis on URD, treating urban and rural areas as a continuum and integrating positive development with negative gap. Subsequently, we portray the evolutionary process of URD and introduce a groundbreaking D-G-I framework for assessment. Our research shows that URD in China is gradually evolving from divide to inclusion, yet challenges still remain. On the positive side, three findings are revealed: 1) the development advances and the gap narrows; 2) the rising integration provides strong evidence for URD moving towards inclusion; 3) urban-rural digital inequality on an intra-provincial scale is continuously being overcome and dissolving. Corresponding to the conclusions of ref. 15, our results emphasize the presence of digital divide while tempering excessive concerns surrounding it. We assert that the digital divide is a phenomenon inherent in the process of digital development57, yet not causally related to an increase in digital development. But on the flip side, three main challenges persist: 1) coexistence of high development and high gaps is discovered in some provinces; 2) digital application is not yet well integrated; 3) region disparity relating to URD on the inter-provincial scale emerges.
When China first embarked on its digital journey, the digitization process was in its popularization stage and progressed slowly across the country. This stage concentrates on construction of information infrastructure and availability of digital tools, relying on the supply-side policies led by government58,59,60. Early policies favored the eastern provinces, prompting them to be the initial recipients of digitization. Being a foreign technology, digital infrastructure was also more readily adopted by these provinces. Additionally, the rapid urbanization and rural revitalization61,62,63 in these developed regions fostered more coordinated urban-rural relationships, enabling almost simultaneous digitalization of similar quality across urban and rural areas. Unfortunately, undeveloped provinces faced significant urban-rural inequalities, leading to uneven digitalization and exacerbating the digital divide. Consequently, disparities in URD emerged not only within provinces but also between them.
During the period of digital application, China’s urban-rural relations entered a new phase of integrated development, with gradual improvements in urban-rural and digital policies61,64. Digital diffusion became more equitable within a more harmonious urban-rural context. However, digital applications are influenced by a broader range of factors beyond policy. While top-down digital policies implemented by governments can promote comprehensive digital infrastructure coverage and bridge the access gap, applications generally rely on bottom-up feedback, posing more challenges for the government25. For example, individual digital awareness and attitudes play a significant role in the digital divide65, and rural areas may struggle to keep pace with urban centers66. Thus, digital applications are not yet well integrated due to their inherent complexity. The unsustainable pattern of high development coexisting with high gaps is particularly evident during the application stage, especially in provinces that lead in digital development and have deeper application.
The underlying causes of URD’s differences are worthy of attention. We find that the difference within province decreases, yet the difference between provinces increases. Why do some provinces rapidly develop while others are slow in the evolutionary process of URD? Why do most provinces show a reduction in the gap, while some still face challenges in controlling the accumulation of disparities? To address these questions, we need to think the key drivers affecting URD. The differences in these drivers result in the URD’s difference on any scale. We discuss the key drives from four facets (Supplementary Fig. S1): policy, social-economic factors, social-demographic factors, and individual factors.
Firstly, as the most significant factor, policy directly determines when, where, and how digitalization is implemented. China had a “love-hate” feeling towards Internet in the 1990s at first. Such a hesitation causes China to miss a window of opportunity to leapfrog over the Internet development stages67. Nevertheless, the importance of ICTs was recognized in the 2000s, and the “broadband” was officially included in the Tenth Five-Year Plan (2001–2005), along with the promulgation of the Key and Specialized Planning of Tenth Five-Year Informatization Plan58. Urban areas typically favored by policy access ICTs before rural areas, resulting in an urban-rural digital divide. The effectiveness of policies also depends on how they are made and implemented. Tailored digital policies and effective implementation benefit regions, while unsuitable policies and slow implementation may hamper development. Thus, regions that seize the moment, are favored, and know how to promote digitalization can benefit in the digital era, while others fall behind.
The driving role of policy has been revealed. Digital infrastructures, associated with the access of ICTs, are widely recognized as public goods59, and the development of these infrastructures is decided by government policy. For example, the “Broadband China” pilot policy serves as a criterion for differentiation in DID analysis68,69. It is agreed that the government should play a role in the development of broadband58,59. In addition to access, policy also impacts usage and outcome. For instance, Zhejiang is ahead of most provinces in our assessment and is widely acknowledged as a leader in E-commerce because it has implemented many digital policies for the digital economy, such as the 14th Five-Year Plan for the Development of the Digital Economy. Studies on Sichuan explore a government-operator cooperation pattern of rural digitalization, discussing the role of policy and government25,26.
Secondly, social-economic and social-demographic factors are common drivers for URD70,71. There are correlations between URD and these factors. Scholars have pointed out profit-based discrimination, revealing that telecom carriers choose to enter profitable areas44, such as coastal cities with high GDP and dense populations. Unfortunately, this profit-based discrimination negatively impacts access for remote and rural areas. For usage and outcomes, a positive impact of education on digital skills has been proven70,72, ensuring beneficial usages of ICTs and effective outcomes from digital tools. Developed education leads to human and social capital, crucial for digital enterprises to generate digital outcomes. Moreover, the income73 and the age74 are also significant factors. The former determines affordability of digital equipment and services, while the latter influences efficiency in receiving information and new technologies. Thus, socio-economic and socio-demographic factors drive URD development, and their differences lead to differences in URD.
Third, individual factors have been discussed in recent studies. Some scholars suggest that digital inequality exactly lies in the quality of support that individuals access75. Factors such as gender76, age74, and awareness65 drive individuals’ choices to use ICTs and their proficiency in doing so. Individual motivations and needs for ICTs are also explored71. Due to the dynamic nature of digitization, new digital divides may arise at the individual level. Although factors from a micro perspective have attracted attention, digital differences caused by individual differences deserve in-depth study.
For the three pitfalls founded by us, we propose tailored policy recommendations for URD towards improvement. Firstly, promote the urban-rural integration. The urban-rural digital divide is not only a digital issue but also a consequence of segmentation in urban-rural development. Long-standing inequalities across multiple metrics between urban and rural areas are the key causes. Therefore, a policy framework advocating coordinated development between urban and rural areas is required. Secondly, implement the digital literacy programs. Our research highlights the necessity of focusing on the integration of digital applications. Collaborative initiatives between government entities and private companies should be facilitated to implement education and training programs, with a special focus on rural areas77. Lastly, facilitate the regional coordinated development. Attention should be paid not only to the intra-provincial scale but also to the inter-provincial scale. Efforts should be made to narrow the disparity between digitally developed provinces (e.g., East China) and less digitally developed provinces (e.g., West China), fostering more harmonious and equitable digital inclusion across diverse geographical scales. Coordinated regional development can be achieved through two steps: improvement within each province and coordinated development across regions. Further details on how to specifically implement these policy recommendations can be found in the Section 3 of Supplementary Information.
This work is the first attempt to employ an integrative perspective for a more nuanced understanding and introduce a novel framework for assessment. Although analysis on a smaller scale may be more desirable, a provincial scale is used by us. The reality is that most national geographic or statistical coverage in China, especially for rural areas, is undertaken on the provincial scale. Choosing a smaller scale would result in incomplete data, such as the absence of rural data. So, we trade off the accuracy of assessment against the scale and make concessions in the choice of scale. The limitation is acknowledged but actually has little impact on the core issue of this paper, namely, how URD performs. Secondly, key factors affecting URD and reasons for the differences have been discussed but we have not measured these using models. This paper serves as a first step to clarify the state of URD and reveal the challenges. The underlying causes should be discussed based on the discovery of phenomenon. An accurate assessment of URD is our first trial and quantitative study on factors will be reflected in our future research. Additionally, the dynamic nature of digitalization suggests potential future shifts in URD. While this paper does not address new forms of the digital divide, it considers the dynamic nature observed so far and explores the evolution process and dynamic assessment.
In addition to our current efforts, some avenues for future research can still be offered. For example, an empirical study of factors and mechanism should be done. It will support our discussion in this paper and add a more critical examination. Studying digitization on a smaller scale is also a promising direction, which requires efforts to collect finer data. Despite these rooms for improvement, our study fills an existing research gap, provides scientific support for policy, and serves as a foundation for future research.
Methods
Conceptualizing the process of urban-rural digitalization
Policymakers, stakeholders and disadvantaged communities need a clear understanding of the state of URD to rethink the true impact of digitalization on urban and rural areas. We delve into URD through an integrative lens, integrating the city with the village and considering both development and gap. Fig. 1 clearly illustrates an evolutionary process of URD from this integrative perspective. Digitalization impacts urban and rural areas with mobility, attachment, enhancement, and timeliness, embedding ICTs across breadth and depth of interaction. On the one hand, digital empowerment awakens resources, especially left in villages. On the other hand, ICTs unblock pipes to fortify links and facilitate interactive flows between urban and rural areas. With deep penetration, digitalization transforms from an external force to an internal element of urban-rural areas. According to Diffusion of Innovations Theory (DOI)78 and diffusion feature of new technologies79,80, digitalization progresses through stages of popularization and application. The initial stage addresses whether to adopt ICTs, while the subsequent stage focuses on how to use them. So, the evolutionary process of URD in Fig. 1 is divided into these two stages.
As discussed in the Introduction, URD exhibit two states: the inclusion and the divide. Inclusion is marked by sustainable development, weak gaps and high integration, whilst divide is characterized by unsustainable development, huge gaps and low integration. On the positive side, moving towards inclusion means a sustainable and coordinated advancement in URD. Conversely, moving towards a divide represents urban-rural inequality in the digital dimension, known as the first-order divide (i.e., access gap), the second-order divide (i.e., usage gap), and the third-order divide (i.e., outcome gap). Taking into account that city and village are usually characterized as the core and the periphery respectively, URD shows a state of divide without intervention at first. Then it experiences a trajectory from the divide to the inclusion. Within this evolutionary progression, gap is narrowing but development is enhancing. As a result, digital divide evolves into digital inclusion, including the full coverage of information facilities, the equalization of usage efficiency and the reciprocal digital dividends.
Fig. 1 depicts the dynamic evolution and the state for URD. URD is not a simple binary Good/Bad object. Rather, it is a dynamic process with observable static manifestations. Some studies have focused solely on static performance, but static performance alone cannot determine the state of URD, as the dynamic trend may show progress. Similarly, scholars have either praised developmental benefits or overly emphasized inequality, overlooking the coexistence of development and gaps in URD. We reconsider URD as a dynamic process characterized by multiple dimensions (i.e., development, gap, and integration). This paper offers a comprehensive understanding and a detailed portrayal of URD. Furthermore, it contributes to broader research on digital disparities81 in the urban-rural context.
Establishing a theoretical framework (D-G-I) for assessment
A theoretical framework of Development-Gap-Integration (D-G-I) is proposed (Fig. 2) on the basis of theoretical discussion above, aiming to assess URD. In Fig. 1, there are three axes that demonstrate performance, including development, gap and integration. “Development” reflects the overall level within urban-rural areas, whereas “Gap” reflects the level of inequality between urban and rural areas. “Integration” is a comprehensive measure to judge the state, quantified by the static level and the dynamic trend of “Development” and “Gap”. Figure 2a illustrates level and trend of each dimension in the D-G-I framework. For inclusion state, level of development is higher than level of gap. Conversely, level of gap is higher than level of development for divide state. It should be noted that not only static level but also the dynamic trend of ascent or descent can demonstrate URD. Hence, static and dynamic performances are both employed. In the case of inclusion, there is an upward trend of development and a downward trend of gap. However, if URD moves towards the divide, level of gap rises and level of development falls. For the integration, the level is high in inclusion state but low in divide state. As URD evolves from divide to inclusion, there is an increasing trend of integration.
A methodological road-map is designed to conduct the assessment (Fig. 2b). We first construct a two-stage and two-dimension evaluation index system. Then we measure levels of development and gap as the static performance. The rates of development and gap are also employed to estimate trends as the dynamic performance. The level of integration is calculated through the static and dynamic performances. According to the conceptual foundation, there are two directions, including the digital divide and the digital inclusion. We can judge the state of URD through the level and trend of integration.
The first step of assessment is to build a sound theoretical framework, guiding the inclusion of right variables and proper models. Our framework concentrates on development and gap, which are generally segmented in preceding literature. Also, we divide URD into two stages to evaluate them separately. This two-stage evaluation can capture the specific performance in each stage, compensating for a lack of overlooking dynamic nature of URD in previous studies. Thus, corresponding theory-driven variables are selected and an appropriate evaluation system is constructed. Besides selection of right variables, the proper model should be carefully employed. In our study, static level and dynamic trend are considered together in order to reveal the comprehensive performance and true state.
We advance the methodology through the novel lens. From preceding research, there are four statistical methods to measure the digitalization in any unit of observation: simple bivariate, multivariate modeling, compound indices, and time-distance methodology51. However, all the methods prevailing in existing studies have limitations and may be not sufficient. Although some standard methodological problems are inevitable, minimizing potential shortcomings is extremely significant for empirical research. Due to the complexity of digitalization, measure about digital subjects should be carefully conducted in a multivariate setting. Our framework offers a more complex insight and a novel methodological approach into digital studies, integrating multiple factors. The method, guided by our framework, incorporates advantages of preceding methods. For example, by simultaneously considering multiple variables we can effectively avoid the oversimplification of bivariate analysis. We also analyze on proper time-distance observations, ensuring the comparability of findings.
Evaluation of URD performance
We construct a comprehensive evaluation index system of URD (Fig. 8 and Table 1). The index system reflects not only the development but also the inequality between city and village. As generally agreed in academic literature, digitalization does not pertain merely to digital category but also is socially shaped51. So, we considered the digital content and also valued the social or economic resources in the selection of indicators. Meanwhile, trade-off between indicator and scale is an acknowledged challenge16 due to the availability of digital data. A restrictive selection for indicators is conducted because index should be as national as possible for every province. Importantly, the criteria of index selection (i.e., scientific, comprehensive, general, comparative, practical) needs to be strictly followed.
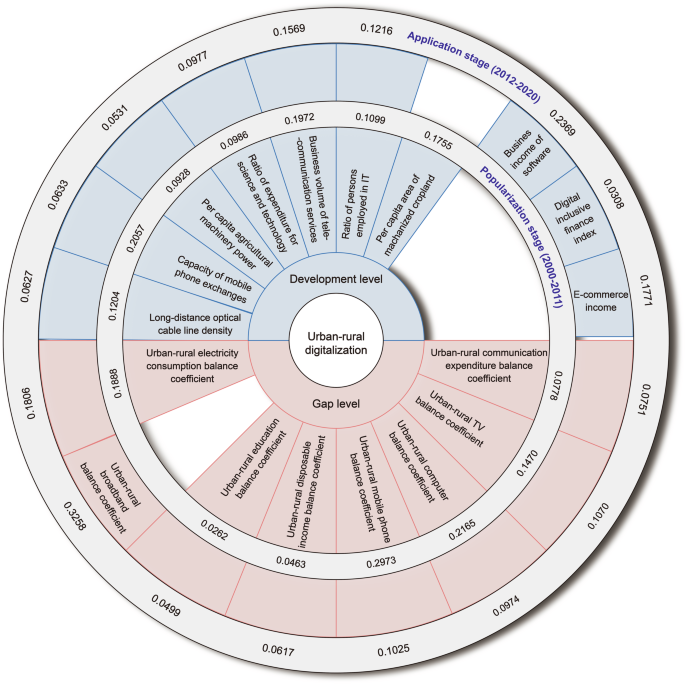
The sector of the indicators included in both stages extends from the 2000–2011 circle to the 2012–2020 circle, the sector of the indicators only included in the first stage is wrapped to the 2000–2011 circle, and the indicators only included in the second stage are between the two circles. The numerical values represent the weights of indicators.
Given the characteristic of two stages and evolution of China’s digital policy, we chose 2011, the transition year between China’s 11th and 12th Five-Year Plan, as the cut-off point to distinguish popularization (from 2000 to 2011) and application (from 2012 to 2020). Because digitalization was still in its infancy from 2000 to 2011 and deepened into urban-rural areas in policy after 2011. Indicators of every stage differ slightly according to the different foci. Finally, 18 indicators were selected to precisely demonstrate URD. More detailed information on reasons for the choice of indicators can be found in the Table 2.
We used Entropy Weight Method to determine weights of indicators and Linear Weighted Method to calculate the levels of development and gap:
Where (X) is the indicator matrix and there are (m) indicators in (n) zones; ({x}_{{ij}}) is the value of indicator (j) in zone (i). In this study, (m=18) and (n=30).
To eliminate magnitude and measurement of different data, the maximum difference normalization model is adopted to standardized the data.
Where ({X}_{{ij}}) is the value of indicator after normalization; ({N}_{{ij}}) is the value after panning the normalized value; (max {x}_{{ij}}) is the maximum value of the ({j}_{{th}}) indicator in zone (i); (min {x}_{{ij}}) is the minimum value of the ({j}_{{th}}) indicator in zone (i).
Where ({P}_{{ij}}) is the weight of ({i}_{{th}}) datum to all the data of the ({j}_{{th}}) indicator; ({e}_{j}) is the entropy value of the ({j}_{{th}}) indicator; ({g}_{j}) is the redundancy of information entropy; ({W}_{j}) is the weight of the ({j}_{{th}}) indicator.
Where ({L}_{D}) is the level of development; ({L}_{G}) is the level of gap and seen as a negative index in Eq. (10); (Lleft(D,Gright)) is the static performance of URD.
Then the rates of development and gap are calculated through the level.
Where ({R}_{D}) is the rate of development; ({R}_{G}) is the rate of gap and seen as a negative index in Eq. (13); ({L}_{D}^{{k}_{2}}) is level of development in the ({k2}_{{th}}) year, ({L}_{D}^{{k}_{1}}) is level of development in the ({k1}_{{th}}) year; ({L}_{G}^{{k}_{2}}) is level of gap in the ({k2}_{{th}}) year, ({L}_{G}^{{k}_{1}}) is level of gap in the ({k1}_{{th}}) year; (Rleft(D,Gright)) is the dynamic performance of URD.
Finally, the level of integration is calculated in Eq. (14).
Mann-Kendall trend test
Mann-Kendall trend test is applied to measure the long-term changing trend of URD. As a non-parametric method, Mann-Kendall trend test does not specify whether the data are normally distributed or non-normally distributed and has low sensitivity to outliers. So, this method is robust for detecting the trend of time series.
In the null hypothesis ({H}_{0}), time series data ({(X}_{1},ldots ,{X}_{n})) are a sample of (n) independent and random variables with the same distribution. In the alternative hypothesis ({H}_{1}), there is an increasing or decreasing trend in the time series. The (S) can be calculated as follows:
Where (n) is the length of time series; ({X}_{j}) and ({X}_{i}) are observations of time series (j) and (i) ((i, <, j)), respectively.
The standardized test statistic (Z) is calculated as follows:
Where (m) is the number of nodes in time series; ({t}_{i}) is the width of the node. A positive (Z) indicates an upward trend and a negative (Z) indicates a downward trend. ({H}_{0}) can be rejected when (left|Zright|,gg, {Z}_{1-alpha /2}) (significance level (alpha) = 0.05) and the trend of time series is considered to be significant. ({H}_{0}) can be accepted when (left|Zright|,ll, {Z}_{1-alpha /2}) (significance level (alpha) = 0.05) and the trend is considered to be insignificant.
Spearman’s rank correlation test
Spearman’s rank correlation test can depict the correlation between variables and we used it to portray the spatial structure of URD. It measures the response of the sample to the corresponding ordering and is insensitive to outliers. We implemented this test in R and the formulas are as follows:
Where ({d}_{i}) is the rank difference of observations; (n) is the total number of observations.


Responses