Using historical U.S. copper data to consider future copper recovery from post-consumer electronic waste

Introduction
Copper is by no means a new or exotic material, dreamed up in the laboratories of scientists. It is in fact a very old metal, employed since antiquity1. Nevertheless, it is a key metal to enable a decarbonized future and much has been written projecting future copper demands2,3. However, in order to truly understand the future and its environmental and economic implications, it is necessary to first look to the past. This work seeks to present a view of the historical evolution of copper consumption in the USA, which then can be used to inform if and how a more ambitious pursuit of circular copper usage is warranted.
Copper is crucial to enable the transition to a decarbonized future. This is largely due to its role in critical technologies and infrastructure2. However, copper production is not without environmental, economic, and societal costs of its own. Typically, the most efficacious manner in which to reduce these burdens is by keeping already mined and refined copper in circulation3. However, given the projected copper demand, due to continuing population and economic growth, there will be continued increasing requirements for primary metal production4. Beyond that, some uses of copper such as copper containing pesticides are dissipative in nature, meaning that they are unable to be cycled in the economy due to the nature and goals of their use5. The environmental impact of mining virgin copper ranges from 5.34 to 7.33 kg of CO2e per kg of refined copper dependent on method6, while recovered or secondary copper has an estimated environmental impact of 1.58 kg of CO2e per kg of refined copper6. Due to projected increases in the demand for copper it is estimated that the associated carbon footprint of copper will increase between 100–200% between 2010 and 20506. However, depending on the quantity of copper, the nature of its use, and the matrix it is embedded in, it may not be environmentally nor economically advantageous to recover the copper. At the same time global copper reserves are currently estimated at 2.1 billion tons of copper, with an estimation of undiscovered resources at 3.5 billion tons7. However, not all of this copper is easy to mine and refine. This work seeks to examine the history of copper consumption, largely in the USA, in order to generate insight into future copper consumption and its sustainability implications. Then it seeks to explore the potential of consumer electronic waste as one source of future copper and discuss the conditions under which this might occur, in particular considering the current European Union WEEE Directive.
Results
Copper is a critical technological element in industry, with an increasingly important role in the transition to a low carbon economy.
Historical copper production
Copper production has increased significantly over time, at both the global and USA levels. Figure 1a presents the upward trend of global copper smelter production, which has increased by almost a factor of 40 since 1900 and is expected to continue to increase8. Figure 1b presents USA primary copper smelter production, which has increased significantly since 1845, and appears to have reached its peak in 1973. That does not necessarily imply that copper usage has decreased in the USA since that time, just simply primary production by smelting. Secondary USA copper production from post-consumer scrap has also decreased in recent years, although in 2023 post-consumer secondary copper accounted for 33% of the USA copper supply7. Smelting is the process by which copper-sulfide ores are processed into copper metal through the use of a furnace. More recently, copper is often first concentrated prior to smelting due to the decreasing ore grades of copper available. This has led to an increased energy cost to mining and refining copper in the earlier stages, but not in the later stages as the copper is first concentrated to a particular grade prior to smelting9.

a Global15,20,21,22,23,24,25,26,27,28,29,30,31,32,33,34,35,36,37,38,39,40,41,42,43,44,45,46,47,48,49,50,51,52,53,54,55,56,57,58,59,60,61,62,63,64,65,66,67,68,69,70,71,72,73,74,75,76,77,78,79,80,81,82,83,84,85,86,87,88,89,90,91,92,93,94,95,96,97,98,99,100,101,102,103,104,105,106, and b US primary and secondary copper production from post-consumer scrap from 1845 to 2023 [Note a Data for 2019 and beyond is listed for global copper refinery production, as smelter data was not readily available. Note b for the years 2000–2010 the USGS reported both primary and secondary copper production using combined figures in their reports]15,20,21,22,23,24,25,26,27,28,29,30,31,32,33,34,35,36,37,38,39,40,41,42,43,44,45,46,47,48,49,50,51,52,53,54,55,56,57,58,59,60,61,62,63,64,65,66,67,68,69,70,71,72,73,74,75,76,77,78,79,80,81,82,83,84,85,86,87,88,89,90,91,92,93,94,95,96,97,98,99,100,101,102,103,104,105,106.
Price of copper
The price of copper has also changed with time. The price of copper, in 2024 USA dollars (USD) has deceased over time, as presented in Fig. 2, when considering the time span from 1850 through 2024. Although the quality of ore smelted in the USA has decreased, and thus the energy required to obtain usable virgin copper has increased, the inflation adjusted price of copper has decreased over time. This is in part due to evolutions in mining technologies that allow for recovery of a greater percentage of copper. In the more recent past the price of copper has increased, climbing in a generally upward direction since about 2006. As of 2022 there is a fear in the popular media regarding potential copper shortages through the next few years in particular due to increased demand for decarbonization applications and political unrest10.
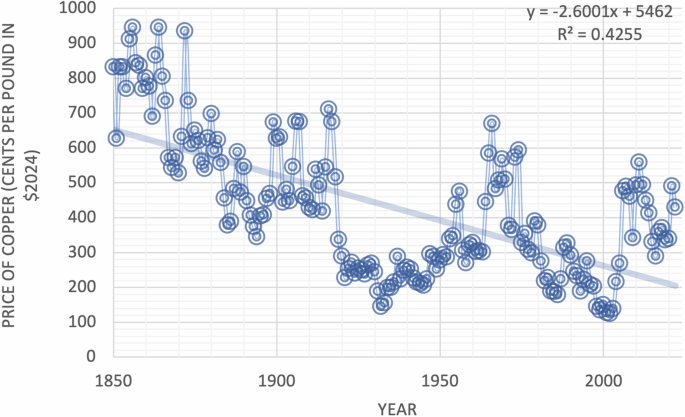
Cost of copper adjusted to 2024 USD informed with data from10,15,20,21,22,23,24,25,26,27,28,29,30,31,32,33,34,35,36,37,38,39,40,41,42,43,44,45,46,47,48,49,50,51,52,53,54,55,56,57,58,59,60,61,62,63,64,65,66,67,68,69,70,71,72,73,74,75,76,77,78,79,80,81,82,83,84,85,86,87,88,89,90,91,92,93,94,95,96,97,98,99,100,101,102,103,104,105,106,107,108,109,110,111.
Available grade of copper ore
The average primary copper ore grade produced in the USA has decreased over the last century as a function of continued mining, which has also led to a corresponding increase in the energy required for mining and beneficiation facilities (Fig. 3). As primary available ore grade continues to decrease the energy required to make that ore into useful copper continues to correspondingly increase9, the question arises as to when the primary copper industry will run into the mineralogical barrier. This barrier as expressed by Skinner11, and defined as when the rock would need to be pulled apart chemically in order to gain resources such as copper, instead of mining ore itself, is becoming an increasingly relevant question. Essentially considering when the grade of ore has declined to the extent that it is necessary to move primarily from conventional mining and refining practices to chemical dissolution in order to access the copper. It also introduces the question as to whether copper based waste which was not previously considered economically feasible to mine at different points in history (such as tailings and e-waste containing copper), will become viable sources of copper feedstock. Essentially, when does the energy and corresponding environmental impacts of copper become costly enough where it is more environmentally and economically efficient to mine old wastes or spent electronics?
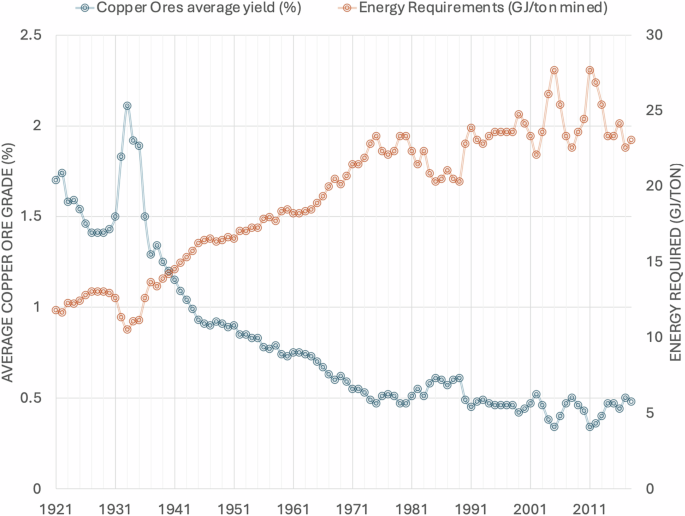
US average copper ore produced per year compared to energy requirements for refining and mining the ore, using data adapted from20,21,22,23,24,25,26,27,28,29,30,31,32,33,34,35,36,37,38,39,40,41,42,43,44,45,46,47,48,49,50,51,52,53,54,55,56,57,58,59,60,61,62,63,64,65,66,67,68,69,70,71,72,73,74,75,76,77,78,79,80,81,82,83,84,85,86,87,88,89,90,91,92,93,94,95,96,97,98,99,100,101,102,103.
Mining spent consumer electronic waste for resources is not a new idea12,13. Figure 4 presents the copper content, expressed in percent mass, of different small post-consumer electronics. This is compared with the energy embodied in the copper from mining and beneficiation when that same grade of ore would be mined from virgin stocks. This is not the energy required to recover the copper from these materials, as that has the potential for significant variability, nor the energy required to collect and aggregate the materials, but simply the minimum amount of energy would need to be spent if virgin ores of this same grade were mined. This is at best a significant simplification; however, it allows for the consideration of energy that would need to be spent to mine comparative virgin ores, and suggests that if the embodied energy required is less than what is shown in Fig. 4, that there is the potential for significant benefit if copper is recovered from spent electronics. As of 2018 the average copper ore processed in the USA had a yield of 0.48%. This is significantly lower than what is available in several categories of spent electronics: batteries (12.98 ± 10.61%), smartphones (27.83 ± 13.87%), cellphones (36.25 ± 6.52%) and printed circuit boards (PCB) (15.86 ± 9.86%).
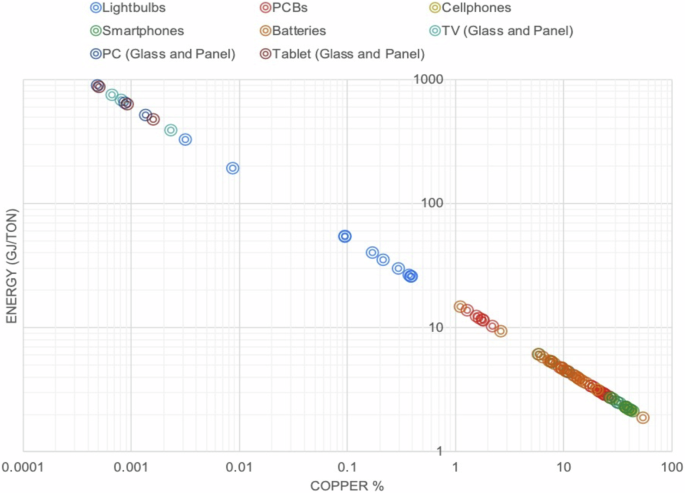
Required embodied energy to mine and refine copper ore at the grade found in consumer electronics by percentage mass. Using data adapted from124,125,126,127,128,129,130,131,132,133,134,135,136,137, and presented on a log scale.
Recent work by Zeng et al.12 found that in China recovering copper from spent urban electronics could be completed at economic costs that were at least comparable to those of virgin mining.
Considering the evidence presented of increasing demand, rising price, and increased energy demand for producing virgin copper, this suggests merit for considering spent electronics as a source of post-consumer secondary copper in more detail.
Copper & waste electrical electronic equipment (WEEE)
In the USA context there is currently a lack of federal legislation around the handling of electronic wastes, although there are policies around certain hazardous components such as the Resource, Conservation, and Recovery act of 197614. Due to a lack of federal USA laws around electronic waste management, much of what exists is at a state level and is somewhat disaggregated. Looking to the current guidance in the European Union (EU) provides insight as to the potential policy frameworks which would encourage the recovery of copper from electronics at the end of their life in the USA at a federal level. In the EU, the collection and treatment of equipment at end of life is regulated by the WEEE Directive which sets collection and recovery targets for these items, details selective treatment steps, and determines physical and financial responsibilities for such activities in EU member states15.
These targets are mass based and as such do not consider the efficiency with which elements of strategic importance are produced from the recycling process. Therefore, a reasonable criticism of the WEEE Directive is that it leads to the optimization of recycling systems to collect larger items such as washing machines and dryers, and recover bulk materials including steel, aluminum, and plastics with little consideration of more critical elements which are present in smaller quantities.
For example, while washing machines contain significant quantities of copper in their motors, wiring harnesses and printed circuit boards, as there is no specific treatment step which requires these to be separated from the rest of the washing machines, it is likely that they are often included in the steel recycling stream which renders the copper unrecoverable. Without such selective treatments being legally required as part of a compliant recycling process, it is only in the situation where it would be profitable to do so that such an activity might take place. This can be very difficult to achieve given the cost of the manual labor required, the price of copper at the time, and product designs which do not facilitate simple liberation of the copper containing components from the rest of the washing machine. Table SI-5 presents data from copper recovery in the informal recycling economy from recyclers who disassemble washing machines for their component metals to generate revenue. It is estimated that the copper content of a washing machine can vary from 170 g to 1600 g. The majority of copper is often recovered from the motor, and the copper content of the motor may vary based on whether the motor is comprised of copper or aluminum windings, which cannot be determined in advance of dismantling.
To consider the potential recovery of any specific element from a recycling process, it is necessary to examine the (1) collection rate, (2) nature of the pre-treatment process, and (3) availability of end processing technology for this element. A recycling system that was designed to maximize the return of copper would develop targets which necessitated (1) the collection of copper rich products which (2) were required to be dismantled in a way that channeled the copper containing components to a (3) highly efficient copper recovery process.
Using the data in Fig. 4 combined with sales data to create product specific collection targets, combined with copper specific selective treatments would change the landscape for copper recovery from used electrical and electronic equipment.
Discussion
The complexity and concentration of how copper is used has changed over time. Initially copper was used in larger segments, however, with time it has been employed in lower concentrations dispersed through products. This advancement makes it more challenging to recover copper, and introduces the question of when it is environmentally and economically beneficial to recover the copper from spent consumer products compared to mining virgin copper. An increased copper demand due to electrification coupled with a decreasing ore grade presents an opportunity to extend the current copper supply through the recovery of copper from electronic waste. There are however, multiple challenges associated with recovering copper from spent electronic waste, not only limited to the complexity of the materials themselves from which the copper would be recovered.
Collection of a sufficient volume of spent electronic devices is one challenge in recovering copper from electronic waste at scale. There is potential for some incentives, particularly in the USA context, to increase participation in collection schemes. Batteries, and in particular conventional lead acid batteries often utilized in automobiles, are sold using a deposit system in the USA. This has been effective in making them the most recycled post-consumer product in the USA, with an effective recycling rate of 99%15. Many of the states require a deposit which varies by state but is often in the realm of $10 in order to incentivize the return of used vehicle batteries, and this is often conducted at the point of sale for new vehicle batteries16. Smartphones and cellphones present a growing potential for copper recovery due to their ubiquity in society and relatively short lifespans. At the same time, collection programs will need to be incentivized and easy to use in order to collect these devices. The collection of these post-consumer products is achievable in the USA if they are properly incentivized.
Copper is of course not the only metal present in post-consumer electronic waste. Althaf et al.17 present a very thorough review of electronic waste generation and composition in the USA. They note current challenges with lack of recycling infrastructure for many of these products. There is the potential to recover multiple valuable metals from a single type of stream, such as lithium from batteries as well as copper. Although this complicates the recycling process, the potential to recover multiple streams has the prospect to increase the economic viability of materials recovery while reducing the environmental cost. In mining practice multiple metals are often recovered due to the composition of the ores which are mined. Although it is possible to find pure copper ore, that is not typical. More often copper is found in complex ores mixed with nickel, zinc, and lead8,18. And when the copper is refined the other metals are as well into commercially viable products.
The recovery of secondary copper from spent electronic sources will become more critical as uses of copper expand, in particular with the transition to a decarbonized economy. In the USA context, He and Small18 estimated the future demand for copper based on scenario analysis and stock demands, and found a growing future demand. They also found that 34–39% of future copper demand could be met by recycling 43% of domestic end of life copper. In their work they also project that between 2016 and 2070, landfilled spent copper would comprise between 8% and 9% of major copper sinks. At the same time Seck et al.19 assess the impact of copper availability on the anticipated decarbonized energy transition, specifically around transportation and electrification. They found that between 78% to 94% of known copper resources in 2010 would need to be extracted between 2010–2050 to meet copper demand for these technologies. This further supports the need to consider recovering copper from spent electronics and other sources in order to meet the growing copper demands of technology. Beyond that, there is also the potential to reduce the environmental impacts and economic costs by recovering secondary copper instead of mining virgin materials with dwindling ore grades.
Methods
Historical copper data is mined from reports by the United States Geological Survey (USGS)10,15,20,21,22,23,24,25,26,27,28,29,30,31,32,33,34,35,36,37,38,39,40,41,42,43,44,45,46,47,48,49,50,51,52,53,54,55,56,57,58,59,60,61,62,63,64,65,66,67,68,69,70,71,72,73,74,75,76,77,78,79,80,81,82,83,84,85,86,87,88,89,90,91,92,93,94,95,96,97,98,99,100,101,102,103,104,105,106,107,108,109,110,111.
It should be noted that the numbers differed or were later revised in some of the reports. And thus, there is some uncertainty around the exact numbers reported. In general, when this occurred the revised reported number was included in the data collected. If this was unclear, then the value presented with more precision was maintained. Raw data is presented in the SI in tabular form.
Price of copper
The economic cost of copper is calculated from the cost as presented in the USGS.
Reports10,15,20,21,22,23,24,25,26,27,28,29,30,31,32,33,34,35,36,37,38,39,40,41,42,43,44,45,46,47,48,49,50,51,52,53,54,55,56,57,58,59,60,61,62,63,64,65,66,67,68,69,70,71,72,73,74,75,76,77,78,79,80,81,82,83,84,85,86,87,88,89,90,91,92,93,94,95,96,97,98,99,100,101,102,103,104,105,106,107,108,109,110,111. In particular using the London Price Average Cents per pound as reported. In some of the earliest price reports, the copper price is simply provided without further reference. Historical series data was used to convert the dollar values to 2024 equivalents from earlier years112,113,114,115,116,117,118,119,120,121,122,123. Exact conversions may be found in the SI.
Energy consumption of copper mining and energy embodied in electronic waste copper
The relationship between copper ore grade and the energy needed for the production of usable copper has been modeled previously using the equation6:
Where E, the gross energy requirement, is expressed in GJ/metric ton of mined copper as a function of the ore grade (% copper ore). This is applied to the average annual US ore grade obtained from the annual USGS reports20,21,22,23,24,25,26,27,28,29,30,31,32,33,34,35,36,37,38,39,40,41,42,43,44,45,46,47,48,49,50,51,52,53,54,55,56,57,58,59,60,61,62,63,64,65,66,67,68,69,70,71,72,73,74,75,76,77,78,79,80,81,82,83,84,85,86,87,88,89,90,91,92,93,94,95,96,97,98,99,100,101,102,103
The same methodology was applied for the energy embodied in the copper e-waste. The data was adopted from published studies which characterized the quantity of copper in various e-wastes124,125,126,127,128,129,130,131,132,133,134,135,136,137. The data set compiled may be found in the SI.


Responses