Using network analysis to understand the association between menopause and depressive symptoms

Introduction
The menopause is a natural biological process that signals the end of a woman’s reproductive years, resulting from a decline in ovarian follicular function1 (please note, throughout the current study we use the term woman to refer to anyone assigned female at birth). Typically occurring between the ages of 44 and 552, it is officially recognised when a menstrual period has not occurred for 12 consecutive months, at which point it is referred to as the post-menopause. The phase leading up to the post-menopause is called the perimenopause and is estimated to last for a median of four years3. The post-menopause, and particularly the menopause transition, appears to heighten susceptibility to mental health issues4, particularly depression5,6. An increased risk of depressive symptoms during the perimenopause has been consistently demonstrated (see ref.7 for a meta-analysis). Notably, it has been proposed that depressive symptoms occurring throughout the menopause may be linked to specific menopause symptoms8.
When examining clusters of menopause symptoms, vasomotor symptoms are frequently associated with depressive symptoms in women in the menopause5,9,10. In fact, women experiencing moderate to severe depressive symptoms are nearly twice as likely to report vasomotor symptoms compared to those with no or mild depressive symptoms11. This suggests a potential aggravating effect of vasomotor symptoms on depressive symptoms12,13, although some propose that depression precedes hot flushes rather than being caused by them14. In addition, a limited number of studies have explored the impact on sexual health and libido during the menopause and observed a significant association between sexual symptoms and depression15,16. Taken together, these findings suggest that clusters of specific menopause and depressive symptoms may be more likely to co-occur than others.
Notably, previous studies have merely examined the severity and prevalence of menopause and depressive symptoms using summed scores and/or individual item scores, as opposed to understanding how these symptoms interconnect and overlap. In this regard, network analysis can offer a powerful framework for understanding the structure and behaviour of interconnected symptoms. Network analysis also allows for the identification of highly ‘central’ or influential symptoms, defined by having, on average, strong connections to other symptoms. When a highly central symptom is activated (i.e. a person reports the presence of the symptom), it will influence other symptoms to become activated as well, maintaining the symptom network. Beyond being a method with which to visualise the connections between symptoms, this analysis method can be valuable in identifying which symptoms are candidates for therapeutic interventions17.
To our knowledge, only one study has utilised a network analysis approach and applied it to a menopause population18, with the aim of understanding the network structure of menopause symptoms as measured using the Menopause Rating Scale (MRS19), which includes 11 items. The findings of this research demonstrated that psychological symptoms, particularly anxiety and depressive mood, should be considered as core symptoms of the menopause. Furthermore, sexual symptoms, such as vaginal dryness, were also seen to be core symptoms of the menopause, while vasomotor symptoms, including hot flushes and night sweats, were less important in maintaining the network structure, despite being considered cardinal symptoms of the menopause experience20.
Importantly, given the wide range of menopause and depressive symptoms, incorporating a scale specific to depression in a network analysis, namely the Patient Health Questionnaire (PHQ21), will achieve a detailed understanding of the connections between menopause symptoms and a broader spectrum of depressive symptoms. Furthermore, the study by Zhao et al.18 did not examine differences in network structures between perimenopause and post-menopause women, which may have important implications for the identification of candidate symptoms for therapeutic interventions at different stages of the menopause. To this end, the current study set out to explore and visualise the structure and interconnectivity of menopause and depressive symptoms utilising both the Menopause-Specific Quality of Life (MENQOL) Questionnaire22 and the eight-item PHQ21.
Results
Sociodemographic characteristics
Participants’ sociodemographic information across the entire sample and per group, with between-group comparisons, can be found in Supplementary Table 1 (Supplementary Information). A total of 1154 participants commenced the survey, of which 82.50% (n = 952) completed at least 97% of the survey. Of these, 90.13% (n = 858) were either in the perimenopause or the post-menopause. Data from these (N = 858) were analysed. Across the entire sample, the average age was 49.88 (SD = 5.19), with the majority of respondents identifying with the female gender (97.79%, n = 839), being white (97.09%, n = 833), having at least an undergraduate degree (60.37%, n = 518), and being married or in a civil partnership (61.54%, n = 528). 86.25% (n = 740) were employed and 62.82% (n = 539) had a household income of at least £35,001 before tax.
There were significant group differences in age (t(462.69) = −17.10, p < 0.001, d = 4.15), with the post-menopause group being older than the perimenopause group. There were also significant group differences in education level (U = 60647, p = 0.003, r = 0.10), with the perimenopause group being more highly educated than the menopause group. Furthermore, there were significant group differences in the proportion of students (χ²(1, N = 858) = 5.89, p = 0.013, φc = 0.08) and retirees (χ²(1, N = 858) = 11.14, p < 0.001, φc = 0.11), with a higher proportion of women in the perimenopause being students relative to those in the menopause, and more women in the post-menopause being retired in comparison to the perimenopause group. Finally, there was a significant group difference in household income (U = 48892, p < 0.001, r = 0.13), with the post-menopause group having a higher household income than the perimenopause group.
Depressive symptoms (PHQ-8)
Depressive symptoms across the entire sample and per group, with between-group comparisons, can be found in Supplementary Table 2 (Supplementary Information). The internal consistency (Cronbach’s alpha) of the PHQ-8 in the present sample was good (overall: 0.82; perimenopause: 0.82; post-menopause: 0.84). Overall, the most severely rated depressive symptom was fatigue, whilst the least severely rated depressive symptom was slowing down or feeling restless. There were a significant group differences in severity of sleep problems (t(856) = −2.21, p = 0.034, d = 1.02), with the post-menopause group rating these as more severe relative to the perimenopause group. 59.21% (n = 508) of the entire sample met criteria for major depressive disorder (cut-off score of ≥1023;), with a similar proportion of respondents in each group (perimenopause: 59.19%, n = 364; post-menopause: 59.26%, n = 144).
Menopause-specific quality of life symptoms (MENQOL)
A summary of participants’ MENQOL frequency scores across the entire sample and per group, as well as between-group differences, can be found in Supplementary Table 3 (Supplementary Information). The internal consistency (Cronbach’s alpha) of the MENQOL in the present sample was good (overall: 0.88; perimenopause: 0.87; post-menopause: 0.89). Across the entire sample, the most prevalent menopause symptoms were feeling tired or worn out, feeling anxious or nervous, and experiencing poor memory. Regarding the sexual domain, a change in sexual desire was the most prevalent symptom, while night sweats were the most frequently experienced vasomotor symptom.
There was a significant group difference in rates of hot flushes (χ²(1, N = 858) = 22.03, p < 0.001, φc = 0.16), with respondents in the post-menopause being more likely to experience them than those in the perimenopause. There was also a significant group difference in feeling anxious or nervous (χ²(1, N = 858) = 7.13, p = 0.008, φc = 0.09), with a greater proportion of the perimenopause group experiencing this symptom than the post-menopause group. Similarly, there was a significant group difference in being impatient with people (χ²(1, N = 858) = 4.85, p = 0.028, φc = 0.08), with the perimenopause group endorsing this symptom more than those in the post-menopause. There was also a significant group difference in the prevalence of dry skin and weight gain (dry skin: χ²(1, N = 858) = 6.14, p = 0.013, φc = 0.09; weight gain: χ²(1, N = 858) = 5.35, p = 0.021, φc = 0.08). The post-menopause group was more likely to experience these symptoms than those in the perimenopause. There were significant group differences across all sexual symptoms (χ²s(1, N = 858) ≥ 8.77, ps ≤ .003, φcs ≥ 0.10). The post-menopause group was more likely to experience sexual symptoms relative to the perimenopause group.
In terms of symptom duration, 21.56% (n = 185) of all respondents had experienced menopause-specific symptoms for one year or less, while 40.09% (n = 344) had experienced these symptoms between one and three years, and 38.34% (n = 329) had had these symptoms for at least three years. There was a significant group difference in symptom length (U = 41556, p < 0.001, r = 0.35), with respondents in the perimenopause stage having experienced menopause symptoms for a shorter duration of time relative to the post-menopause group.
A summary of participants’ MENQOL severity scores across the entire sample and per group, as well as between-group differences, can be found in Supplementary Table 4 (Supplementary Information). Across the entire sample, feeling tired or worn out, feeling a lack of energy, and feeling anxious or nervous were the most bothersome symptoms. There were significant group differences in severity of hot flushes (t(391.15) = −5.09, p < 0.001, d = 1.99), sweating (t(395.42) = -2.06, p = 0.040, d = 1.83), and total vasomotor symptoms(t(386.61) = −3.72, p < 0.001, d = 1.60), with the post-menopause group rating these as more bothersome relative to the perimenopause group. In terms of psychosocial symptoms, there was a significant group difference in the severity of feeling anxious or nervous (t(417.57) = 2.07, p = 0.039, d = 2.21), with the post-menopause group rating this symptom as more bothersome relative to the perimenopause group. In addition, there were significant group differences in severity for a variety of physical symptoms, namely: decrease in physical strength (t(411.55) = −2.20, p = 0.029, d = 2.19), decrease in stamina (t(422.38) = −2.10, p = 0.037, d = 2.33), dry skin (t(410.19) = −3.08, p = 0.002, d = 2.01), weight gain (t(856) = −2.64, p = 0.008, d = 2.63), and frequent urination (t(423.96) = −2.11, p = 0.035, d = 2.31), as well as total physical symptom severity (t(856) = −2.08, p = 0.038, d = 1.20). The post-menopause group rated these symptoms as more severe than the perimenopause group. There were also significant group differences in severity in all sexual symptoms (change in sexual desire: t(856) = −2.81, p = 0.005, d = 2.49; vaginal dryness during intercourse: t(374.72) = −3.50, p < 0.001, d = 2.15; avoiding intimacy: t(408.41) = -3.90, p < 0.001, d = 2.48), as well as in overall sexual symptom severity (t(383.72) = −4.12, p < 0.001, d = 1.89), with the post-menopause group rating these as more severe in comparison to the perimenopause group.
Network estimation
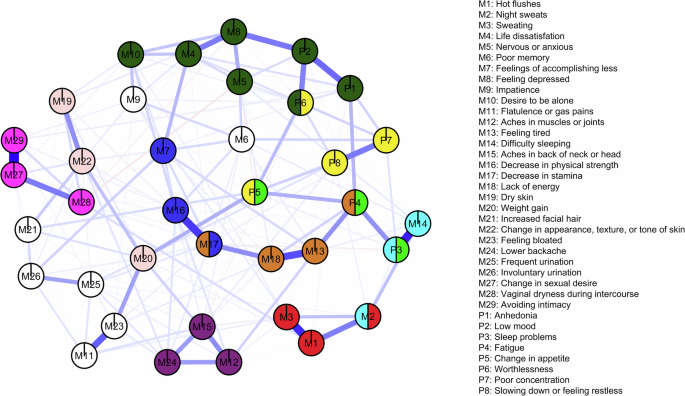
A network was constructed comprising the 37 variables of interest (MENQOL: 29 symptoms; PHQ-8: 8 symptoms) (Fig. 1). Of the 666 possible edges, 253 (37.99%) were non-zero. The mean edge weight within the network was 0.03. Correlation coefficients between all 37 variables can be found in Supplementary Data 1. There was a strong correlation between change in sexual desire (M27) and avoiding intimacy (M29) (r = 0.60). Change in sexual desire (M27) was also moderately correlated to vaginal dryness during intercourse (M28) (r = 0.32). We also found a strong correlation between hot flushes (M1) and sweating (M3) (r = 0.48), with a further correlation between hot flushes (M1) and night sweats (M2) (r = 0.31). Feeling depressed (M8) was moderately correlated to both life dissatisfaction (M8) (r = 0.32) and low mood (P2) (r = 0.32). Difficulty sleeping (M14) correlated strongly to sleep problems (P3) (r = 0.50). There was also a strong correlation between decrease in physical strength (M16) and decrease in stamina (M17) (r = 0.45), as well as between feeling tired (M13) and lack of energy (M18) (r = 0.42). In addition, we found a moderate correlation between flatulence or gas pains (M11) and feeling bloated (M23) (r = 0.38). Anhedonia (P1) and low mood (P2) were moderately correlated to each other (r = 0.36), while low mood (P2) was also moderately correlated to worthlessness (P6) (0.30). Finally, there was a moderate correlation between poor concentration (P7) and feeling slowed down or feeling restless (P8).

Circles indicate nodes (i.e. MENQOL and PHQ items) and lines indicate edges (i.e. the associations between nodes). The thickness and darkness of the lines represent the strength of the association. Green lines represent positive associations, while red lines represent negative associations. The coloured areas in the rings surrounding the nodes depict node predictability (i.e. the percentage of variance in a given node that can be accounted for by its neighbouring nodes).
Centrality and stability
Node centrality is displayed in Fig. 2. The most central node (i.e. the symptom observed to have the strongest expected influence on other symptoms) was decrease in stamina (M17). This node has 16 non-zero edges with other nodes (see Supplementary Data 1): sweating (M3), life dissatisfaction (M4), poor memory (M6), feelings of accomplishing less (M7), feeling tired (M13), aches in the back of head and neck (M15), decrease in physical strength (M16), lack of energy (M18), weight gain (M20), feeling bloated (M23), lower backache (M24), frequent urination (M25), involuntary urination (M26), vaginal dryness during intercourse (M28), sleep problems (P3), and poor concentration (P7). Other nodes with high expected influence were decrease in physical strength (M16), feeling depressed (M8), and change in sexual desire (M27).
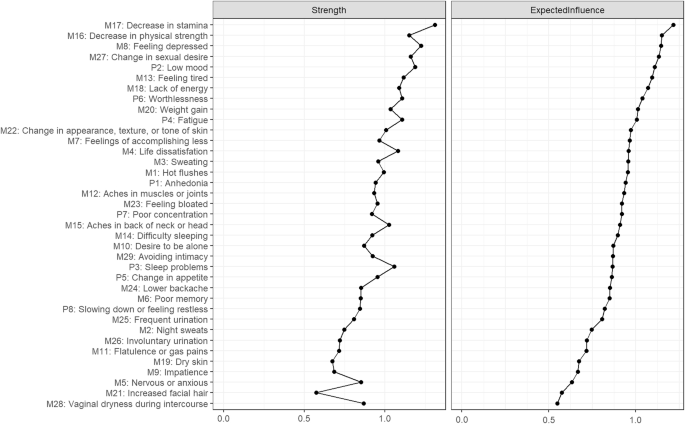
Values are standardised z-scores sorted from most to least expected influence (the greater the estimate the more central the item is).
Both expected influence and strength values indicated a good level of stability, with CS-coefficients of CS(strength) = 0.75, and CS(influence) = 0.75, suggesting that, depending on choice of centrality measure, 75% of participants could be dropped from analyses without significantly changing the network structure.
Clique percolation
To optimise k and I, where I determine how strong the average relations among a community need to be detected as a community, and k determines the minimum clique size, we searched through ranges of I from 0.01 to 0.40 (step-size of 0.005) for k = 3, and k = 4, and chose the combination according to highest entropy. In our data, the highest entropy was achieved at I = 0.130, and k = 3.
These values revealed 10 communities (Fig. 3). Proposed names of the identified communities and nodes within them are presented in Table 1. Seven individual nodes did not belong to any of the revealed cliques (represented in white): poor memory (M6), impatience (M9), flatulence or gas pains (M11), increased facial hair (M21), feeling bloated (M23), frequent urination (M25), and involuntary urination (M26).
Communities refer to subsets of nodes that are densely connected to one another and are identified on the concept of k-cliques, where k represents the number of nodes in a fully connected subgraph. Overlapping communities are formed when nodes participate in multiple k-cliques, revealing intricate relationships within the network. White nodes represent symptoms that did not belong to any of the identified communities.
The clique percolation analysis revealed six overlapping communities. The change in appetite node (P5) belonged to both the depression-related cognitive symptoms (yellow) and depression-related physical symptoms (light green) communities. The fatigue node (P4) was in the increased tiredness (brown) community and the depression-related physical symptoms (light green) community. The sleep problem node (P3) was in both the sleep problems (light blue) community and the depression-related physical symptoms (light green) community. The night sweats node (M2) belonged to both the sleep problems (light blue) and the vasomotor symptoms (red) communities. Decreased stamina (M17) was in both the increased tiredness (brown) and decreased physical ability and efficiency (dark blue) communities. Worthlessness (P6) was revealed to belong to both the depressive mood and anxiety symptoms (dark green) community and the depression-related cognitive symptoms (yellow) community.
Network comparison
Comparisons of networks generated for the perimenopause versus post-menopause groups did not reveal any significant differences in the network structure-distribution of edge weights (M = 0.25, p = 0.38), nor in network global strength (perimenopause: 615 versus post-menopause: 243; S = 6.14, p = 0.88).
Discussion
The current study aimed to explore the structure and interconnectivity of a broad range of menopausal and depressive symptoms using a network analysis approach, and compare these between perimenopause and post-menopause women. In line with previous research, feeling tired or worn out, feeling anxious or nervous, and experiencing poor memory were the most prevalent menopause symptoms across the entire sample24. In terms of symptom severity, feeling tired or worn out, experiencing a lack of energy, and feeling anxious or nervous were the most severely rated symptoms across the entire sample. Post-menopausal women or women in the post-menopause group women tended to report higher rates of hot flashes, dry skin, weight gain, and sexual domain symptoms, whilst a higher proportion of perimenopause women reported feeling anxious or nervous, as well as feeling impatient with other people.
In regards to depressive symptoms as measured by the PHQ-8, fatigue, feeling slowed down or feeling restless, and sleep problems were the most severely rated symptoms, with women in the post-menopause rating the latter as significantly more severe relative to perimenopausal women. Of note, a similar proportion of peri- and post-menopause women met criteria for major depressive disorder (MDD) according to the PHQ-8. Considering that a notable portion of women may experience either depressive symptoms or MDD throughout the menopause, healthcare professionals should endeavour to deliver depression screening. Unfortunately, mental health screening is not consistently integrated into menopause healthcare25, indicating a missed opportunity to identify and address potential mental health concerns that may arise.
When exploring the symptom structure of menopausal and depressive symptoms, network analysis revealed a strong association between decrease in stamina and decrease in strength, with these symptoms being identified as the most central symptoms of the network structure. Previous evidence indicates that reduced stamina can be a symptom causing confusion among individuals in the menopause, leading them to question whether it should be attributed to aging or the menopause transition26. Given the apparent importance of decreased stamina in the network structure revealed in the current study, it is crucial to ensure that public health messaging concerning menopause symptoms is comprehensive. In the current study, decrease in stamina was also associated with psychosocial symptoms, as revealed by the clique percolation analysis. Namely, fatigue (as measured by the PHQ-8) and feelings of accomplishing less were related to a reduction in stamina. In this regard, decreased stamina may be a key candidate for targeted therapeutic intervention. Indeed, exercise, which would increase physical stamina and strength, has been demonstrated to have a positive impact on both physical and psychosocial menopause symptoms27,28,29.
In line with previous research18, feeling depressed was also identified as a key central symptom, and was associated with both life dissatisfaction as measured by the MENQOL and the PHQ-8 item of low mood, with the latter also being implicated as highly central. In this regard, hormone replacement therapy (HRT) has been seen to be effective for managing first-onset depressive symptoms in the perimenopause and early post-menopause30, with fluoxetine and HRT in combination being seemingly effective for depressive symptoms that meet the diagnostic threshold for MDD31. Additionally, psychological therapies have shown moderate benefits in improving depressive symptoms in women in the menopause, which are maintained long term32. Therefore, incorporating pharmacological and/or psychological treatments for depressive symptoms alongside HRT may deliver wider benefits in women in the menopause who are experiencing such symptoms.
A change in sexual desire was also identified as a highly central symptom, demonstrating a strong associated with avoiding intimacy. Sexual symptoms are frequently reported core symptoms of the menopause18,33, with depression being associated with decreased sexual desire in perimenopause women34. In line with previous research35, a change in sexual desire was further correlated to vaginal dryness during intercourse, highlighting the importance of vaginal dryness in decreased sexual desire in the menopause, with these symptoms being inversely associated. Interestingly, vaginal dryness was the least frequently reported symptom in the current sample, contrasting previous studies demonstrating that vaginal dryness is frequent, particularly in post-menopausal women36. Additionally, vaginal dryness was identified as the symptom with the lowest centrality (i.e. the symptom observed to have the lowest expected influence on other symptoms), despite its strong association with other highly central sexual symptoms. A reason for this finding may be the diverse range of factors and individual variability influencing menopause symptoms, which were not assessed in the current study. One such example is the use of vaginal lubricants, which are effective at reducing vaginal dryness in post-menopausal women37. Furthermore, it is important to highlight that the MENQOL may be limited in its ability to measure the vast range of genitourinary symptoms that may occur throughout the perimenopause and post-menopause, such as dyspareunia and reduced vaginal lubrication outside of sexual intercourse. Indeed, it has been shown that these symptoms are highly prevalent in this population38 and further research is warranted in order to explore how genitourinary symptoms may relate to other menopause symptoms, as well as depressive symptoms.
We found a strong correlation between vasomotor symptoms, namely, hot flushes and sweating, with hot flushes being further associated with night sweats. Vasomotor symptoms were observed to cluster within one community revealed in the clique percolation analysis, with night sweats also being implicated in the ‘sleep problems’ community. This corroborates previous findings establishing the impact of vasomotor symptoms on sleep quantity or quality 39, with night sweats specifically being associated with sleep disturbances40. In turn, sleep problems as measured using the PHQ-8 belonged to both the ‘sleep problems’ community and also the ‘depression-related physical symptoms’ community, which was further linked to the ‘cognitive-depression symptoms’ and the ‘depressive mood and anxiety symptoms’ communities. This finding is in line with the proposed ‘domino’ theory of the menopause, which posits that sleep disturbances potentially mediate the relationship between vasomotor and mood symptoms41, such that vasomotor symptoms disturb sleep, and sleep disruption causes low mood42. In this regard, it has been posited that HRT may alleviate low mood and sleep problems by decreasing vasomotor symptoms43.
Notably, despite the apparent interconnectivity of vasomotor and other menopause and depressive symptoms in the current study, vasomotor symptoms appeared to have a comparatively low influence in the network. Critically, there is some discourse regarding the validity of classing non-vasomotor symptoms as symptoms of the menopause, as they may be more directly associated with sociodemographic characteristics, primarily age20. Despite this, given the frequency and burdensomeness of non-vasomotor symptoms associated with the menopause as demonstrated both in the current study and in previous research18, including such symptoms in the definition of the menopause whilst recognising that their aetiology may be dually attributed to aging and the menopause is practical for both research and clinical care. Unfortunately, the perception of vasomotor symptoms as being the core symptoms of the menopause can have a detrimental impact on the delivery of care for the menopause and the menopause transition, with accounts from women in the menopause of healthcare professionals (HCPs) withholding support due to a lack of vasomotor symptoms25.
Interestingly, the network structure did not differ between the perimenopause and post-menopause groups, despite group differences in the frequency and severity of vasomotor, psychological, physical, and sexual symptoms, as well as symptom duration. This indicates that irrespective of frequency, severity, and duration of symptoms, the symptom structure and interactions may be stable across the span of the menopause transition and post-menopause. In this regard, early intervention is likely to be beneficial in relieving both menopause and depressive symptoms. Critically, women in the perimenopause may be less likely to receive treatment or support compared to women in the post-menopause period25. This may be due to a lack of awareness and understanding among HCPs regarding the potential impact of perimenopause symptoms and the benefits of early intervention, with research indicating that the perimenopause stage may hold a particular significance when it comes to the success of hormone-based treatments for menopause symptoms44,45. In turn, intervening early has been demonstrated to prevent or reduce the severity of other health issues throughout this challenging phase of life44,45,46,47,48,49.
It is worth noting that the sociodemographic characteristics may have contributed to the network structure identified in the current study. As the majority of the sample was white, the revealed network structure may not be widely generalisable to other minority ethnic groups, given the differences in menopause symptom presentation between ethnic groups50. Therefore, we strongly advocate for further research applying these analyses techniques to menopause and depressive symptom data from diverse sociodemographic groups. Additionally, the social media recruitment strategy emphasised the study’s focus on the menopause and mental health, therefore it is likely that individuals with more severe menopause and associated mental health symptoms would have been more inclined to participate in the study. Indeed, the incidence of major depressive disorder in the current sample is significantly higher than indicated by research in other study populations12. This will have shaped the network, and the connections within it, and so the findings of the current study will likely not be generalisable to women in the peri- or post- menopause stages with milder symptom severity. Therefore, future research may aim to examine the association between depression and menopause symptoms using a stratified sample to ensure more varied symptom severities are captured. Further, a control group may be beneficial to both validate the network structure and to ensure that the influence of symptoms of depression on the wider cluster of menopause symptoms is not exaggerated for individuals without significant mental health concerns. Thus, while the study adds valuable insight into our understanding of the interplay of menopause and symptoms of depression, the findings may not extrapolate to women who do not suffer from menopause-related mental health concerns. In addition, as the MENQOL measures psychological symptoms, some of which overlap with the items within the PHQ-8, the edge weights may have been inadvertently exaggerated. Related to this, it is important to note that we did not control for previous diagnoses of mental health conditions, which may have affected the network structure.
In conclusion, this study delved into the intricate web of menopause and depressive symptoms using a network analysis approach, discerning key patterns in their presentation. The findings from this research suggest that addressing decreased stamina could prove instrumental in managing mood symptoms related to the menopause. Similarly, psychosocial symptoms were seen to be core symptoms of the menopause experience. Undoubtedly, the menopause is a multifaceted phase that encompasses not only physical changes but also significant psychological challenges, and recognising the holistic nature of the menopause experience is crucial for providing comprehensive care. Nonetheless, further research is needed to examine the network of menopausal symptoms in more diverse populations including individuals from ethnic minority groups and stratified samples with more varied symptom severities. The findings from the current study also underscore the importance of early intervention, particularly in the perimenopause stage, where women may face additional barriers in accessing essential support. Early intervention not only aids in alleviating menopause and depressive symptoms but also contributes to overall well-being during this significant phase of life.
Methods
Ethical approval and informed consent
The study was approved by the University of Cambridge Human Biology Research Ethics Committee (approval number PRE.2022.110). All participants provided informed consent electronically to participate in the study. This research complies with the principles of relevant ethical guidance, including those set out in the Declaration of Helsinki.
Participants
Participants were recruited between January 2023 and March 2023 via email, paid Facebook and Instagram advertisements, organic posts on the Cambridge Centre for Neuropsychiatric Research Facebook and Twitter pages, and Reddit. Recruitment messages were also disseminated by word-of-mouth and through relevant foundations and support groups. Inclusion criteria for the study were: (i) ≥18 years, (ii) UK residence, and (iii) must be currently experiencing symptoms of the menopause or menopause transition (e.g. hot flushes, mood changes, night sweats, irregular/absent periods, decreased sex drive). Data from participants in either the perimenopause (i.e. early perimenopause stage: significant change in the length of menstrual bleeding or the time between periods that is not due to pregnancy or breastfeeding, stress or a medical condition or late perimenopause stage: no menstrual bleeding in 3–11 months not due to pregnancy or breastfeeding, stress, or a medical condition) or the post-menopause (i.e. no menstrual bleeding in 12 months not due to pregnancy or breastfeeding, stress or a medical condition), were included. These groupings were based on the definitions put forth by the Study of Women’s Health Across the Nation (SWAN; 23). Participants were also required to not be currently pregnant or breastfeeding and did not have to have been diagnosed with a mental health condition to take part in the study. Participants were invited to enter their email for the chance to win one of three £50 Highstreet vouchers.
Materials and procedure
The current study used data from a UK-wide survey study conducted by the Cambridge Centre for Neuropsychiatric Research between January and March 202325. The survey could be completed in 15–20 min and comprised five sections: (i) socio-demographic information, (ii) healthcare provision throughout the menopause, (iii) mental health symptoms and care provision throughout the menopause (iv) menopause-specific quality of life (MENQOL22) symptoms, and (v) experiences and interest in using digital technology for mental health symptoms related to the menopause.
Menopause status was based on the definitions by SWAN51, whereby participants were required to select which of the following options best described their experience of the menopause: a) early perimenopause stage: significant change in the length of menstrual bleed or the time between periods that is not due to pregnancy or breastfeeding, stress or a medical condition; b) late perimenopause stage: no menstrual bleeding in 3–11 months not due to pregnancy or breastfeeding, stress, or a medical condition, c) post-menopause: no menstrual bleeding in 12 months not due to pregnancy or breastfeeding, stress or a medical condition, or d) medically induced menopause: no menstrual bleeding due to hysterectomy with one or two ovaries retained or other medical procedure. Due to the small sample size and the heterogeneity from non-medically induced menopause in terms of symptom severity 52,53, the latter were not included in the analyses.
Mental health symptoms were measured using the PHQ-821, which is a well-validated diagnostic and severity measure for depressive disorders. The PHQ-8 consists of eight items that cover various domains of depressive symptoms experienced over the past 2 weeks. Participants are required to rate the frequency of each symptom occurrence on a scale ranging from ‘0’ (not at all) to ‘3’ (nearly every day). Section 4 comprised the MENQOL22, which is a 29-item instrument designed to evaluate the influence of menopause symptoms on quality of life (see Table 2). It assesses four domains of symptoms experienced over the past month: vasomotor, psychosocial, physical, and sexual. Participants indicate whether symptoms within each domain are present or not, and if present, they rate the level of perceived bother on a scale ranging from “0” (not bothersome) to ‘6’ (extremely bothersome). For the purpose of the current study, socio-demographic characteristics, the PHQ-8, and the MENQOL were included in the analyses.
Data analytic strategy
Descriptive statistics were conducted in SPSS version 28.0.1.1. Group differences (i.e. perimenopause vs. post-menopause) in continuous variables were explored using t-tests, with effect sizes reported as Cohen’s d (small = 0.20, medium = 0.50, large = 0.8054). Group differences in ordinal variables were explored using Mann-Whitney U tests. Effect sizes are reported as r (small = 0.10, medium = 0.30, large = 0.5054). Comparisons on binary variables were conducted using Chi-Square tests (χ²) or Fisher’s Exact Test (FET) for low-frequency data (i.e. values below five). Effect sizes are reported as Cramer’s V (φc; small = 0.10, medium =0.30, large = 0.5054).
Network estimation analyses were conducted using RStudio (version 2022.12.0)55. In the network model, each symptom was represented by a node, with the relationship between two nodes represented by an edge. To express relationships between the nodes, the cor_auto function from qgraph (version 1.9.3)56 was used to estimate a correlation matrix with the appropriate method for our data. After estimating correlations, we opted to use Least Absolute Shrinkage and Selection Operator (LASSO) regularisation, with the network selection based on Extended Bayesian Information Criteria (EBIC) to shrink edges and select relevant tuning parameters for greater interpretability of the final model. R libraries qgraph56 and bootnet (version 1.5)57 were applied to estimate and visualise the model. Thicker edges indicate stronger associations between two nodes, green edges represent positive correlations and red edges represent negative correlations.
To assess the significance of individual nodes within the network, the R package qgraph was used to calculate the expected influences and node strengths. Nodes with greater expected influence were deemed more crucial in the network. Additionally, the predictability of each node was computed using the R package mgm (version 1.2-13)58. The predictability values indicate the degree of interconnectedness between a node and its neighbouring nodes and are visually represented as the area within the rings encircling each node in the network layout.
In order to evaluate the reliability and consistency of the network model, the R package bootnet (version 1.5)58 was utilised. Non-parametric bootstrap (resampling rows with replacement) was used to create 1000 samples to estimate edge weight stability. Case-dropping subset bootstrap samples (n = 1000) were used to estimate the stability of centrality indices. Stability was represented by CS-coefficient, indicating the percentage of the sample that can be dropped whilst retaining correlation values equal or above to r = 0.70, with a 95% confidence interval. The centrality indices, namely expected influence and strength, were evaluated using correlation stability (CS)-coefficients, where a CS-coefficient greater than 0.25 indicates moderate stability, while a value greater than 0.50 indicates strong stability.
To identify strongly connected subgraphs in the network, it is possible to use community detection59. Most community detection algorithms put each node in only one community. However, it is likely that nodes are shared by a number of communities. This could occur, for instance, when an overlapping symptom is commonly present within multiple disorders. To identify overlapping communities, we used the clique percolation algorithm as implemented by the R package CliquePercolation (version 0.4.0)60.
Network characteristic differences between the perimenopause and post-menopause subgroups were examined. Global connectivity and local connectivity were assessed using a Network Comparison Test (NCT) between the two models, using R package NetworkComparisonTest (version 2.2.1)61 with 1000 iterations.


Responses