Using noninvasive imaging to assess manual lymphatic drainage on lymphatic/venous responses in a spaceflight analog

Introduction
Under the influence of standard developmental physiology on the Earth’s surface (1 gravity equivalent, known as “1 g”), 70% of body fluids reside below the level of the heart (Fig. 1)1. The lymphatic system has the capacity and capability to transport fluid from distal to proximal in an upward manner, against gravity and tissue pressure gradients, via lymphangion contractility, leg muscle contraction, and respiratory and chest wall function, thus augmenting a “suction effect” for pumping lymphatic fluid within the subatmospheric pressure tissue distribution zones (the Guyton principle)2. Lymphatic drainage of the head and neck must be assisted by gravity, since these regions are above the level of the heart. In the weightlessness of space and resulting significant alterations of terrestrial 1 g head-to-foot hydrostatic pressure gradients, astronauts experience a dramatic fluid redistribution of ~2 liters from the legs to the upper torso, head, and neck within the first 24–48 hours of flight, among other cardiovascular and physiologic system adaptations3,4,5,6. The majority of this fluid redistribution has been shown to occur during the first 6–10 hours of spaceflight, with significant changes possibly occurring as soon as 4 hours postflight7. Fluid shifts may result in headaches, congestion, or facial edema that can contribute to deteriorating sleep patterns4. Fluid shifts towards the cephalic region during microgravity have been speculated to contribute to the development of spaceflight-associated neuro-ocular syndrome (SANS)8. SANS is a distinct, microgravity-induced phenomenon of neuro-ophthalmic findings observed in astronauts following long-duration spaceflight including choroidal folds, optic disc edema, posterior globe flattening, refractive shift, and cerebral fluid shifts noted to be persistent at 6-month postflight MRI scans. Although a significant barrier to spaceflight, the underlying mechanisms of SANS are proposed to be a ”multi-hit” sequala9. Given the limited medical capabilities in the spaceflight environment, there exists a distinct inability to perform invasive diagnostic testing8. Thus, noninvasive approaches to studying real-time fluid shifts in weightlessness could serve as critical areas of research to further SANS study and effective countermeasure protocol development.

This image was previously published by Ong, Lee, and Moss in Frontiers in Neurology1.
Lymphatic research in low earth orbit (LEO) is largely still in a preclinical, experimental phase. Murine models involving tail elevation and hindlimb unloading (simulated weightlessness), unmanned space shuttles, and satellites have shown cephalic fluid shifts similar to those reported in astronauts during spaceflight and have demonstrated the redistribution of lymphocytes among organs that decreased their immunologic response3,10,11,12,13,14,15,16. To our knowledge, potential, restorative countermeasures to improve lymphangion contractility and overall lymphatic function during spaceflight have not been investigated. In normal gravity environments, MLD is a widely used therapy involving a specialized protocol of gentle, therapeutic massage that reduces lymphatic fluid in areas affected by edema17,18,19. A systematic review and meta-analysis of randomized controlled trials have demonstrated that MLD significantly improves lymphedema symptoms and pain in patients with breast cancer (p = 0.02)19. The potential use of MLD in microgravity environments to mitigate fluid shifts has not been studied.
The ability to manage, mitigate, or offset fluid shifts is vital to maintain nominal health for short and long-duration spaceflight and potentially improve readaptation to terrestrial gravity or other surface gravity fields, such as the moon or Mars. During deep space missions, ground-based medical teams will no longer be easily accessible due to distance and communication delays, hence crew members must perform point-of-care (POC) functions independently to maintain preventative health measures, along with urgent corrective and potentially curative countermeasures5. NIID is now available at POC, which could overcome the previous barriers to continuous fluid shift monitoring during spaceflight. Lymphatic fluid scanners measure the tissue dielectric constant (TDC) in areas of interest (AOI) to determine fluid flow patterns and alterations related to positioning20,21. Near-infrared spectroscopy (NIRS) measures oxygenated and deoxygenated hemoglobin to determine superficial tissue oxygenation levels for the monitoring of perfusion changes22,23,24. Increased cerebral oxygenation has been documented as soon as 1.5–3 hours in multiple NIRS studies using the 6-degree HDT model22,25,26. In parabolic flight, NIRS has demonstrated that arterial blood flow to the head increased, with cerebral oxyhemoglobin 3 times higher than baseline values27. Long-wave infrared thermography (LWIT) provides reliable and reproducible temperature assessments, by measuring physiological tissue temperature differentiation to understand thermal energy emitted from AOI28,29,30.
Before evaluating NIID during spaceflight missions, it is important that this technology is first quantified and validated through ground-based analogs6,31,32. Ground-based analogs for simulation of the impact of weightlessness on human physiology exist in several forms, including strict 6-degree head-down tilt (HDT) bed rest, dry immersion, and brief periods (20–40 seconds) of weightlessness during parabolic flights6,7,31,32,33. HDT is the most widely used and validated spaceflight analog that addresses fluid shifts in a timely manner6,31,32.
The main objectives of this pilot, retrospective case series were twofold: (1) to use 3 POC NIID to assess dermal/venous fluid flow patterns, perfusion changes, and temperature differential alterations of the head, neck, upper torso, and legs while in the 6-degree HDT validated spaceflight analog position; and (2) to analyze the effect of MLD therapy administered in the HDT position on the aforementioned variables. We hypothesized that dermal venous and lymphatic flow patterns of the head, neck, upper torso, and ventromedial bundle flow patterns should have shifted to cephalad (indicating dermal interstitial fluid increase) in the 6-degree HDT position and should have been reversed following MLD administered in the HDT position. Tissue oxygenation levels at the affected AOI should have subsequently decreased, while MLD should have reversed those trends. Lymph flow has been shown to appear to be influenced by local tissue temperature in rats34,35; MLD should have impacted superficial venous flow (that could have impacted temperature gradients36,37) and should have reversed alterations initially observed in the HDT spaceflight analog.
Results
Baseline characteristics
The median (IQR) age of the 15 subjects was 24 years (22–30), and 11 (73%) were female. Table 1 summarizes baseline patient characteristics. All 15 participants underwent imaging with all 3 devices while in the HDT position, but 3 participants unexpectedly had some or all LWIT data missing, because an earlier version of the device was not able to manage the high-volume images taken. It was impossible to externally upload images to save them, but this issue was corrected with the use of a newer device model in the remaining participants.
TDC analysis
Table 2 summarizes the TDC data measured by the lymphatic fluid scanner device and corresponding statistical analysis. Table 2 and Figs. 2–5 demonstrate that, while in the HDT position, TDC levels were generally stable from 30 minutes after assuming position until post-180 min for all AOI, except for the right subclavicular region, where at post-150 min, the median (interquartile range [IQR]) TDC had a noticeable increase from 44.1 (39.7–47.2) at baseline to 44.2 (40.9–47.8), and the marginal mean (standard error [SE]) TDC increased from 44.2 (1.1) to 44.3 (1.6). The mean percent changes from baseline for all timepoints and all AOI always had p values less than 0.10 (Table 2). However, not all differences were statistically significant, because there was a large SE due to the limited sample size, and the 90% CIs crossed the zero-line and, therefore, did not reject the null hypothesis. This is the case for all percent differences at post-180 min, which all have p values less than 0.10 (Table 2), the largest SEs observed, and 90% confidence intervals (CIs) including zeros, rendering the percent differences not statistically significant (Table 2 and Figs. 2–5). Similarly, the increased TDC observed in the right subclavicular region at post-150 min was not significant. Nonetheless, the medians and marginal means at post-180 min all showed a noticeable decrease, which appeared to resolve following 15 minutes of MLD at post-195 min, with median TDC levels greater than or equal to baseline levels for all AOI, except for the right temple and the left ventromedial bundle. Both these AOI had median TDCs greater than baseline at post-225 min in the sitting position. Marginal means for all AOI were greater than baseline at post-195 min (post-MLD).
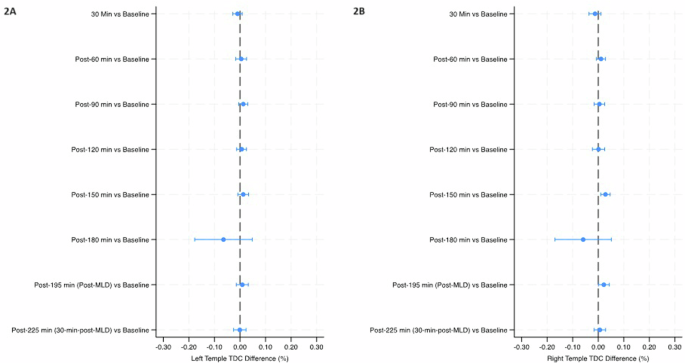
Mean percent change (90% Confidence Intervals) in tissue dielectric constant (TDC) from baseline over the course of the study in the left temple (2A) and right temple (2B). The final timepoint [post-225 min (30-min-post-MLD)] was assessed in the sitting position, while all prior timepoints were assessed in the head-down tilt position. Line indicates statistical difference, p < 0.10. MLD manual lymphatic drainage.
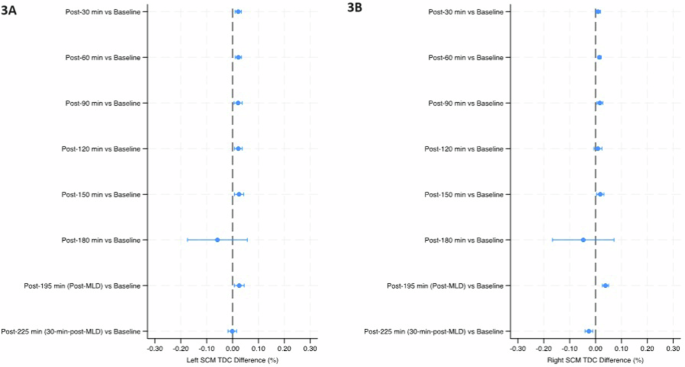
Mean percent change (90% Confidence Intervals) in tissue dielectric constant (TDC) from baseline over the course of the study in the left SCM (3A) and right SCM (3B). The final timepoint [post-225 min (30-min-post-MLD)] was assessed in the sitting position, while all prior timepoints were assessed in the head-down tilt position. Line indicates statistical difference, p < 0.10. MLD manual lymphatic drainage, SCM sternocleidomastoid.
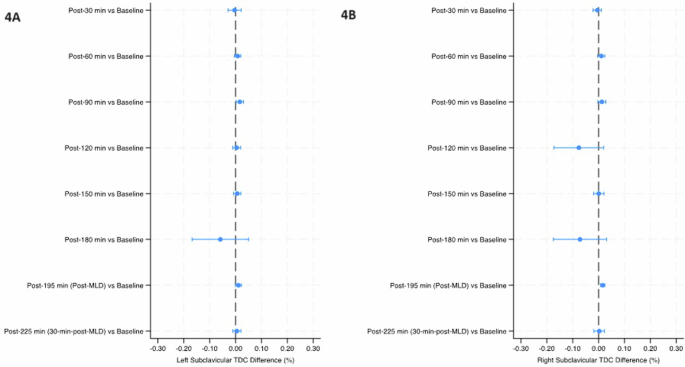
Mean percent change (90% Confidence Intervals) in tissue dielectric constant (TDC) from baseline over the course of the study in the left subclavicular region (4A) and right subclavicular region (4B). The final timepoint [post-225 min (30-min-post-MLD)] was assessed in the sitting position, while all prior timepoints were assessed in the head-down tilt position. Line indicates statistical difference, p < 0.10. MLD manual lymphatic drainage.
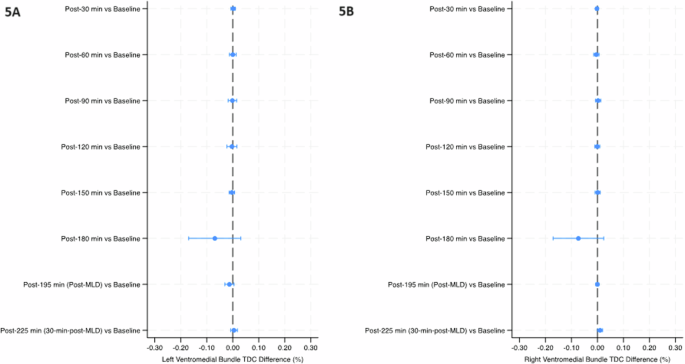
Mean percent change (90% Confidence Intervals) in tissue dielectric constant (TDC) from baseline over the course of the study in the left ventromedial bundle region (5A) and right ventromedial bundle (5B). The final timepoint [post-225 min (30-min-post-MLD)] was assessed in the sitting position, while all prior timepoints were assessed in the head-down tilt position. Line indicates statistical difference, p < 0.10. MLD manual lymphatic drainage.
The temples did not have any significant within-group changes in TDC levels (Table 2 and Fig. 2). TDC levels of the sternocleidomastoid (SCM) were significantly greater than baseline at post-30 min on the right side (p < 0.10), and after 30 minutes on the left side; post-60 min on both sides, post-90 min and post-120 min on the left side, and post-150 min on both sides (p < 0.05) (Table 2 and Fig. 3). There was a significant increase at post-195 min (post-MLD) on both sides, and post-225 min on the right side (p < 0.05). At the right subclavicular region (Table 2 and Fig. 4B), the marginal mean at post-195 min (post-MLD) had a significant different increase of 1.58% (90% CI: 0.71–2.54; p = 0.003). At the right ventromedial bundle (Table 2 and Fig. 5B) at post-225 min, the right side demonstrated a significant increase of 1.02% (90% CI: 0.04–2.00; p = 0.089).
Tissue oxygenation saturation analysis
Tables 3 and 4 summarizes tissue oxygenation saturation statistical analysis over the course of the study. At the medial knee, proximal leg, and frontal subclavian region, significant decreases on both sides occurred at the post-30 min, post-60 min (p < 0.05), post-90 min (p < 0.001), post-120 min, post-150 min, post-180 min, and post-195 min (p < 0.10) (Table 3). In Table 4, all timepoints demonstrated significant changes at the temporal lobe, venous angle, and forehead (p < 0.10), except for post-225 min at the front venous angle and right lateral venous angle.
The median tissue oxygenation levels are plotted in Fig. 6. In Fig. 6A, all left AOI had fluctuations in median tissue oxygenation levels, but these changes were particularly noticeable at the frontal subclavian and frontal venous angle regions, the former of which saw a sharp decrease after the post-150 min timepoint, and the latter of which saw a sharp decrease after 120 minutes. These 2 AOI had equivalent median baseline values, and MLD appeared to result in a sharp increase, with values returning to baseline levels at post-225 min in the sitting position. Right AOI also demonstrated fluctuating tissue oxygenation levels (Fig. 6B), with the largest decrease observed at post-180 min and a small increase observed after MLD at post-195 min for all AOI, except for the lateral venous angle. Figure 7 provides a visual case example of NIRS assessment of the head (face) and neck in a healthy, 28-year-old female subject at key timepoints. A visible reduction of tissue oxygenation levels proportional to the amount of time spent in HDT position is observed. Interestingly, the tissue oxygenation visual levels of the neck appeared to increase over time (turning darker red) while in the HDT position, until after MLD (at both post-195 min in the HDT position and post-225 min in the sitting position), when levels turned yellow and even green, signifying they decreased in intensity.
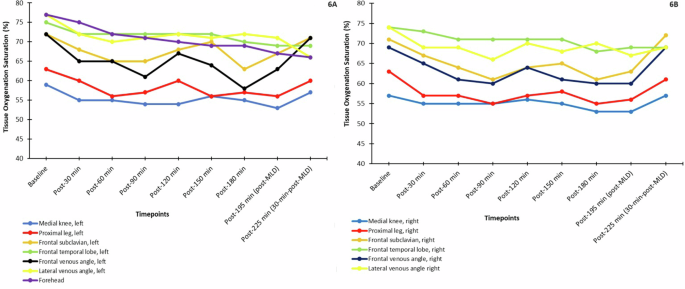
Median tissue oxygen saturation levels (%) measured over the course of the study on the left side (6A) and right side (6B) of all areas of interest. Only the front (not the sides) of the forehead was measured, so it is included in A only. MLD manual lymphatic drainage.
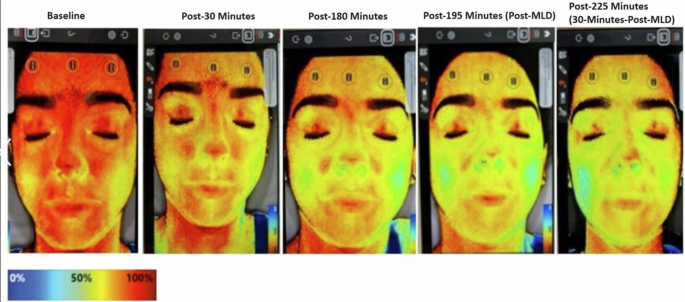
All assessments were taken while in head-down tilt (HDT) position, except for the post-225 min timepoint, when the subject was seated for 30 min. The color reference scale demonstrates the level of tissue oxygenation saturation on a percentage scale (oxygenation increases as levels approach red and decreases as levels approach blue). A visible reduction of tissue oxygenation levels proportional to the amount of time in spent in HDT position was observed. Interestingly, the tissue oxygenation visual levels of the neck appeared to increase over time while in the HDT position, but after manual lymphatic drainage (MLD) at both post-195 min in the HDT position and post-225 min in the sitting position, levels appeared to decrease in intensity.
LWIT tissue temperature gradient analysis
Table 5 summarizes the temperature gradient statistical analysis. The right side of the head/neck region and the right leg had abnormal thermal gradients outside the ±1 °C range for most of the timepoints. Generally, the left AOIs remained within the normal thermal gradient, even with significant changes from baseline. For the head/neck region, significant within-group decreases from baseline occurred on the left and right side at post-60 min and post-90 min (p < 0.05), on all sides at post-120 min, on the front and left side at post-150 min and post-180 min (p < 0.10), at the left side at post-195 min (p = 0.047), and on the front at post-225 min (p = 0.019). On the legs, the right side had a significant decrease at post-60 min (p = 0.081), and both sides had a significant decrease at every point thereafter (p < 0.05).
Figure 8 and Table 5 show the median tissue temperature gradient levels over the course of the study. Generally, the legs showed a decreasing trend in temperature gradient even after MLD, while the head/neck AOI fluctuated more (particularly for the front and left side), but a noticeable increase was shown after MLD at post-195 min for the front and left head/neck. The right head/neck was more constant throughout the study. Figure 9 depicts a case example of LWIT image taken from the same subject represented in Fig. 7. An initial increase in temperature gradient at the head and neck was greater on the right side, compared to the left, indicating suspected venous engorgement over time in the HDT position. After MLD at post-195 min in the HDT position and post-225 min in the sitting position, there was a visual reduction of perfusion (or venous engorgement) in the head and neck towards normalcy.
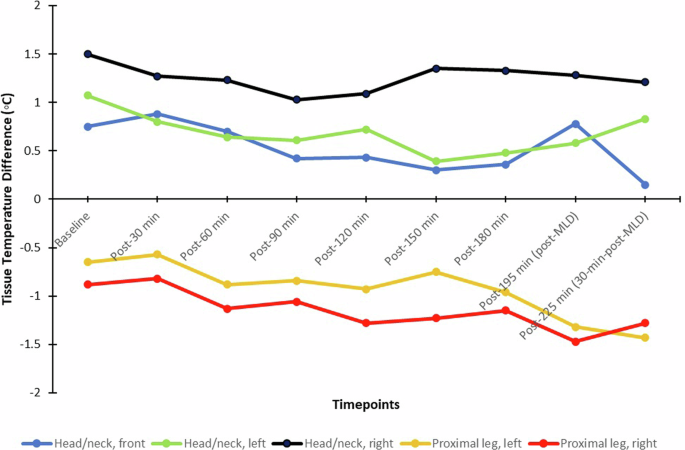
MLD manual lymphatic drainage.
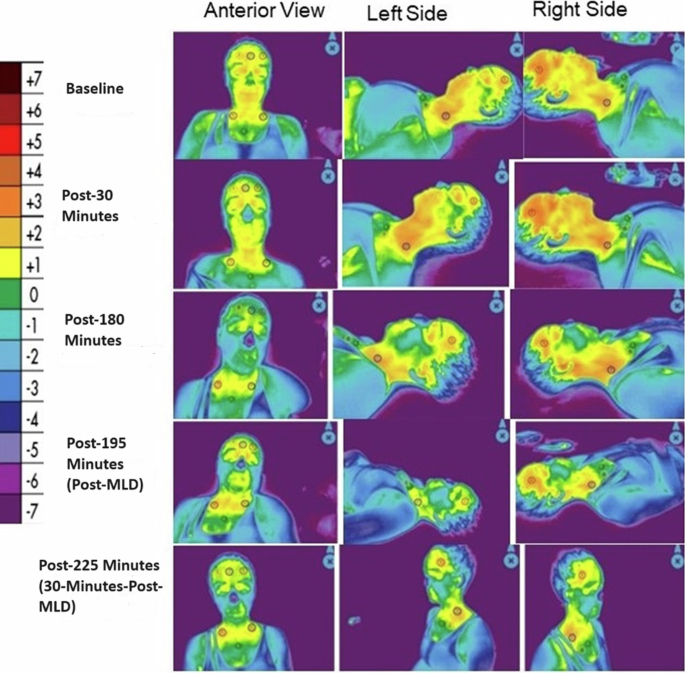
All assessments were taken while in head-down tilt (HDT) position, except for the post-225 min timepoint, when the subject was seated for 30 min. The color reference scale measures thermal energy gradient in degrees Celsius, with increasing oxygenation approaching red and decreasing oxygenation; values >0 indicate hyperperfusion, while values <0 indicate hypoperfusion. In the above images, an initial increase in thermal energy emitted from the head and neck was greater on the right side, compared to the left, indicating increased perfusion or suspected venous engorgement over time in the HDT position. After manual lymphatic drainage (MLD) at post-195 min in the HDT position and post-225 min in the sitting position, there was a visual reduction of perfusion (or venous engorgement) in the head and neck towards normalcy.
Vitals analysis
Table 6 summarizes vitals data. All vitals were normal at baseline. Blood oxygen levels remained stable throughout the course of the study. A significant within-group change from baseline occurred at all timepoints for heart rate. Median heart rate values decreased over the first 180 minutes, while marginal means fluctuated with all timepoints demonstrating significant change; the largest change from baseline was a decrease by 7.90 after 180 minutes. MLD appeared to then increase heart rate from a median (IQR) of 58.5 (54.0–71.0) and a marginal mean (SE) of 62.6 (2.5) at post-180 min to 67.0 (60.0–77.0) and 66.7 (2.5), respectively, at post-195 min Systolic blood pressure remained stable in the HDT position and then significantly increased by 6.60% (90% CI: 2.52 to 10.68, p = 0.008) when put in the sitting position for the final 30 minutes. Diastolic blood pressure generally increased from baseline, with significant changes observed from post-90 min thereafter (p < 0.1) and with the largest increase from baseline observed following MLD at post-195 min [from a marginal mean (SE) of 71.9 (1.4) to 81.4 (1.4), or a 9.47% increase (90% CI: 6.33–12.60, p < 0.001)]. The respiratory rate significantly decreased from baseline at each timepoint (p < 0.001), with the largest decrease observed following MLD therapy at 195-minutes [from 20.4 (0.8) to 16.4 (0.8), a 4.00% decrease, 90% CI: −5.33 to −2.67, p < 0.001]. Body temperature slightly decreased by ~0.1 °C from baseline at post-150 min thereafter (p < 0.05); however, the 90% CI nearly approached zero at each timepoint (Table 6).
Discussion
This is the first HDT spaceflight analog study, to our knowledge, in which dermal fluid shifts were evaluated using POC NIID, including NIRS, LWIT, and a lymphatic fluid scanner, with subsequent application of MLD techniques to stimulate dermal lymphatic function to mitigate cephalad fluid shifts.
In the HDT position, we would expect that fluid should shift away from the legs to the upper torso and head/neck7. In our small sample, the SCM muscle of the neck showed significant increases from baseline as soon as 30 minutes after assuming the HDT position, reflecting the initial cephalad fluid shift through post-150 min, while the legs were the most stable AOI until 180 minutes, when they saw a sudden (albeit anticipated) decrease (Table 2). The lymphangion contractility of the head and neck is simply less robust and primarily gravity dependent, while the legs have robust lymphangion contractility and respond well to subatmospheric pressure differences (i.e., the Guyton principle)2. After 180 minutes in the HDT position in our study, marginal means (but not necessarily medians) suddenly decreased at the neck, and this timepoint saw the largest percent change from baseline for all AOIs, albeit an insignificant change due to the sample size limitations (Table 2). Fifteen minutes of MLD appeared to reverse the change observed at 180 minutes, with values returning to or approaching baseline at post-195 min (Figs. 2–5). Because we analyzed fluid shifts through only 180 minutes in HDT prior to applying MLD, it is possible the timepoints analyzed were not as sensitive to imaging changes as anticipated, as the majority of fluid is redistributed after the first 6 hours (360 minutes) of microgravity7. In a previous study of 7 subjects, interstitial fluid pressures began to peak after 240 minutes in HDT the position7; we believe that the drastic change in variables analyzed after 180 minutes hours may be reflective of approaching peak fluid redistribution that becomes significant at 240 minutes.
Previous authors also have reported that just 30 minutes of bed rest resulted in 900 ml of fluid (likely venous blood) shifting away from the legs38, and we saw a notable decrease in median (IQR) TDC levels in the right leg after only 30 minutes, from 38.5 (36.6–40.4) at baseline to 37.2 (37.00–40.2) at post-30 min (Table 2). However, the most important limitation of our TDC analysis was the very small sample size, which resulted in large SE values and overlapping 90% CIs that impacted statistical analysis. For example, this limitation rendered the noticeable drop in marginal mean TDC levels at post-180 min for all AOIs insignificant. On the other hand, the noticeable drop that only occurred in the right subclavicular site at post-120 min was also not significant and was likely an issue related to the sample size (Table 2, Fig. 4B).
We generally observed more noticeable changes in TDC in the right AOI compared to the left AOI. A change in fluid volume at AOI would alter the electrical resistance of that particular AOI segment, and so segmental leg resistance, or impedance, is observed to increase in the 6-degree HDT position39. Impedance could, therefore, serve as a proxy measure of fluid redistribution39,40. Fluid shifts on the left and right sides of the body are known to vary in the HDT position, with impedance greater on the right side, a trend that is more pronounced in the upper torso compared to the legs, but not always consistent39,40. Inconsistent torso findings may be a result of the motion-limitations of the HDT spaceflight analog, as spaceflight crew does not remain motionless in microgravity, and so it may not be appropriate to require subjects to refrain from movement in terrestrial models39.
An increase in perfusion (Tables 3 and 4) and thermal energy (Table 5) at the neck was observed that appeared to resolve following MLD, while a decrease in perfusion and thermal energy was observed in the legs, with levels returning to baseline only when participants moved out of HDT to the sitting position. In the HDT position, we believe that fluid redistribution to the head/neck is driven by venous congestion, which would increase deoxygenated hemoglobin and decrease oxygenated hemoglobin, resulting in decreased tissue oxygenation (based on a ratio of the former to the latter) captured by NIRS. Significant changes in tissue oxygenation saturation levels have been reported as soon as 90–180 minutes after assuming HDT position22,25,26. In our study, tissue oxygenation levels showed fluctuation, but the largest (and most anticipated) decrease from baseline was observed at post-180 min, again likely reflecting the approach to the peak in alterations that would have been observed after 240 minutes7. MLD resulted in a noticeable increase in tissue oxygenation at most AOI, with values approaching baseline at post-195 min (Tables 3 and 4, Fig. 6), which would be expected, because venous congestion would have resolved immediately (whereas interstitial edema may still lag). In Fig. 6, with the exception of the right lateral venous angle, MLD appeared to be slightly more effective in resolving tissue oxygenation reductions on the right side of the body. This is likely because the right side is more easily congested (with its smaller lymphatic drainage basin compared to the left), as reflected in its lower tissue oxygenation levels in Tables 3 and 4.
The increased venous congestion in the head/neck region, would have increased thermal energy at these AOI, and so, the resulting temperature gradient would have been larger. With more venous congestion on the right side of the body, we would expect a shift in greater thermal energy on this side as well. Likewise the legs would have decreased thermal energy as a result of the cephalad shift. Figure 6 elegantly shows that right side of the head/neck had abnormally high (>+1 °C) temperature gradient levels upon immediately assuming HDT position, while the right leg had abnormally lower temperature gradient levels (<−1 °C) after 1 hour in the HDT position. Anecdotally, increased heat signals on the right side of the neck compared to the left, though not quantifiable (Figs. 7 and 9) were visually noted with both thermography and NIRS, as ventromedial bundles did not increase in thermal patterns throughout the data collection, as expected, due to decreasing lower extremity venous pooling based on non-gravity-assisted positions. While our infrared images concentrated on gathering data from specific AOI, the visual color images of larger areas demonstrated thermal changes affected by position, time, and MLD techniques (Figs. 7 and 9). A 2023 report noted the right-side dominance of venous drainage in the head/neck region, and this may correlate with the nonvalidated visual findings noted in our study41. A further investigation could correlate our findings with venous duplex ultrasound to determine venous distention, which has been performed in both spaceflight analogs and true weightlessness42.
With the exception of blood oxygenation, all other vitals changed over the course of the study (Table 6). Respiratory rate decreased, given that the participants were in a relaxing position. There was a decrease in body temperature due to the cooler room temperature set for subject’s comfort. Blood pressure increased while heart rate decreased, due to the HDT positioning causing the cephalic fluid shift, which increases cardiac output, with an increased stroke volume leading to a slower (or unchanged) heart rate6,7.
This exploratory study was limited by its noncomparative, retrospective design, and we already discussed the major statistical limitations of our small sample size. This sample size was a reflection of the challenge of volunteer participation, as maintaining a strict HDT position over time may be uncomfortable, induce headaches, and severely limit mobility. Generalizing the findings of our volunteers to highly trained astronauts may also be a limitation, but we controlled for possibilities of medical history that could impact the study variables by only including a young and (self-reported) healthy population. However, activities, such as exercise, which can activate lymphatic function that may then persist for 60–240 minutes, were not restricted. Entering a cool building from a warm, humid external environment (the study was performed in Ft. Lauderdale, Florida) may have also potentially impacted imaging results, but subjects sat for 15 minutes upon arrival to the study site to acclimate to the ambient temperature prior to positioning and imaging. There is a small possibility that having a predominantly female population (11/15 subjects) may have introduced some bias to our results, as females have less total body water (the weighted mean tissue water content) than men (50% vs 60%)43, and they have reduced blood oxygenation, muscle mass, oxidative potential, and capillary density compared to males44.
Our NIID protocol was limited by not performing a controlled baseline assessment in the sitting position prior to assuming HDT. However, our baseline assessment was taken immediately (1 minute) after assuming HDT and provided an appropriate measurement to demonstrate fluid redistribution over time.
We also did not perform NIID during MLD, and we do not know what the repeated or long-term effects of MLD may have in simulated microgravity. Near-infrared fluorescence lymphatic imaging (NIRFLI) could have important correlative benefit for determining dermal lymphatic function. NIRFLI collects NIR fluorescent signals emanating from the lymphatics following the off-label administration of indocyanine green (ICG) and can be administered with concurrent MLD to assess changes in fluid flow45. NIRFLI was used in an HDT model to evaluate the effect of gravity on deep cervical lymphatic flow via palatine tonsil injection of ICG46. While subjects were in the HDT position, NIRFLI demonstrated that lymphatic drainage shared pathways with cerebral spinal fluid outflow that are dependent upon gravity and are impaired when subjected to short-term HDT. Of significance, NIRFLI determined lymphatic contractile rates following intradermal ICG injections of the lower extremities increased under the influence of gravity, regardless of force direction (sitting down or HDT). The implications of these outcomes provided evidence for the role of a lymphatic contribution in SANS46.
Our LWIT and NIRS analyses were limited by the absence of advanced medical imaging software that more comprehensively quantifies and validates changes of the pixel data points generated by each image47 (Figs. 9 and 8). Trained and experienced imagers visually analyzed these images in the current study, but this software will be needed for future study for definitive validation and image comparisons that are not purely subjective. Additionally, the data points or AOIs for the NIRS and LWIT devices were hand-selected for analysis, which may have led to subtle variation in area of interest or inter-rater error.
Importantly, despite the study limitations, this exploratory study demonstrated the feasibility of NIID for the immediate and continuous monitoring of fluid shifts experienced in weightlessness and that MLD appeared to reverse trends in fluid redistribution that were more prominently observed after 180 minutes in the HDT spaceflight analog. A follow-up comparative study of a larger sample size with a 6-hour (360-minute) time horizon is warranted to confirm our preliminary findings.
This proof-of-concept study piloted the use of innovative NIID to assess fluid redistribution at point of care during a validated spaceflight analog and supported the potential use of MLD to mitigate fluid shifts. A lymphatic fluid scanner, NIRS, and LWIT documented fluid redistribution with altered perfusion and thermal energy in the head/neck, upper torso, and legs in simulated microgravity; changes were particularly noticeable after 180 minutes in the HDT position. In many affected areas, MLD appeared to have reversed trends, allowing for levels to return to or approach baseline after only 15 minutes of therapy. A larger, controlled study that uses NIID to analyze fluid shifts, perfusion changes, and temperature differentiation at up to 6 hours (360 minutes) during which MLD would be administered would be ideal to confirm our preliminary findings. MLD may prove to be an effective countermeasure used preflight, during flight, and postflight to manage and/or restore fluid shifts experienced during weightlessness.
Ultimately, NIID assessment could help establish baseline measurements to compare similar measurements in true weightlessness. Ideally, NIID will help guide or establish countermeasures specifically to address fluid shifts preflight, during early and late spaceflight, and postflight conditions, with the potential to have significant “spinoff” applications for fluid shift recognition in wound care and lymphedema clinics to improve outcomes through recognition and improved treatment protocols. NIID could also assist in personalized precision application of countermeasures, as it is increasingly understood that lymphatic function is likely to be variable from individual to individual48. The imaging modalities are light weight/low mass units that can swiftly acquire repeatable imaging shortly after entering weightlessness and over the crucial 2–7 days the crew members acclimate to the fluid redistribution; they allow for ground-based, remote assessment; and they do not require dye injections, radiation exposure, or significant training. The images could also be remotely assessed by ground-based experts for interpretation, as authors have done with ultrasound images42. In this time-limited HDT analog study, NIID demonstrated to have high potential for continuous monitoring for terrestrial models and in true weightlessness and supported the potential countermeasure use of MLD to mitigate fluid shifts. Further investigation is warranted to confirm these findings in a larger, controlled population.
Methods
Study design
In 2022, our university physical therapy department experimented with the novel use of NIID in the HDT position on healthy students with no known lymphatic dysfunction to analyze lymphatic flow, perfusion, and tissue temperature gradient in a validated spaceflight analog. To participate, students could not be on blood pressure or vasodilation medications, and they could not use any form of nicotine. After 180 minutes of being in the HDT position, some of these students also underwent 15 minutes of MLD while still in the HDT position. We performed a retrospective chart review of those students who underwent MLD while in the HDT position. There were 30 students who underwent NIID imaging in the HDT position from 6 April 2022, through August 15, 2022, 15 of whom (50%) also had MLD in the HDT position. All 15 students were included in this retrospective analysis.
The primary endpoints included: fluid shifts measured by a lymphatic fluid scanner and defined as percent change in TDC from baseline; perfusion changes, as defined by percent change in tissue oxygenation from baseline captured by NIRS; and percent change in tissue temperature gradient from baseline captured by LWIT; with all endpoints measured in 30-minute intervals from baseline through 225 minutes (with subjects in the HDT position from baseline to 195 minutes, undergoing MLD from 181 to 195 minutes, and in the sitting position from 196 to 225 minutes). Additional endpoints analyzed were changes in vitals, including heart rate, systolic blood pressure, diastolic blood pressure, blood oxygenation (measured by pulse oximeter), respiration rate, and body temperature.
Inclusion and ethics statement
This research project included local researchers throughout the entire study process, was locally relevant, and was performed in collaboration with local partners. Prior research on this topic, both locally and regionally, was taken into account in the literature review performed for the study rationale and interpretation of analysis. All roles and responsibilities were agreed amongst collaborators prior to study initiation, and the capacity-building of students as coinvestigators and coauthors was involved. This project would not have been severely restricted or prohibited in the study setting. The research did not result in stigmatization, incrimination, discrimination, or personal, safety, or security risk to subjects. Health risk to subjects was minimal and included nasal congestion and headache as a consequence of fluids becoming congested in the head during the 3-hour HDT position prior to MLD. Vitals were monitored during this time and investigators asked subjects how they were feeling and what they were experiencing to minimize discomfort. This study adhered to the Declaration of Helsinki and all relevant ethical regulations. The Nova Southeastern University IRB approved the study protocol (No. 2022-124), which was registered on clinicaltrials.gov (NCT06405282). Subjects provided their written informed consent to participate in this study. They also provided their written informed consent for publication, including the publication of their identifiable images.
There was no calculation for the sample size for this exploratory, pilot retrospective analysis. The sample size was determined from chart review and based on the number of subjects who underwent MLD therapy while in the HDT position.
Procedures
There were three different imaging devices that were donated in kind for use in this study and returned to manufacturers upon completion. A lymphatic fluid scanner (LymphScanner, Delfin Technologies, Miami, FL, USA) captured moisture readings and tissue edema by measuring TDC values at eight distinct AOI (including six of the head/neck region and two of the legs, as summarized in Table 7).
A NIRS device (SnapShotNIR, Kent Imaging, Calgary, Canada) captured perfusion changes by measuring tissue oxygenation, specifically a ratio of oxygenated and deoxygenated hemoglobin. The images were taken at 9 distinct anatomic locations summarized in chronological order in Table 7 (7 images of the head/neck region and 2 of the legs). Each image generated by NIRS has a reference color scale, representing tissue oxygenation saturation levels in percentages. A decrease in perfusion is noted as the value moves towards 0.
A long-wave infrared and wound imaging device (WoundVision Scout, WoundVision, Indianapolis, IN) captured 5 thermal images also at 5 distinct anatomic sites (three of the head/neck region and two of the legs) measuring physiological temperature differentiation (Table 7). LWIT measures the levels of thermal energy emitted from the human body because of physiological responses, which are translated to temperature gradients. Each thermal image has a reference long-wave LWIT color thermal energy gradient scale from −7 °C to 7 °C for the AOI. Normal thermal differentiation compared to surrounding tissue is in the range of −1 °C to +1 °C49. A reading >0 °C is considered hyperperfused or warmer, while <0 °C is considered hypoperfused or cooler.
Prior to NIID imaging, subjects arrived at a predesignated room for assessment and data collection. Subjects acclimated to the room and ambient temperature by sitting quietly for 15 minutes before assuming the HDT position. Vitals were taken and monitored at baseline and every 30 minutes through the end of each imaging session. Participants disrobed down to their shorts (women also wore sports bras) and positioned themselves in HDT using an inversion table (Fitspine XC5 Inversion Table, Bonney Lake, WA, USA). The table was first locked into place to allow them to position themselves correctly, and their ankles were secured prior to being placed in a 6-degree HDT position, as indicated by the table and confirmed using a smartphone inclinometer app (Inclinometer and Bubble Level, EzeShare File Transfer).
Four trained imagers participated in this study and followed the imaging protocol summarized in Table 7. One of the 4 imagers took baseline assessments using the NIID 1 minute after assuming the HDT position. Reassessments were performed every 30 minutes thereafter through 180 minutes. Each image acquisition was performed in 15 to 30 seconds. After 180 minutes in the HDT position, subjects remained in position while receiving 15 minutes of MLD to the head, neck, and upper torso. Table 8 describes the established MLD protocol, which involved central decongestion and priming of the system (stimulation of terminus and nodes), short neck treatment, facial MLD, and therapy applied to the venous angle. Immediately post-MLD (195 minutes after baseline assessment), reassessment with the devices occurred. Subjects then were placed in a sitting position to simulate their return to normal gravity from spaceflight analog positioning, allowing permissive gravity-assisted drainage of the head, neck, and upper torso. A follow-up reassessment was taken with the devices 30 minutes after MLD (225 minutes after baseline assessment) to assess potential changes and resolution of any symptoms experienced in any of the positions.
Data collection and analysis
All data, including patient characteristics, were transcribed to an Excel spreadsheet. Exploratory analysis comprised descriptive statistics to summarize baseline characteristics in the study cohort. Descriptive statistics were reported as frequencies with percentages for categorical variables and medians with IQRs for continuous variables. Beta regression was used to analyze marginal means with robust-clustered SEs to examine within-group change in TDC and tissue oxygenation saturation by timepoint. The beta distribution is a continuous probability distribution that uses the interval [0,1], making it a suitable distribution for the random behavior of percentages. A mixed, random-effect model was used to examine within-group change in vital statistics and LWIT at AOI. As 5 LWIT measurements were taken per position (front, left side, and right side of head/neck and left and right legs), the mean was compared between the 5 measurements. In all models, the fixed effects were timepoint [“Baseline”, “Post-30 min”, “Post-60 min”, “Post-90 min”, “Post-120 min”, “Post-150 min”, “Post-180 min”, “Post-195 min (Post-MLD)”, “Post-225 min (30-minutes-post-MLD)”]. All analyses used robust-clustered SEs to account for the violation of observation independence and homoscedasticity. Bounded data, such as percentages, often give rise to uncorrectable skewness and heteroscedasticity, and we needed to account for the correlated nature of the repeated measures. We used Dunnett’s test to compare change against the baseline timepoint. Outcomes are reported as means with 90% CIs. Hypothesis testing was all two-sided, where significance was found at p < 0.10 to balance Type 1 and Type 2 error rates for our given sample size. Following the work of Maier and Lakens50, increasing the Type 1 error rate from 0.05 to 0.10 reduced the Type 2 error rate from 0.20 to 0.12 and the combined error rate from 0.12 to 0.10. All statistical analyses were completed using available packages in R version 4.0.3 or higher (R Foundation, Vienna, Austria) and STATA 18.1 (College Station, TX, USA).
optimal locomotion in theory, in vivo, and in robots")

Responses