Using virtual reality to study spatial mapping and threat learning

Introduction
Using spatial mapping processes to identify safe and dangerous areas in an environment is crucial for survival. Therefore, elucidating factors that affect the processes of spatial learning and navigation is essential to understanding why some individuals fail to discriminate between areas within their environment, leading to maladaptive behaviors. However, studies examining spatial mapping in threatening contexts have primarily focused on evaluating spatial memory performance under a threat of shock unrelated to the task1,2 or only focused on those who successfully conditioned to a threat3,4,5. Therefore, factors that affect one’s ability to learn about threats in an environment through spatial mapping processes are poorly understood, especially in individuals who do not learn to discriminate between contextual cues.
Traditionally, studies examining threat learning have used classical conditioning paradigms, where a neutral stimulus is paired with an aversive stimulus (e.g., electric shock). However, contextual threat conditioning links the aversive stimulus to an environmental context (e.g., presentation of a light; for a review, see Lonsdorf et al.6). Contextual conditioning can engage spatial mapping processes by directing attention to landmarks and forming a cognitive representation of the environment7,8,9. The creation and utilization of this mental representation are considered crucial for successful conditioning and discrimination10.
Research presents mixed findings regarding anxiety’s role in threat conditioning learning and discrimination. Some studies show no association between state (transitory emotional response)11 or trait anxiety (anxiety as an aspect of personality)12,13,14 and learning. Other studies show that individuals with high trait anxiety have heightened fear responses to conditioned safety or neutral cues13,15,16,17 and reduced threat and safety contingency awareness18,19,20. However, the impact of anxiety on contextual discrimination learning, especially focusing on those who do not learn the contingencies, has not been studied.
Few threat learning and discrimination studies have explored differences between those who acquire conditioning (i.e., learn to discriminate between threat and safety based on contextual cues) and those who do not12,18,19,21. Two studies examined factors, such as anxiety and attention control, affecting threat learning based on both discrete and contextual cues12,18. Trait anxiety was not significantly associated with contingency learning12,18, but self-reported attentional control was significantly higher in those who learned cue contingencies compared to those who did not12. In both studies, participants who did not learn both cue and context contingencies were excluded, and participants could not freely navigate or make any navigation-related decisions12,18. Virtual reality (VR) technology can serve as a useful tool to address this gap. In VR, participants can freely navigate and interact with a 3D virtual environment in first-person perspective as they would in the real world. During VR experiments, participants may engage with their environment via a headset (immersive VR) or a desktop screen (non-immersive VR). In the current study, participants freely navigated a non-immersive virtual environment in which flowers appeared and were “picked”. The environment was divided in half so that flowers picked in one half predicted an aversive stimulus (electric shock), while flowers picked in the remaining half predicted no outcome. Participants were instructed to determine if there was a relationship between the position of the flowers, local landmarks, and if they received shocks. Our task differs from previous conditioning paradigms in that contingencies are based solely on contextual location-specific cues, allowing us to assess participants’ contextual threat learning and spatial mapping more accurately.
We previously described the behavioral and physiological profile of individuals who learned to discriminate between safety and threat within an environment4,5; however, results focused solely on individuals who learned the contingencies of the paradigm and did not explore how individual differences, such as state or trait anxiety, may affect learning. To our knowledge, no study has explored how individual differences affect acquisition during spatial threat learning. We postulate anxiety affects spatial mapping, hindering contextual threat learning. The primary aim of this exploratory study was to examine the potential effect state and trait anxiety have on spatial mapping and contextual threat learning. Thus, we compared the state-trait anxiety profiles of those who learned the contingencies of our VR contextual threat conditioning task (i.e., learners) with the profiles of those who did not learn (i.e., non-learners). Additionally, this study aimed to explore differences in learning, and how reinforcement rate may account for such differences. Therefore, we compared profiles of learners and non-learners from experiments using three different reinforcement rates (35%, 50%, 60%).
Results
Participants navigated a circular, non-immersive virtual environment with both distal (clouds, sun, mountains) and local (two beehives) cues, collecting flowers that appeared randomly. Some flowers delivered an electric shock, and participants were tasked with identifying the pattern of shock occurrence. Unbeknownst to them, the environment was divided into safe and dangerous zones, with varying shock probabilities (35%, 50%, or 60%) in the dangerous area.
Learners by reinforcement rate
After the VR task, participants were categorized as learners if they correctly identified the safe and dangerous zones. The task that employed a 50% reinforcement rate yielded the most learners (79.31% of the sample). For the tasks that used a 60% or 35% reinforcement rate, learners made up 72.41% and 50.00% of the samples, respectively.
Object placement distance error
In the spatial memory task, after every four conditioning trials, participants completed one trial where they learned the locations of four neutral objects (wooden box, gas can, book, and clock), placed in different quadrants of the virtual environment. In the first four trials, participants collected each object from its original location. Over 16 additional trials, they were asked to return each object to its original location, with randomized order in four iterations (one object per iteration). Feedback was provided by showing the object in its correct location after each trial. We compared participants’ object placement to the original location of each object (distance error; Fig. 1) using a 2 × 4 × 2 × 3 ANOVA with group (learner, non-learner), iteration (I1–I4), zone (danger, safety), and reinforcement rate (35%, 50%, 60%) as factors.

Changes in object distance error across iterations (I1-4) for learners (left panel) and non-learners (right panel) in the safe (blue line) and dangerous (orange line) zones of the environment.
We found significant group by zone by reinforcement rate (F(2, 512) = 3.13, p = 0.045, ηp² = 0.01), and group by reinforcement rate (F(2, 512) = 13.02, p = 3 × 10⁻⁶, ηp² = 0.05) interactions. We also found significant main effects of group (F(1, 512) = 21.12, p = 5 × 10⁻⁶, ηp² = 0.04) and iteration (F(3, 512) = 18.09, p = 4 × 10-11, ηp² = 0.10). All other results had a p-value above 0.1. For a full breakdown of the reinforcement rate effects and follow-up tests not directly relevant to the comparison between groups, see the supplementary materials (Supplementary figs. 1 to 3).
To clarify the directionality of the findings above, we conducted Tukey’s HSD post hoc analysis. We found that learners, compared to non-learners, placed objects significantly closer to their original location (p = 5 × 10⁻⁶, 95%CI[−21.762, −7.282]).
Object and location memory
After the VR task, we compared participants’ memory of the virtual environment, including the number of object names and locations they remembered, using Welch’s t-test.
We found no significant difference in the number of recalled object names between groups (t(19) = 1.00, p = 0.330, 95%CI[−0.055, 0.155]; mean = 3.99, SD = 0.12). However, we found a trending difference in the number of recalled object locations between groups (t(20.06) = 1.82, p = 0.085, 95%CI[−0.073, 1.053]; learners: mean = 3.94, SD = 0.31; non-learners: mean=3.45, SD = 1.19), where learners, compared to non-learners, identified more object locations when asked at the end of the task.
State-trait anxiety inventory (STAI)
On the day of the study, participants completed the Spielberger State-Trait Anxiety Inventory (STAI) Forms Y-1 and Y-2 before the task to assess state and trait anxiety, and Form Y-1 again after the task to remeasure state anxiety. We compared participants’ trait anxiety scores using a 2 × 3 ANOVA with group and reinforcement rate as factors. However, we found no significant differences in trait anxiety scores. The trait anxiety scores ranged from 21.00 to 60.00, with a mean = 36.39 and SD = 9.13.
Next, we compared participants’ state anxiety scores (Fig. 2) using a 2 × 2 × 3 ANOVA with time (pre-task and post-task), group, and reinforcement rate as factors. We found a significant main effect of group (F(1) = 14.31, p = 2 × 10⁻⁴, ηp² = 0.10) and time (F(1) = 21.98, p = 6 × 10⁻⁶, ηp² = 0.14) in the state anxiety scores. All other results had a p-value above 0.1.
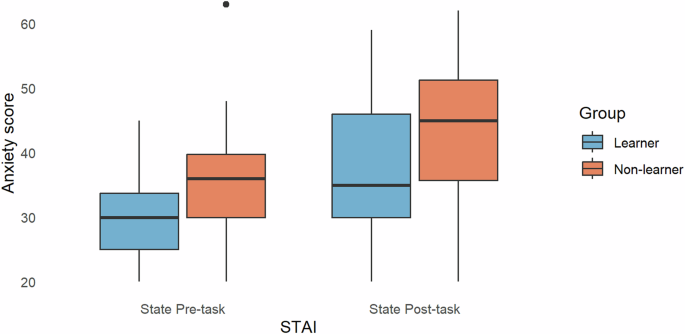
State Anxiety scores (STAI State) for learners (blue) and non-learners (orange) before (left panel) and after (right panel) the task. Learners had lower state anxiety scores than non-learners. Anxiety scores increased from pre- to post-task for all. Outliers are represented by a black dot.
To clarify the directionality of the findings above, we conducted Tukey’s HSD post hoc analysis. We found that non-learners, compared to learners, had significantly higher combined state anxiety scores (p = 2 × 10⁻⁴, 95%CI[3.165, 10.105]). Learners’ combined state anxiety scores ranged from 20.00 to 59.00, with a mean = 33.19 and SD = 9.39. Non-learners’ combined state anxiety scores ranged from 20.00 to 63.00, with a mean = 39.83 and SD = 11.20. Across both groups combined, pre-task state anxiety scores were significantly lower than post-task state anxiety scores (p = 6 × 10⁻⁶, 95%CI[-10.564, -4.293]). The pre-task anxiety scores ranged from 20.00 to 63.00, with a mean = 31.37 and SD = 7.95. The post-task anxiety scores ranged from 20.00 to 62.00, with a mean = 38.80 and SD = 11.17.
SCL
We compared participants’ skin conductance level (SCL; Fig. 3), as they approached flowers, using a 2 × 4 × 2 × 3 ANOVA with group, quarter (Q1-4), zone, and reinforcement rate as factors.
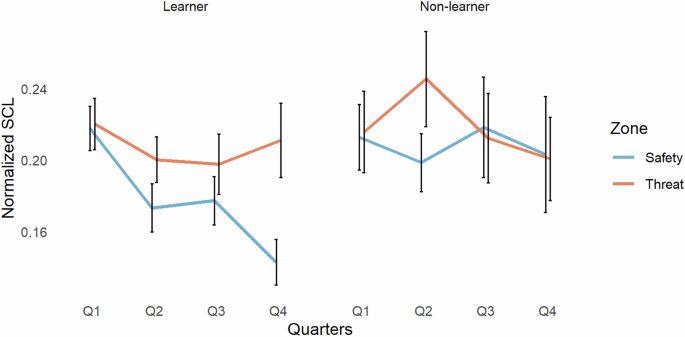
Changes in skin conductance level (SCL) across quarters (Q1-4) for learners (left panel) and non-learners (right panel) in safe (blue line) and dangerous (orange line) zones of the environment.
We found significant group by reinforcement rate (F(2, 459) = 6.43, p = 0.002, ηp² = 0.03) and quarter by reinforcement rate interactions (F(6, 459) = 2.75, p = 0.012, ηp² = 0.03). We also found a significant main effect of group (F(1, 459) = 5.17, p = 0.023, ηp² = 0.01), quarter (F(3, 459) = 3.02, p = 0.029, ηp² = 0.02), and zone (F(1, 459) = 6.46, p = 0.011, ηp² = 0.01). All other results had a p-value above 0.1. For a full breakdown of the reinforcement rate effects and follow-up tests not directly relevant to the comparison between groups, see the supplementary materials (Supplementary figs. 4 to 6).
To clarify the directionality of the findings above, we conducted Tukey’s HSD post hoc analysis. We found that learners, compared to non-learners, had significantly lower SCL across the task (p = 0.027, 95%CI[−0.041, −0.003]).
SCR
We compared skin conductance response (SCR; Fig. 4), as participants were held stationary after interacting with a flower, using a 2 × 4 × 2 × 3 ANOVA with group, quarter, zone, and reinforcement rate as factors.
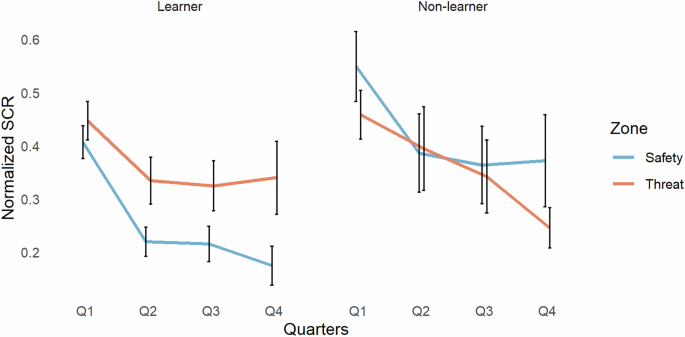
Changes in skin conductance response (SCR) across quarters (Q1-4) for learners (left panel) and non-learners (right panel) in safe (blue line) and dangerous (orange line) zones of the environment.
We found significant group by zone (F(1, 459) = 7.91, p = 0.005, ηp² = 0.02) and quarter by reinforcement rate interactions (F(6, 459) = 2.622, p = 0.016, ηp² = 0.03). We also found a significant main effect of group (F(1, 459) = 11.22, p = 9 × 10⁻⁴, ηp² = 0.04), quarter (F(3, 459) = 12.55, p = 6 × 10⁻⁸, ηp² = 0.08), zone (F(1, 459) = 6.05, p = 0.014, ηp² = 0.01), and reinforcement rate (F(2, 459) = 21.90, p = 8 × 10⁻¹⁰, ηp² = 0.08). All other results had a p-value above 0.1. For a full breakdown of the reinforcement rate effects and follow-up tests not directly relevant to the comparison between groups, see the supplementary materials (Supplementary Figs. 7 to 9).
To clarify the directionality of the findings above, we conducted Tukey’s HSD post hoc analysis. We found that learners, compared to non-learners, had significantly lower SCR in the safe zone of the environment (p = 1 × 10⁻⁴, 95%CI[−0.064, −0.253]). Learners also had a significantly lower SCR in the safe zone of the environment compared with the dangerous zone (p = 0.002, 95%CI[−0.027, −0.171]). Overall, learners, compared to non-learners, had significantly lower SCR across the task (p = 0.001, 95%CI[−0.034, −0.140]).
Expectancy ratings
After each flower was collected, participants rated their expectancy of receiving a shock on a 0-9 scale. We compared participants’ shock expectancy ratings (Fig. 5) using a 2 × 4 × 2 × 3 ANOVA with group, quarter, zone, and reinforcement rate as factors.
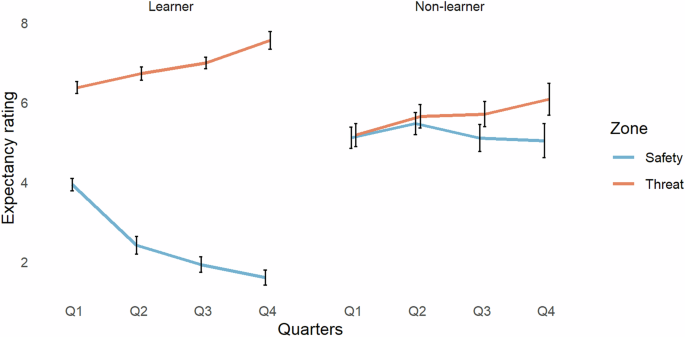
Changes in shock expectancy rating across quarters (Q1-4) for learners (left panel) and non-learners (right panel) in the safe (blue line) and dangerous (orange line) zones of the environment.
We found significant interactions in: group by quarter by zone (F(3, 439) = 4.49, p = 0.004, ηp² = 0.03), group by quarter by reinforcement rate (F(1, 439) = 3.70, p = 0.026, ηp² = 0.01), group by zone (F(1, 439) = 247.79, p = 1 × 10-16, ηp² = 0.34), group by quarter (F(3, 439) = 4.91, p = 0.002, ηp² = 0.03), and quarter by zone (F(3, 439) = 25.57, p = 3 × 10-15, ηp² = 0.15). We found significant main effects of group (F(1, 439) = 42.51, p = 2 × 10⁻¹⁰, ηp² = 0.09), quarter (F(3, 439) = 5.11, p = 0.002, ηp² = 0.02), zone (F(1, 439) = 791.46, p = 1 × 10-16, ηp² = 0.64), and reinforcement rate (F(2, 439) = 5.52, p = .004, ηp² = 0.01). All other results had a p value above 0.1. For a full breakdown of the reinforcement rate effects and follow-up tests not directly relevant to the comparison between groups, see the supplementary materials (Supplementary Figs. 10 to 12).
To clarify the directionality of the findings above, we conducted Tukey’s HSD post hoc analysis. We found that learners rated their expectancy of a shock significantly higher in the dangerous zone compared to the safe zone across all quarters (quarter 1 threat vs. safety: p = 1 × 10-16, 95%CI[1.578, 3.330], quarter 2 threat vs. safety: p = 1 × 10-16, 95%CI[3.457, 5.209], quarter 3 threat vs. safety: p = 1 × 10-16, 95%CI[4.196, 5.957], and quarter 4 threat vs. safety: p = 1 × 10-16, 95%CI[4.735, 6.920]). In the safe zone, learners gave significantly lower shock expectancy ratings in quarters 2 (p = 5×10⁻⁷, 95%CI[−2.402, −0.650]), 3(p = 1×10-16, 95%CI[−2.883 −1.131]) and 4 (p = 1 × 10-16, 95%CI[−3.213, −1.332]) compared with quarter 1. Learners, compared to non-learners, rated their expectancy of shock significantly higher in the dangerous zone (p = 1 × 10⁻¹⁰, 95%CI[1.639, 0.742]) and significantly lower in the safe zone (p = 1 × 10-16, 95%CI[−2.204, −3.093]). Non-learners did not show a significant difference in shock expectancy ratings in the dangerous zone compared to the safe zone in any quarter of the experiment, and their ratings did not differ between quarters in either zone individually. There were no between reinforcement rate effects in the group by quarter by reinforcement rate interaction (see supplementary materials for the within reinforcement rate effects). Across the task, learners rated the expectancy of the shock significantly higher in the 1st quarter than the 2nd (p = 0.026, 95%CI[.038, 1.134]), 3rd (p = 0.002, 95%CI[0.181, 1.279]), and 4th (p = 6 × 10⁻⁵, 95%CI[0.350, 1.578]). Across the task, non-learners rated the expectancy of the shock significantly higher learners in the 2nd (p = 0.0003, 95%CI[0.332, 1.749]), 3rd (p = 0.0003, 95%CI[0.324, 1.756]), and 4th quarter (p = 0.001, 95%CI[0.322, 2.101]). Across the task, non-learners rated the expectancy of the shock significantly higher than learners (p = 2 × 10⁻¹⁰, 95%CI[0.557, 1.038]).
Discussion
The findings of this exploratory study give insight on how individual differences in anxiety may affect spatial mapping and contextual threat learning. We found that non-learners displayed poorer spatial memory of their environment as measured by increased object placement distance error when placing the objects in the environment. Non-learners overgeneralized the presence of threat, as shown by their significantly higher SCR and threat expectancy ratings compared to learners in the safe zone. Non-learners, compared to learners, were more anxious overall, as measured by GSR and by state anxiety scores.
We found that with our task, using a reinforcement rate of 50% generated the most learners. Perhaps a reinforcement rate of 50% induces just the right amount of stress- enough to enhance threat detection and learning, consistent with the previous research22.
We found no significant differences between learners and non-learners when comparing recollection of the names of neutral objects (objects not associated with a threat) during the post-task interviews. However, learners, compared to non-learners, were significantly more accurate in recalling the location of neutral objects during the task, as measured by object placement distance error and a number of object locations recalled during post-task interviews. These findings are consistent with previous research on emotional arousal and impaired spatial memory retrieval2,7, where anxiety was found to impair performance in a virtual spatial radial maze task and was associated with reduced use of spatial learning strategies. Additionally, non-learners did not learn the location of the danger zone, further suggesting impaired spatial mapping. Research in cognitive resources availability and management shows that severe, but not mild, induced anxiety negatively impacts participants’ cognitive task performance, suggesting that at some point the management of anxiety takes over the cognitive resources implicated in decision-making22. The electric shock used in this study was individually configured to be a mild stress inducer; however, it appears that higher anxiety during the task (as per GSR) overwhelmed non-learners during the spatial learning of valenced objects. Another potential explanation is that anxiety triggers compensatory strategies like enhanced attention allocation toward potential threats22,23, which may bias attention away from the environmental context that is actually predictive of where the threat is located.
Non-learners, compared to learners, had significantly higher state anxiety scores. Interestingly, we did not find any differences in trait anxiety between groups. Transient arousal (state anxiety) and the presence of threat may influence spatial mapping in non-learners via attention allocation. According to attentional control theory, anxiety may impair performance via increased competition among attentional resources, thereby reducing attention to the ongoing task24. Indeed, state and trait anxiety have been linked to poor attentional control and reduced cognitive performance in tasks where task-irrelevant threat-related or neutral stimuli are present24,25,26. One study claims that although both state and trait anxiety are related to attentional control deficits, therefore affecting cognitive performance, the two may affect different networks of attention in distinct ways26. Additionally, in uncertain situations, anxiety allocates attentional resources to threat detection mechanisms27 and is associated with attentional bias toward threat-related stimuli24,25,28. Non-learners of our task may have an increased attention toward threat-related stimuli, which could be attributed to a feeling of uncertainty during the task, and therefore their more anxious state. Failure to inhibit this attentional bias may result in a lack of attention to the surrounding environment, which contains contextual cues (e.g., local and distal landmarks) that are useful for the creation of a cognitive map and the prediction of the shock contingencies. Thus, non-learners may not have a well-defined mental representation of the environment – hindering their ability to discriminate between safe and dangerous zones of the environment.
Non-learners, compared to learners, showed significantly higher SCR and threat expectancy ratings in the safe zone. In other words, while learners showed differential responses to the safe and dangerous zones, suggesting successful discrimination, non-learners did not. Instead, non-learners displayed hyperarousal in the safe zone, suggesting that non-learners overgeneralized the presence of threat. Conditioning studies also show that healthy adults can discriminate between safe and threatening cues29,30, and our results support these findings in the learner group. In the non-learner group, decreased performance on the spatial memory task may provide insight as to why they were unable to discriminate between safe and dangerous zones of the environment. Non-learners, who were unable to accurately locate neutral objects in the environment, could lack an accurate mental representation of the environment itself. Lack of an accurate mental representation of the environment could hinder discrimination learning, especially when location in the environment is predictive of the aversive stimulus. Furthermore, in an environment where threat occurs based on location, having a poor cognitive map of threat in the environment could induce additional anxiety, as it becomes uncertain to the participant when they will receive a shock. This uncertainty could induce anxiety during the task and explain physiological hyperarousal and increased expectation of threat in safe zones. Previous work has shown that healthy adults with task-induced anxiety show disruption in conditioning acquisition22. Moreover, conditioning studies in anxiety disorders and posttraumatic stress disorders (PTSD) have shown similar disruptions in conditioning acquisition30,31. Specifically, participants with pathological anxiety and healthy participants with task-induced anxiety show overall higher arousal in response to safe cues22,29,31. Likewise, non-learners in this study overgeneralized the threat, responding with higher arousal toward cues that resembled threatening cues, even in the safe zone. While past research primarily employed models of conditioning that used stationary images or video, this study used free exploration of a naturalistic VR environment, expanding the knowledge about the effect of anxiety on spatial mapping and navigation. It is important to note that in a recent study, we found that patients with generalized anxiety disorder (GAD) still learned the contingencies of the task, although they engaged different brain networks to complete the task than those engaged by healthy participants5. However, this study only focused on learners, and did not include non-learners in either group. Furthermore, this study showed similar SCR, SCL, and expectancy rating patterns in both healthy adult learners and adult learners with GAD, suggesting that the mental state (anxiety state) during the task might predict the ability to create an accurate mental representation of the environment, attend to the environmental cue, and therefore discriminate between safe and threatening areas. Nonetheless, it is possible that deficits in discrimination learning in non-learners of the current study cannot be solely explained by heightened anxiety during the task.
There are several limitations of this study that should be noted. First, the sample sizes (learners and non-learners) are unbalanced, and the size of the non-learner sample is small relative to the learner sample. To our knowledge, this is the first study to look at individual differences in learning during a location-based threat conditioning paradigm in which participants can freely navigate a virtual environment. Therefore, the results of this exploratory study should be considered preliminary and interpreted with caution. Future studies should continue to explore these differences in bigger samples. Second, we pooled the data from three experiments that used different reinforcement rates to increase the power of statistical analysis. It is important to note that while the experiments used different reinforcement rates, we saw no significant differences between the experiments in the outcome measures of interest. Overall, we found the same effects and patterns, albeit at different power, across three reinforcement rates. While integrating the cohorts allowed us to see the differences in anxiety between learners and non-learners, we suggest viewing our findings as preliminary, and this work should be substantiated by further studies. Finally, our study did not focus on the mental health history of participants to assess trauma. All participants reported no past or present history of psychopathology, but trauma was not assessed. Furthermore, the study did not assess other potential channels of learning that could explain the differences between groups, such as attention allocation and selection history. We recommend that future studies assess trauma and examine attention allocation during the formation of mental maps to further understand the underlying mechanisms of forming, updating, and maintaining an accurate mental representation of the environment.
This is the first study to explore individual differences affecting spatial memory and contextual threat learning within a single, naturalistic VR environment that participants were able to freely explore. We found that impaired discrimination learning and impaired spatial memory are associated with greater anxiety when navigating an environment where threat is present. These findings contribute to the understanding of the effect of anxiety on navigational abilities and spatial learning. We suggest that future studies include an attention allocation assessment (e.g., eye-tracking) to clarify the mechanism behind some participants’ inability to learn safety cues, and a more detailed psychological assessment of participants that includes trauma exposure to rule out the possibility of any past or current undiagnosed psychological disorders.
Methods
Participants
A new sample of 70 healthy student volunteers (46 female) between 20 and 30 years old (mean age = 22.99; SD = 2.85) were recruited from the University College London (UCL). Participants were categorized as learners (n = 50) if they correctly identified the safe and dangerous zones of the environment; participants were categorized as non-learners if they could not identify the zones. All volunteers were right-handed, free of neurological or psychological impairments, as indicated via self-report, and provided written informed consent before participating. After completing the study, participants were debriefed and reimbursed for their time. The UCL Research Ethics Committee approved this study (Project ID Number: 1338/006).
Pre-task questionnaire
On the day of the study, prior to the task, participants completed the Spielberger State-Trait Anxiety Inventory (STAI)32 Forms Y-1 and Y-2 to assess state and trait anxiety, respectively, and the Raven Progressive Matrices to measure visual intelligence.
VR conditioning task
Participants were instructed to navigate a circular non-immersive virtual environment containing distal cues (clouds, sun, and mountains) and local cues (two beehives) and pick flowers that appeared one at a time in random locations (Fig. 6). Participants were informed that the flowers, identical in appearance, might contain a bee that would sting them, represented by an electric shock. The participants were also asked to figure out the pattern of bee stings. Unbeknownst to the participants, the environment was divided into two halves centered around each beehive. Half of the environment was associated with danger, where flowers were paired with a shock at different reinforcement rates; the other half of the environment was associated with safety, where flowers were never paired with a shock. Upon picking a flower (80 trials), participants were prompted to rate their expectancy of receiving a shock on a scale from 0-9 (0 for no shock, 9 for definite shock). After entering their rating, the participant’s avatar was held stationary for 2000ms-8000ms (during which participants anticipated receiving a shock, and their skin conductance was recorded). Then, participants received a shock (or not, according to their location in the environment and chance), and proceeded to collect the next flower. While the experiments used different reinforcement rates (35%, 50%, and 60%) for three independent non-overlapping groups (n = 12, n = 29, and n = 29 respectively), overall, we found mainly the same directionality of effects and mainly the same effect size, across the three reinforcement rates. Therefore, we pooled the data across the three reinforcement rate studies to maintain the clarity of our paper and used the reinforcement rate as a factor of interest in the analysis (for a full breakdown of individual reinforcement rates, see supplementary materials). The full data analysis specific to each reinforcement rate can be found in the supplementary analysis, particularly for any significant interaction or main effect.
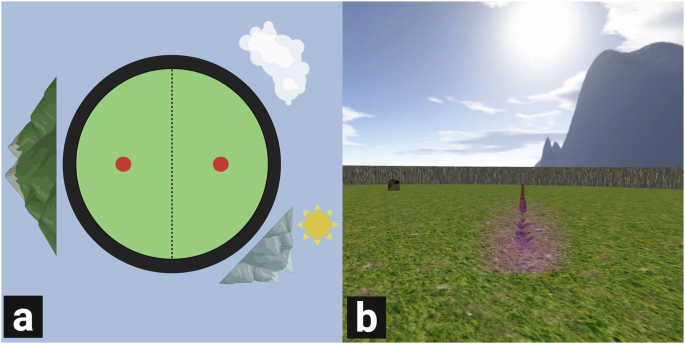
a The virtual environment containing local and distal cues, schematic view from the top. The environment is divided into safe and dangerous halves. The beehives are represented by red circles. b The virtual environment with a flower in the center, a beehive off to the left, and distal cues (mountain and the sun), as seen by participants. Created in BioRender. Rjabtsenkov, P. (2024) BioRender.com/a70h721.
Electrical stimulation
A Digitimer DS7A electrical stimulator (Digitimer, Welwyn Garden City, UK) was used to deliver electrical stimulations (shocks), each lasting 2 ms in duration, to the left hand through an Ag/AgCl electrode. Before the task, participants received a series of shocks, starting at 1.2 mA, and rated the level of pain of each shock on a scale of 1-10. Shock intensity was adjusted for each participant to a level that was described as uncomfortable but not painful.
Galvanic skin response (GSR)
GSR was measured throughout the task as an index of anxiety via 8-mm Ag/AgCl electrodes attached to the middle phalanges of the index and middle fingers of the participant’s left hand. Data were acquired using a custom-built constant voltage coupler (2.5 V) with output converted into an optical pulse frequency. The optical signal was then converted to voltage pulses and recorded throughout the experiment (Micro 1401/Spike 2; Cambridge Electronic Design).
Spatial memory task
After every four trials of the conditioning task, participants performed one trial of a spatial memory task that required them to learn the locations of four different, non-valenced objects (wooden box, gas can, book, and clock) that were never paired with shocks. For the first four spatial memory trials, each object appeared in its original location, and the participant collected it. One object was located in each quadrant of the environment. After the first four spatial memory trials, participants completed 16 additional spatial memory trials, during which they were prompted on the screen to return an object by dropping it in its original location. After the participant dropped the object, it reappeared in its original location and the participant collected it again, which served as feedback for the next time the participant had to return the object. The 16 trials were divided into four phases (iterations) so that participants had to return each object once per iteration before the next iteration of objects was presented; however, within each iteration, the order of the objects was randomized. This procedure has been used in earlier studies (Suarez-Jimenez et. al. 2018, 2021).
Post-task questionnaire
At the end of the task, participants were asked to identify the dangerous and safe zones of the environment, name the four objects, and describe the location of each object. Participants identified the zones and object names by verbally responding to questions asked by the researcher. Specifically, participants were asked 1) to name the four objects they were collecting; 2) if there was a pattern on the bee stings; and 3) which beehive was the dangerous one. Answer options for post-task questions were not provided; they had to be verbally recalled. Participants who correctly identified the dangerous and safe zones of the environment in their verbal response were categorized as learners (35% reinforcement rate: n = 6, 50% reinforcement rate: n = 23, 60% reinforcement rate: n = 21); participants who incorrectly identified the dangerous and safe zones of the environment were categorized as non-learners. After the task, all participants completed STAI Form Y-1 to measure state anxiety again.
Data analysis
The spatial memory of the virtual environment was measured by object placement distance error (i.e., the difference in distance from the location where the participant placed the object compared to the original location of the object). Object distance data were analyzed in R using repeated measures multivariate ANOVAs to test differences between groups (i.e., learners and non-learners), quarter (or iteration in the object distance), zone (i.e., danger and safety), and shock reinforcement rate (35%, 50%, and 60%). Tukey’s Honest Significant Differences (HSD) test was conducted post-hoc on significant findings to assess the directionality of the results. ANOVA effect size is reported as partial ETA squared (ηp²).
Participants’ memory of the virtual environment was analyzed in R by averaging participants’ answers for the number of object names recalled and for the number of object locations recalled. A Welch’s t-test was conducted for each measure to test differences between groups.
Trait anxiety scores (as measured by STAI Trait Y-2) were analyzed in R using a multivariate ANOVA comparing groups (learners and non-learners) and shock reinforcement rate (35%, 50%, and 60%). State anxiety scores (as measured by STAI State) were analyzed in R using a multivariate ANOVA comparing groups (learners and non-learners), time (pre-task and post-task Y-1), and shock reinforcement rate. Tukey’s HSD test was conducted post-hoc on significant findings to assess the directionality of the results. ANOVA effect size is reported as partial ETA squared (ηp²).
Data processing and analysis of skin conductance were performed using MATLAB. GSR data were down-sampled to 200 Hz and then synchronized to the task. GSR was assessed during two periods of the conditioning task. First, the mean skin conductance level (SCL) during each trial was quantified as “tonic skin conductance level” as participants approached the flower. SCL was quantified based on the final three-quarters of the approach period, from flower appearance until the participant picked the flower. SCL was calculated by measuring the mean skin conductance from the beginning of the active approach until right before the participant picked the flower for each trial. Second, skin conductance responses (SCR) were analyzed during the stationary period to examine phasic changes in anticipation of the shock outcome. SCRs were calculated for every trial by subtracting the minimum SCR during the stationary period from the maximum SCR (peak). Any response difference under 0.03 micro-Siemens was scored as zero. SCRs were log-transformed (log [1 + SCR]) to normalize the distribution and then range-corrected ([SCR-SCRmin]/[SCRmax-SCRmin]) to control for individual variation in response. The same correction was applied to the SCLs. For analyses, SCL and SCR data were averaged into equal quarters (quarter; Q1-Q4) across the duration of the experiment, with 10 trials in each quarter per condition (zone; danger, safety). ANOVA effect size is reported as partial ETA squared (ηp²).
Each expectancy rating (0-9) was averaged across trials for each quarter (quarter; Q1-Q4) of the experiment per condition (zone; danger, safety), creating equal quarters of 10 trials for each condition.
GSR data and expectancy ratings were analyzed in R using repeated measures multivariate ANOVAs to test differences between groups (i.e., learners or non-learners), quarter (or iteration in the object distance), zone, and shock reinforcement rate. Tukey’s HSD test was conducted post-hoc on significant findings to assess the directionality of the results.
We used a Chi-square test in R to assess differences in sex and an independent-sample t-test in R to assess group differences in age and visual intelligence as per the Raven’s Progressive Matrices. We found no significant difference between the two groups in sex (p = 0.189), age (p = 0.225), or visual intelligence (p = 0.461; mean = 10.79, SD = 1.50, range [5,12]). Therefore, these were not added as covariates in the analysis.
We used an alpha value of 0.05 for all statistical tests, two-tailed, with 95%CI. All methods and analysis were performed following our previous studies using this paradigm (Suarez-Jimenez et al. 2018, 2021); see the papers for more details.

Responses