Utilization of lysed and dried bacterial biomass from the marine purple photosynthetic bacterium Rhodovulum sulfidophilum as a sustainable nitrogen fertilizer for plant production

Introduction
Agriculture currently faces a global, urgent need to sustainably improve crop productivity to ensure food security for a rapidly growing population while simultaneously mitigating its impact on the environment1. Between 2005 and 2050, it is projected that global food production must increase by 70% to adequately feed the world population2. Meeting this demand for increased plant productivity will be directly related to an increase in the use of nitrogen (N)-containing fertilizers, which is predicted to increase by 50% by 20503. N-containing fertilizers such as ammonium nitrate and urea are produced from ammonia that is synthesized using the Haber-Bosch process, which was developed over 100 years ago4. However, this process has alarming environmental impacts: it consumes 1% to 2% of the world’s total energy5 supply and contributes to about 1.8% of global CO2 emissions6, making it one of the largest industrial sources of CO2 emissions globally. This creates an urgent need for the development of sustainable, environmentally friendly alternatives to produce N fertilizers.
In 2021, agricultural food production systems contributed approximately 30% of the total global anthropogenic emissions of greenhouse gases (GHGs). This amounts to 16.2 metric gigatons (Gt) of carbon dioxide equivalents (CO2eq)7,8, mainly from agricultural land and from pre- and post-production processes7,8. On-farm emissions from crops and livestock activities contributed 7.79 Gt CO2eq, of which the majority, 53.9%, was due to emissions from livestock agriculture, with 34.1% from cropping systems. The N2O emission share of agrifood systems in total N2O emissions was the highest at 78.2%, while its CO2 and CH4 emission shares in total respective gas emissions were 20.7% and 51.0%, respectively8. Application of N-containing mineral fertilizers released 0.599 Gt CO2eq8,9 as N2O, and fertilizer manufacturing released 0.466 Gt CO2eq8 as CO2, CH4, and N2O. Thus, use of mineral fertilizers represents 1.06 Gt CO2eq (6.53%) of the total GHG emissions from agricultural food production.
Continuous or excessive use of mineral fertilizers causes excess N to run off into surface water and leach into groundwater, while depleting soil organic carbon (SOC)10. Some N not used by plants can also escape as N2O, accounting for 25.7% of total N2O emissions from agriculture (including livestock and cropping systems)8. Application of organic matter such as manure, compost, and fishmeal is a common practice both to replenish nutrients required by plants and to improve the soil structure11,12,13,14. The carbon-to-nitrogen (C:N) ratios of these organic fertilizers determine whether the N is released or immobilized in soil microbes15. Lower C:N ratios, ranging between 1 and 15, lead to rapid mineralization of N (conversion of organic N to ammonium) and N release for plant uptake16. Higher C:N ratios, above 35, promote microbial immobilization (plant usable N is taken up by microbes), and C:N ratios between 20 and 30 maintain an equilibrium state between mineralization and immobilization16. Unfortunately, commonly used organic fertilizers such as compost and manures have low N content, and must be applied in large quantities to provide amounts of N comparable to mineral fertilizers16. This leads to an increase in electrical conductivity (a measure of salinity) of the soil and could cause salt burns and nutrient toxicity17,18. Furthermore, organic fertilizers with C:N ratios greater than 10 improve SOC but lead to an increase in N2O emissions due to increased microbial nitrification and denitrification processes19. Thus, plant- and animal-based organic fertilizers cannot fully replace mineral fertilizers to mitigate the environmental impacts of mineral fertilizer production.
Recently, microbes have attracted attention as a slow-release fertilizer due to their high N content20. Purple non-sulfur bacteria (PNSB) are photomixotrophic bacteria that can obtain their carbon either from CO2 (autotrophy) or from organic carbon compounds (heterotrophy)21. Several species of PNSB also possess one or more nitrogenases, which catalyze N2 fixation, and thus are strong candidates for N2 recovery and recycling in agriculture22. PNSB also accumulate a diverse range of metabolites including carotenoids23,24, plant growth-promoting factors25,26, polyhydroxyalkanoates27,28,29,30,31, and vitamins24,25. Application of PNSB as plant-growth-promoting bacteria or inoculants has been shown to improve overall plant health and stress tolerance due to the presence of these compounds32,33,34,35,36. However, there is no clear evidence for plant uptake of the N in PNSB or corroboration of its ability to replace mineral fertilizers in the future.
Here, we use lysed and dried bacterial biomass (Processed Biomass or PB) produced from Rhodovulum sulfidophilum (ATCC 35886), a marine anoxygenic, gram-negative PNSB, as a microbial fertilizer, representing an emerging type of organic fertilizer made of dried microbial biomass37. Previously, we showed that these bacteria are suitable for the heterologous expression of spider silk38 and polyhydroxyalkanoate production under both photoautotrophic28,29,30,31,39 and heterotrophic40,41 culture conditions. In this study, we demonstrate the capacity of PB from R. sulfidophilum to replace mineral fertilizers as a microbial fertilizer and confirm the uptake of PNSB-derived N by plants.
Results
The lysed and dried bacterial biomass (Processed Biomass or PB) from R. sulfidophilum has high N content and a low C:N ratio
PB was prepared from 5-day cultures of R. sulfidophilum and mixed with the soil (Fig. 1). Elemental analyses of the PB from four independent batch cultures showed that the total N, total phosphate (P2O5), and total potassium (K2O) contents were 11.0 ± 0.1%, 2.95%, and 0.51% (w/w), respectively (Table 1). The pH was slightly acidic at 6.70, and the total carbon content (C) was 51.7 ± 0.5% (w/w) (Table 1), making the C:N ratio 4.7. The protein content in PB was estimated to be approximately 69% (w/w) based on the N-to-protein conversion factor of 6.25 reported elsewhere42. Next, we quantified the free (not bound in a protein) and total (proteinogenic + free) amino acid composition of PB. The free amino acids were primarily aspartate, glutamate, lysine, alanine, and leucine, and the total amino acids were primarily arginine, asparagine, aspartate, glutamate, glutamine, alanine, valine, glycine, and leucine (Table 2). The high N content and low C:N ratio of the PB makes it a promising candidate for use as a crop organic fertilizer.

PB is rich in organic N, which is mineralized to inorganic N (ammonia, nitrate) by soil microbes for plant uptake. Some organic N (peptides and amino acids) is also available for direct uptake by plants, as indicated by dotted arrows.
PB from R. sulfidophilum can be applied at four times the rate of mineral fertilizer without adverse effects on germination or growth
To further evaluate the suitability of PB as an alternative to mineral fertilizers, we tested the effects of different application rates on the germination and seedling growth of a green leafy vegetable, Japanese mustard spinach (komatsuna, Brassica rapa var. perviridis). After soil was mixed with 1, 2, 4, 8, 16, and 32 times the amount of PB corresponding to the N of mineral fertilizer control C1 (PB1, PB2, PB4, PB8, PB16, and PB32, respectively), the pH and the electrical conductivity (EC) of the soil were measured (Table S1). The EC of soil/fertilizer mixtures PB1, PB2, and PB4 was either lower than or similar to that of C1 (0.92), and the pH was comparable to that of soil fertilized with no-N fertilizer (no-N control, NC) (Table S1). Above the PB4 level, the EC increased considerably (1.30 to 2.60); with EC of PB8, PB16, and PB32 being up to twice as high as that of C1 and C2 (Table S1). The increase in EC was associated with negative effects on germination rates (Fig. 2a) and seedling growth (Fig. 2b) of komatsuna at 7 days after sowing (DAS), where increasingly severe growth defects were observed in the PB8, PB16, and PB32 treatments (Fig. 2b). Also, significantly lower germination rates (p < 0.0001) were observed for the PB32 treatment relative to the others (Fig. 2a). These results indicated that the PB1, PB2, and PB4 treatments represented suitable application rates, and thus these were used for the subsequent PB fertilization tests.
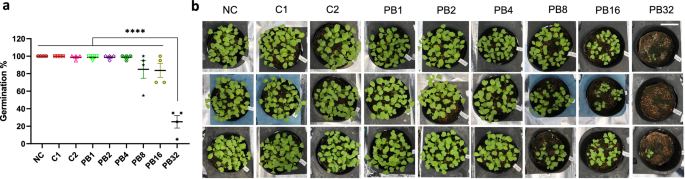
Plant treatments were either a no-N control (NC), mineral fertilizer controls (C1, C2), or PB treatments (PB1, PB2, PB4, PB8, PB16, and PB32, where 1, 2, 4, 8, 16, and 32 represent an added amount of fertilizer corresponding to the amount of N in C1). a Germination rates and, b appearance of plants from different treatments at 7 days after sowing (DAS). Asterisks indicate statistically significant differences with ****p < 0.0001 using a one-way ANOVA (Tukey’s HSD). Each data point is an average of values for 20 seeds in one pot, and error bars represent SEM (n = 4 pots). The white size bar at the top right is 5 cm.
PB from R. sulfidophilum can replace mineral fertilizers for the cultivation of komatsuna under two distinct temperature regimes
To test whether the N in PB could be taken up by plants, we evaluated the growth parameters and biomass of komatsuna fertilized with PB versus mineral fertilizer. Plants were cultivated for 35 days in soil supplemented with mineral fertilizer (C1 and C2), PB (PB1, PB2, PB4), no N (NC), or no fertilizer (NF) negative controls in two distinct temperature regimes, cool conditions (15–25 °C) and warm conditions (22–32 °C) (Figs. S1a, S1b, 3a, 3b). To account for the role of P and K on plant growth, given the lower P and K content of PB (Table 1), we also included P, K, and P + K supplementation of PB treatments PB1 (PB1P, PB1K, PB1PK) and PB2 (PB2P, PB2K, PB2PK), based on the corresponding P and K levels of C1 (Table S2).
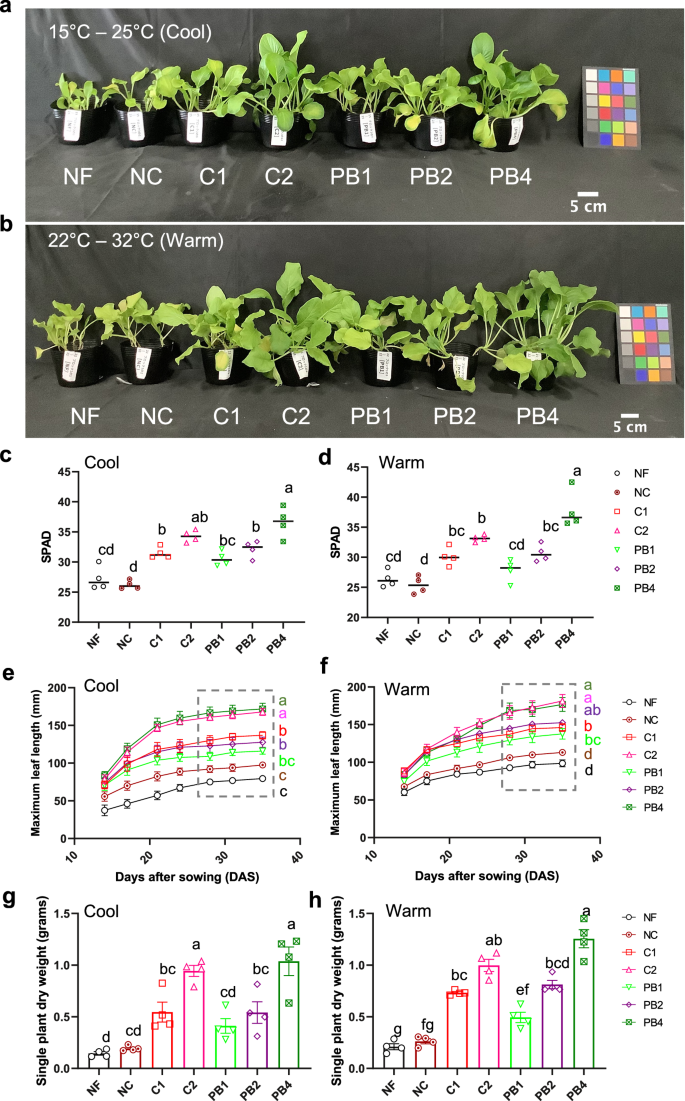
Plants were grown at either 15°C – 25°C (Cool, a, c, e, g) or 22–32 °C (Warm, b, d, f, h). Fertilizer treatments were: no fertilizer (NF), a no N control (NC), mineral fertilizer controls (C1 and C2), and PB treatments (PB1, PB2, and PB4), where 1, 2, and 4 represent an added amount of fertilizer corresponding to the amount of N in C1. The appearance of plants (a, b), SPAD values of leaves (c, d) measured at 28 days after sowing (DAS), maximum leaf length of plants (e, f) over time after sowing, and single-plant dry weight of plants (g, h) measured at 35 DAS. Different letters indicate statistically significant differences at p < 0.05 using a one-way ANOVA (Tukey’s HSD). In (e) and (f), statistically significant differences are shown for the period indicated by a dotted gray box. The colored squares in (a) and (b) are color checkers placed as true-color references. Each data point is an average of values for 5 plants in one pot, and error bars represent SEM (n = 4 pots).
No negative effects of PB fertilization on seed germination were observed under either cool or warm (Fig. S2c, S2b) conditions, as expected from the absence of impacts on soil pH and EC at the start of cultivation in all the treatments (Table S2). The ECs of the PB-only treatments were lower than that of the C1 treatment and ranged between the values for the NF and NC treatments (Table S2). Leaf chlorophyll content was determined using a Soil Plant Analysis Development (SPAD) meter as described in Materials and Methods. There were no differences in SPAD values among the PB, C1, and C2 treatments at 14 DAS and 21 DAS under both cool and warm (Fig. S2c, S2d) conditions. At 28 DAS, the SPAD values for the PB treatments showed an upward trend corresponding to the amount of PB added, with PB4 > PB2 > PB1 under both cool and warm (Fig. 3c, d) growth conditions. The SPAD values for PB1 and PB2 were comparable but tended to be lower than those of their corresponding mineral fertilizer treatments, C1 and C2, respectively (Fig. 3c, d). The SPAD value for the PB4 treatment was significantly higher than that for the PB1 (p = 0.0002, cool; p < 0.0001, warm) and PB2 treatments (p = 0.0252, cool; p < 0.0001, warm) under cool and warm conditions (Fig. 3c, d), and higher than the C2 treatment in warm conditions (p = 0.0297) (Fig. 3d). At sampling points after 28 DAS, the maximum leaf length of PB2 plants was comparable to that of C1 plants, and that of PB4 plants was comparable to that of C2 plants under both cool and warm (Fig. 3e, f) conditions. The single-plant fresh weight (FW) in PB4 was significantly higher than the FW in PB2 (p < 0.0001, cool; p < 0.0001, warm), which tended to be higher than that of PB1 in both cool and warm (Fig. S2e, S2f) conditions. Both the single-plant FW (Fig. S2e, S2f) and the single-plant dry weight (DW) (Fig. 3g, h) in PB2 were comparable to those in C1, whereas those in PB4 were comparable to those in C2 in both cool and warm conditions. The single-plant DW in PB4 was significantly higher than that in PB2 (p < 0.0001), which was significantly higher than that in PB1 (p = 0.0071) in warm conditions (Fig. 3h). In contrast, in cool conditions, single-plant DW in PB4 was significantly higher than that in PB2 (p = 0.0023), which was slightly higher than that in PB1 (Fig. 3g).
In an independent experiment that was conducted in spring cultivation conditions, the trends for most growth parameters among the PB, C1, and C2 treatments—namely plant appearance (Fig. S3a), SPAD values (Fig. S3b), maximum leaf length (Fig. S3c), and single-plant FW (Fig. S3d)—were consistent with the data obtained for these treatments in the cool growth conditions (Figs. 3a, c, e, g and S2e). However, the single-plant DW tended to be significantly different between C1 and PB2 (p = 0.003), and C2 and PB4 (p < 0.0001), with lower values for PB2 and PB4 (Fig. S3e). Instead, the single-plant DW in C1 was comparable with that of PB4 (Fig. S3e). In general, the plants grown under spring cultivation conditions (Fig. S3e) had lower dry weights than those grown under the cool conditions (Figs. 3g and 4o, q). Furthermore, the % increase in SOC during cultivation in PB1, PB2, and PB4 was comparable to C1 (Fig. S4). These results indicate that PB could be used instead of a mineral fertilizer to obtain similar plant growth under two distinct temperature regimes.
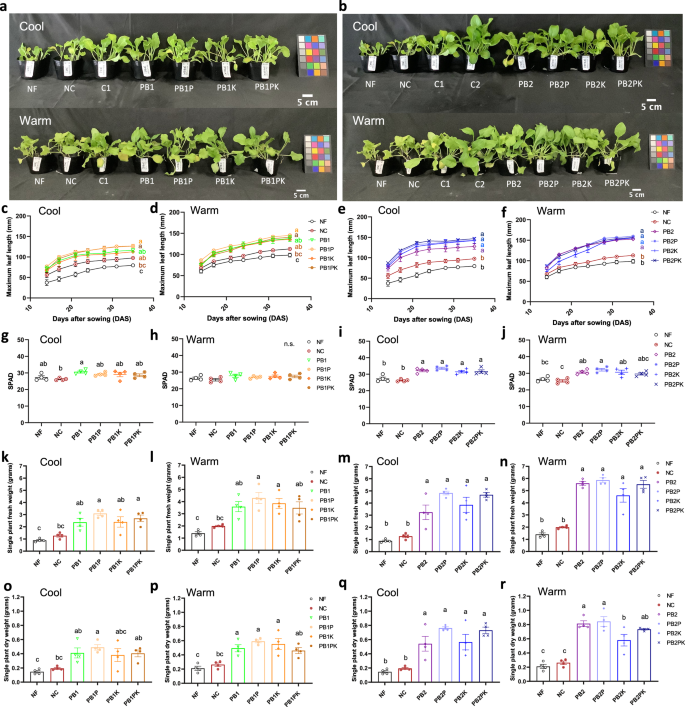
Plants were grown at either 15–25 °C (Cool) or 22–32 °C (Warm), as labeled in the figure. Fertilizer treatments were: no fertilizer (NF), a no-N control (NC), PB treatments (PB1, PB2), and P, K and P + K supplementation (PB1P, PB1K, PB1PK, PB2P, PB2K, PB2PK), where 1 and 2 represent an added amount of fertilizer corresponding to the amount of N in the mineral fertilizer control C1 (with C2 representing a control with twice this amount). Plant appearance at harvest (35 DAS) for PB1 (a) and PB2 (b) with and without P and K supplementation in cool (top) and warm (bottom) conditions. Maximum leaf length during cultivation (c, d, e, f), SPAD values at 35 DAS (g, h, i, j), single-plant fresh weights (k, l, m, n), and single-plant dry weights (o, p, q, r) at 35 DAS, in cool and warm conditions, as labeled. Different letters indicate statistically significant differences at p < 0.05 using a one-way ANOVA (Tukey’s HSD). n.s. indicates no significant differences between treatments. The colored squares in (a) and (b) are color checkers placed as true-color references. Each data point is an average of values for 5 plants in one pot, and error bars represent SEM (n = 4 pots).
P and K supplementation is not needed when using R. sulfidophilum PB in PK-abundant soils
The addition of P, K, and P + K to PB1 and PB2 treatments did not result in significant differences compared to PB alone (PB1 and PB2) under both cool and warm conditions in terms of plant appearance (Figs. 4a and 4b), maximum leaf length (Fig. 4c–f), SPAD values at 28 DAS (Fig. 4g–j), single-plant FW (Fig. 4k–n), and single-plant DW (Fig. 4o–r). Similarly, PK supplementation had no effect on SPAD values (Fig. S3b), maximum leaf length (Fig. S3c), FW (Fig. S3d) and DW (Fig. S3e) of plants in any of the treatments grown under spring cultivation conditions. This was because the soil used in this experiment contained sufficient levels of P and K for cultivation without any supplementation (Table S3). Thus, in PK-abundant soils, PB could be used as a stand-alone N fertilizer for adequate growth of plants.
Warm conditions increase single-plant DW independent of treatment type
For all treatments, the single-plant DW tended to be higher in the warm conditions compared to the cool conditions (Table 3). In particular, for C1 (p = 0.0457), PB2 (p = 0.0042), and PB4 (p = 0.0204), single-plant DW differed significantly between the two temperature conditions (Table 3). There were no obvious interaction effects between the temperature and treatments for single-plant DW, indicating that the higher DW observed in warm conditions was independent of treatment type (Table 3). Relative to C1, the increases in single-plant DW in PB1, PB2, and PB4 were –25%, –1%, and 90%, respectively, in cool conditions, and –33%, 11%, and 71%, respectively, in warm conditions (Table 3).
Komatsuna can take up the N in PB from R. sulfidophilum
The single-plant DW for NC and PB treatments (PB1, PB2, PB4, PB1P, PB1K, PB1PK, PB2P, PB2K, and PB2PK) showed a strong positive correlation with the amount of N input per pot, with Pearson correlation coefficients (r) of 0.985, 0.977, and 0.966 for three independent experiments, spring (p < 0.0001), cool (p < 0.0001), and warm (p < 0.0001), respectively (Fig. 5a). Additionally, the total plant N for NC and PB treatments (PB1, PB2, PB4, PB1PK, and PB2PK) positively correlated with the amount of N input per pot under both cool (p = 0.0045) and warm (p = 0.0006) conditions, with r values of 0.945 and 0.980, respectively (Fig. 5b). These results confirm that the plants were able to take up the N from PB.
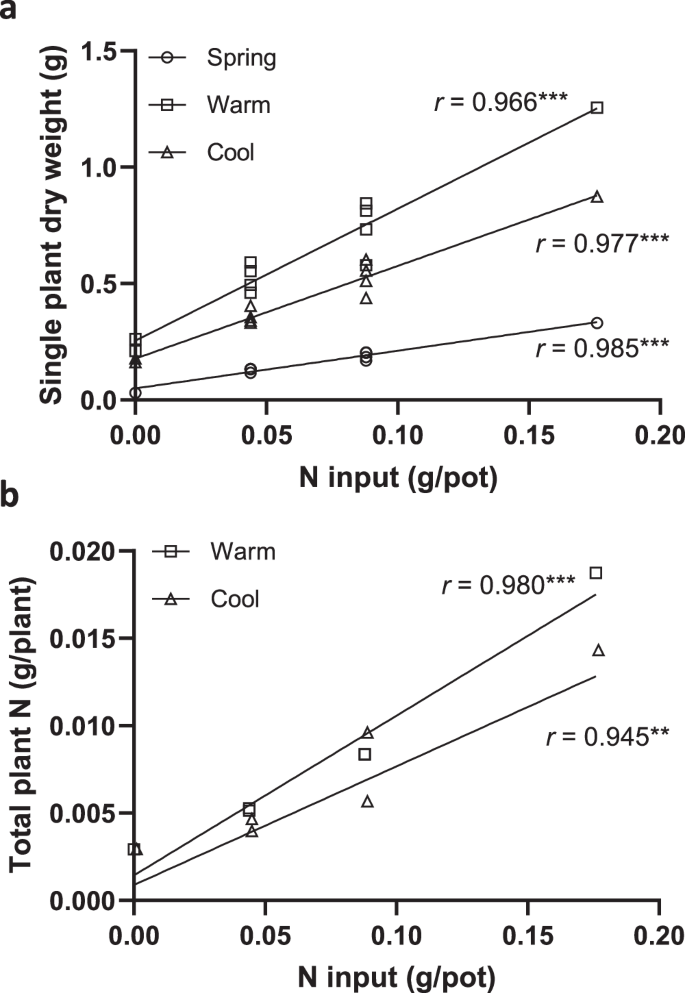
a Correlation of single-plant dry weight with N input per pot in three independent experiments in spring, cool, and warm growth conditions as described in Materials and Methods. Data are from NC, PB1, PB2, PB4, PB1P, PB1K, PB1PK, PB2P, PB2K, and PB2PK treatments (as described in Fig. 4). b Correlation of total plant N with N input per pot. Data are from NC, PB1, PB2, PB4, PB1PK, and PB2PK treatments in cool and warm growth conditions. Correlations are indicated by the Pearson correlation coefficients (r). Asterisks indicate statistically significant differences (**p < 0.01; ***p < 0.001).
Discussion
Our study demonstrated the effective use of lysed and dried bacterial biomass (Processed Biomass or PB) from the marine purple photosynthetic bacterium Rhodovulum sulfidophilum as a promising alternative source of N fertilizer for plant production. Although twice the amount of PB was required to obtain plant growth (Fig. 3a, b) and dry weight (Fig. 3g, h) comparable with those obtained with mineral fertilizer (i.e., PB2 = C1, PB4 = C2), use of PB would minimize the detrimental environmental effects of mineral fertilizers. These higher required amounts of PB correspond to its rate of mineralization of 62%, as estimated from the C:N ratio of PB (4.7, Table 1) using the regression data from a previous study43. The relatively low C:N ratio of PB would be expected to favor the mineralization of its N for uptake by plants16, albeit slower than N release from mineral N fertilizers such as ammonium or nitrate, which are immediately available for plant uptake. For slow-release applications, PB could be mixed with high organic C-containing plant wastes to adjust the C:N ratios and thus, the rate of N mineralization. We observed a tendency toward higher single-plant dry weight in warm conditions for all treatments. In addition, the higher PB treatments PB2 (p = 0.0042) and PB4 (p = 0.0204) showed significantly greater values in warm vs. cool conditions (Table 3). This observation could be attributed to differences in N-release or mineralization rates from PB under cool versus warm conditions, although this should be investigated further.
In addition to the C:N ratio, N mineralization in arable soils is also dependent on soil water potential44—a decrease in soil water potential was found to decrease the N available for plant uptake45. In the present study, the soil used for the spring experiment had a higher solute concentration compared to the soil used for the cool and warm growth conditions (Table S3), and the mode of irrigation was different between the two experiments. In the spring cultivation experiment, water was provided from the top, whereas in the cool conditions, water was provided from the bottom with the help of an absorbent wick inside each pot. These differences could have influenced the release of N available for plant uptake between the spring cultivation and the cool conditions, thus resulting in an overall reduction in plant dry weight in the spring cultivation season (Fig. S3e) compared to the cool conditions (Figs. 3g and 4o, q). Additionally, differences in light availability between February–March (spring conditions) and May–June (cool conditions) could have contributed to the differences in plant fresh weight (Fig. S2e and S3d).
Organic N in soil is generally thought to be consumed by soil microbes rather than plants46. However, the presence of various amino acid transporters47,48,49,50,51,52 and peptide transporters53,54,55 in plant roots suggests otherwise. Several studies have demonstrated transporter-mediated amino acid uptake by plant roots47,48,49,50,51,52. PB has a higher N content than Rhodobacter sp. (N:P:K = 8.5:2.4:0.5)21,37 or microalgae (N:P:K = 8.07:1.29:1.36)56, with ~69% (w/w) of the N in the form of protein (Table 2). Hence, in addition to providing a source of mineralizable N as expected, PB may also provide the plants with N as peptides and/or amino acids that are beneficial for plant growth and are available for direct uptake by plant roots (Fig. 1)53,57. Previous research has demonstrated the direct uptake of arginine58, aspartate51,59, glutamate50,51,60, lysine49, and alanine50,61 and the roles of these amino acids in plant growth and stress responses59,62,63,64,65. All of these amino acids are major components of the free and total amino acids in PB (Table 2). Thus, in addition to the use of purple non-sulfur bacteria as a source of N and a biostimulant21,33,34, they could also be applied as an amino acid supplement due to their moderately high protein content of ~69%.
Mineral fertilizers account for 6.53% of the total GHG emissions from agricultural food production systems, the largest share of which is released as N2O from the fertilized soils8. Mineral fertilizers contribute 25.7%, while manure applied to soils contributes 6.96% of total N2O emissions from agricultural food production systems8. Also, N2O emissions increase due to an increase in the SOC resulting from the use of organic fertilizers that have a C:N ratio greater than 10, such as animal manure19. Unlike other organic N fertilizers, PB treatments were comparable to the mineral fertilizer control (C1) and the no-N control (NC) treatments in terms of their effects on SOC (Fig. S4), suggesting that PB application does not cause drastic changes in SOC and possibly N2O emissions. This could be attributed to the fact that PB has a relatively high N content (~11%) compared to manure, and thus less PB is required to provide N levels comparable to those provided by mineral fertilizers. The lower amounts required for PB compared to traditional organic fertilizers such as manure and compost, may lead to a decrease in energy consumption for transportation and fertilizer application, consequently lowering the associated greenhouse gas emissions. Furthermore, when cultured autotrophically, R. sulfidophilum can fix CO2 and could in theory reduce the carbon footprint of fertilizer production and its contribution to global GHG emissions. However, a comprehensive life cycle assessment of PB as a fertilizer is required to evaluate its environmental footprint across production, storage, application, transport, and disposal, along with further characterization of PB-fertilized soils to assess its suitability and economic viability as a commercial replacement for mineral fertilizers.
In conclusion, although the concept of utilizing biomass fertilizers from N2 and CO2 fixing microbes shows potential, it also presents notable constraints. Despite its promising aspects discussed earlier, potential challenges with scaling up of culture, coupled with potential risks of contamination, and increased energy demands for storage, manufacturing, and transportation could substantially increase production costs, potentially impacting its economic feasibility compared to mineral fertilizers. Additionally, factors such as limited shelf life and variability in effectiveness due to environmental conditions must also be examined, as these could impede their widespread adoption. Thus, our study serves as an initial investigation into the use of lysed dry biomass from the marine purple non-sulfur photosynthetic bacterium, R. sulfidophilum as a nitrogen fertilizer, and lays the groundwork for further evaluation and assessment of the use of microbial biomass fertilizers from marine purple non-sulfur photosynthetic bacteria as viable substitutes for N-containing mineral fertilizers in the future.
Methods
Preparation of the lysed and dried bacterial biomass (Processed Biomass or PB) from R. sulfidophilum
Cultivation and harvest
The marine purple photosynthetic non-sulfur bacterium, Rhodovulum sulfidophilum (DSM 1374; W4, LMG 5202) (ATCC) was cultured in marine broth (Merck, Millipore Sigma, Massachusetts, United States) in 10-L Schott bottles at room temperature (26 °C) under a broad-spectrum halogen lamp (80 W m-2) with mixing (350 rpm). Cells from 5-day-old cultures were harvested by centrifugation (14,000 × g, 10 min), and resuspended in pure water to remove salt. Washed cells were then collected by centrifugation (14,000 × g, 30 min) and stored at –80 °C until further use.
Lysis and drying
The washed cells were resuspended in pure water (1 g FW:5 mL water). For cell lysis, the suspension was passed through a high-pressure homogenizer (PandaPLUS 2000, GEA, Düsseldorf, Germany) at 1000 bar, for a total of 7 cycles. Alternatively, cell lysis was achieved by ultrasonication at 19.2 kHz, 60% amplitude, 35 rpm (3 cycles) (Mitsui Electric UX600, Chiba, Japan). Complete cell lysis was confirmed by lack of growth following plating of lysates on marine agar and cultivation at 30 °C, 730 nm, and 20-30 W m-2. The cell lysates were dried by freeze-drying (model FDL-1000, EYELA Ltd.) to produce the PB used in fertilizer tests.
The PB was analyzed for N and C content by dry combustion. Phosphate (P2O5) and potassium oxide (K2O) were extracted by nitric acid decomposition and analyzed by absorptiometry and atomic absorption spectroscopy, respectively, at Vegetech Co., Ltd. Physical and Chemical Analysis Center, Kanagawa, Japan. Values are expressed as % of freeze-dried weight.
Amino acid analysis
For amino acid analysis, we used PB from R. sulfidophilum cultured in natural seawater supplemented with 0.1% yeast extract (Cat. No. A1202HA, Solabia Biokar Diagnostics) and 0.5% peptone (Cat. No. 24-0970, Sigma Aldrich) at 150 W/m2 (Y104-R660/W40/IR73-31W-EI0U1LW-010, YUMEX Solutions) and mixing at 400 rpm. Free (not bound in a protein) and total (proteinogenic + free) amino acids (except for cysteine) in the dry cell biomass were quantified with an amino acid analyzer (L-8900, Hitachi) using the post-column ninhydrin derivatization of amino acids at the Support Unit for Bio-Material Analysis, Research Resources Division, RIKEN Center for Brain Science. For the quantification of free amino acids, 5.3 mg of a lyophilized sample was sonicated in 206 μL of 0.2 M perchloric acid for 5 min and incubated at 0 °C for 30 min. After centrifugation at 12,000 × g, the supernatant was diluted 3.3-fold with lithium citrate buffer (pH 2.2) (123-02505, Fujifilm Wako Pure Chemical Corporation) and applied for the analysis. For the quantification of total amino acids (19 of the 20 proteinogenic amino acids, excluding cysteine), 1.2 mg of the lyophilized sample was hydrolyzed with 50 μL of 4 M methanesulfonic acid at 110 °C for 20 h. The volume of hydrolysate was adjusted to 100 μL with ultra-pure water and filtered through a 0.45 μm filter. The filtrate was diluted 20-fold with the lithium citrate buffer for analysis. Note that roughly 20% of the total content of tryptophan was destroyed during the acid hydrolysis procedure.
Soil fertilization treatments
Treatments included
No fertilizer—0xN, 0xP, 0xK (NF); a negative control for N—0xN, 1xP, 1xK (NC); a mineral fertilizer control 1—1xN, 1xP, 1xK (C1); a mineral fertilizer control 2—2xN, 2xP, 2xK (C2); PB—1xN (PB1), PB—2xN (PB2); PB—4xN (PB4); PB—1xN, 1xP (PB1P); PB—1xN, 1xK (PB1K); PB—1xN; 1xP, 1xK (PB1PK); PB—2xN, 1xP (PB2P); PB—2xN, 1xK (PB2K), and PB—2xN, 1xP, 1xK (PB2PK), where 1x is 0.08 g/L (Table S2). For the control plants, fast-acting chemical fertilizer (N:P:K = 8:8:8, Akagi Engei) was mixed in soil at the rate of 1 g/L (C1) or 2 g/L (C2). In the PB test blocks, PB was added so that the total N content was 1, 2, or 4 times that of the C1. For P and K supplementation treatments, lime superphosphate (17.5% soluble phosphoric acid, Akagi Horticulture) and potassium chloride (52.4% soluble potassium) (Nacalai Tesque) were used to adjust the P, K, or PK contents comparable to C1.
Plant material and cultivation
Topsoil to a depth of 20 cm from a cultivable field at the experimental farm of Kyoto University, Kizugawa, Japan (34°44’0″N 135°50’30″E) classified as lowland soil (Table S3) was air-dried in the shade and passed through a 2-mm sieve. Then, 2.5 L of sieved soil was placed in a plastic bag, to which 500 mL water and the corresponding amounts of PB and N, P, and K fertilizers (Tables S1 and S2) were added and mixed thoroughly. For plant growth, 550 g of this fertilized soil was placed into 12-cm diameter polypots. Seeds of Natsu Rakuten (Takii Seed Co., Kyoto) komatsuna (Brassica rapa var. perviridis) were sown into five shallow holes in each pot with 4 seeds/hole, which were then covered with vermiculite. Pots were watered from the top and after complete saturation of the soil, the pots were covered with damp newspaper for 48 h. Each treatment (C1, C2, NC, PB1, etc.) consisted of four blocks, wherein a single pot was considered a sub-block, and these pots were placed randomly in each block with 5 plants per pot/sub-block. Experiments were conducted under three conditions: spring cultivation, summer cultivation, and temperature-controlled cultivation, as mentioned below.
Spring cultivation
One set of multi-treatment blocks was placed in a plastic greenhouse (34°44’0″N 135°50’30″E) between February and March, 2022, under natural daylight and temperature, with the minimum temperature set to 15 °C. Tap water was added into each pot every day from the top with minimal disruption to the topsoil. Insecticide [Affirm emulsion, Syngenta, Basel, Switzerland (2000× dilution)] and fungicide [Benlate Hydrating Agent, Sumitomo Chemical Co., Ltd., Tokyo, Japan (4000× dilution)] were applied at 18 DAS.
Summer cultivation
One set of multi-treatment blocks was placed in a plastic greenhouse (34°44’0″N 135°50’30″E) between August and September, 2022, under natural daylight and temperature, with the minimum temperature set to 22 °C. Data from this cultivation method were used to evaluate the maximum rate of PB application (Fig. 2) that did not cause any defects in germination or early growth. Pots with an absorbent wick extending from the bottom of the soil were placed on a water furrow connected to a water supply source, hence enabling irrigation from the bottom. The water furrow was filled with water twice a day at 4 a.m. and 4 p.m., each watering lasting 15 min, and the excess water collected in the furrow was allowed to drain for 30–60 min each time.
Temperature-controlled cultivation
Two independent sets of multi-treatment blocks were placed in two different temperature-controlled greenhouses (34°44’0″N 135°50’30″E), referred to as cool and warm treatments hereafter. For the cool treatment, the daily temperatures ranged from 15 to 25 °C, and for the warm treatment, they ranged from 22 to 32 °C (Fig. S1). The temperature program was set based on the real-time temperature data obtained in the plastic greenhouses during the spring and summer months, as described above. The temperature-controlled experiments in the cool and warm conditions were conducted between May and June 2023. The irrigation system was the same as that of the summer cultivation. The water furrow was filled with water once a day at 8 a.m. and watering lasted for 15 min until four days after sowing. Thereafter, the water furrow was filled with water twice a day at 8 a.m. and 2 p.m., each watering lasting 20 min. Care was taken to avoid placing high-N treatment pots upstream of the water flow. Insecticide [Ortran hydrating agent, Sumitomo Chemical Co., Ltd., Tokyo, Japan (2000× dilution)] and fungicide [Benlate Hydrating Agent, Sumitomo Chemical Co., Ltd., Tokyo, Japan (2000× dilution)] were applied at 16 DAS.
Growth analysis
Germination rates were measured at 7 days after sowing (DAS). At 7 DAS, thinning of seedlings was performed such that each pot consisted of 5 plants with one plant per spot. Any other seedlings with weaker hypocotyls or unhealthy leaves were trimmed away carefully using scissors. The length of the largest leaf was measured at 14, 17, 21, 24, 28, 31, and 35 DAS and recorded as the maximum leaf length. A Soil Plant Analysis Development (SPAD) chlorophyll meter (SPAD 502 Plus, Konica Minolta, Tokyo, Japan) was used to estimate crop nitrogen status. SPAD values were measured for the largest leaf and recorded as an average of three values obtained at the top, middle, and lower positions of the leaf at 14, 21, 28, and 35 DAS. For leaves smaller than 49 mm in length, SPAD values were measured only at the center of the largest leaf. Fresh weights of the above-ground biomass were measured at 35 DAS; samples were then dried in a 60 °C oven for one week for to obtain dry weights.
Soil analysis
Soil (10 g) that was air-dried and passed through a 2 mm sieve was mixed with water in a 1:5 (v/v) ratio for 1 h at 160 rpm. The pH and EC of the suspension were measured using a direct soil pH tester (HI981030; Hanna Instruments, Inc., Woonsocket, USA) and a direct soil EC tester (HI98331; Hanna Instruments, Inc., Woonsocket, USA), respectively (Tables S1 and S2). Alternatively, pH and EC of the extracted supernatant were measured using a pH meter and EC meter (DKK-TOA Corporation, Tokyo, Japan) (Table S3). Exchangeable Ca and Mg were measured by absorption spectrophotometry and exchangeable K was measured by atomic absorption spectrophotometry, after shaking extraction of 2 g of air-dried, 2 mm sieved soil with 1 M ammonium acetate in 1:50 (w:v) ratio. Cation exchange capacity was measured spectrophotometrically after extraction of 2 g of air-dried, 2 mm sieved soil with 10% KCl in a 1:50 (w:v) ratio. Available phosphate was measured spectrophotometrically using a mixture of 1 g of air-dried, 2 mm sieved soil with 200 ml water by Truog’s method66. The ammonium N and nitrate N from the soil samples were evaluated by absorption spectrophotometry following shaking extraction of 5 g of air-dried, 2 mm sieved soil with 1 M KCl in a 1:10 ratio (w:v). Humic acid was measured from a mixture of 1 g of air-dried, 2 mm sieved soil with 10 ml of water by spectrophotometry using the Kumada method67. These soil analysis measurements were carried out by Vegetech Co., Ltd. Physical and Chemical Analysis Center, Kanagawa, Japan. The soil organic carbon was measured using ~0.5 g of soil before cultivation and 0.13 g to 0.19 g of soil after cultivation using the Walkley-Black method68.
Soil and plant nitrogen
Total N in soil was estimated by Kjeldahl’s method for evaluating N from organic substances (Vegetech Co., Ltd. Physical and Chemical Analysis Center). The ammonium N and nitrate N from the soil samples were evaluated by spectrophotometry following extraction using 1 M potassium chloride in a 1:10 ratio (w/v) (Vegetech Co., Ltd. Physical and Chemical Analysis Center). Dried plant samples were ground at 1000 rpm for 2 min (Yasui Kikai MB1200, Osaka, Japan), and 1 to 2 mg of these were subjected to oxidative combustion decomposition under a flow of helium (200 mL/min) + oxygen (20 mL/min) gas, and the amount of N was quantified as diatomic nitrogen (N2) (Microcorder MT-5, Yanaco co., ltd., Tokyo, Japan) and expressed as g/100 g plant dry weight. The values obtained were multiplied by the average dry weights of the plants in each treatment to obtain total plant N (g/plant).
Statistical analysis
The statistical significance of differences between treatments was determined using one-way analysis of variance (ANOVA) and Tukey’s post hoc analysis (GraphPad Prism 9, Graphpad Software, Boston, Massachusetts, USA). The interaction effects of temperature and treatment, and individual temperature and treatment effects on dry weights were evaluated by a two-way ANOVA (Fisher’s LSD), and the Pearson correlation coefficient was obtained for correlation studies using GraphPad Prism 9. P-values ≤ 0.05, ≤0.01, ≤0.001, and ≤0.0001 are indicated by *, **, *** and ****, respectively, and are considered significant. Statistical analyses were derived from the average values of four pots, each containing 5 plants (n = 4 pots) unless otherwise specified.

Responses