VDAC2 and Bak scarcity in liver mitochondria enables targeting hepatocarcinoma while sparing hepatocytes
Introduction
Voltage dependent anion channels (VDACs) are the most abundant proteins in the outer mitochondrial membrane (OMM). VDACs form beta barrel pores that permit the transport of ions and metabolites between mitochondria and other cellular compartments1,2. VDAC has three isoforms with highly conserved structure and transport activities but also isoform-specific functions providing unique protein scaffolds and supporting distinct pathways3,4,5,6. VDAC2, in particular, has emerged with several isoform-specific functions, including regulation of the pro-apoptotic Bak/Bax proteins, mitochondrial calcium signaling, and autophagy7,8. An established function of VDAC2 is to target Bak protein to the OMM, thereby stabilizing it and increasing its abundance9,10. Two neighboring amino acids of VDAC2, T168 and D170, are necessary for this function11. Bak is only stable as a membrane protein, whereas Bax, another pro-apoptotic Bcl-2 family member, is mainly in the cytosol12. However Bax’s targeting to the OMM is also facilitated by VDAC213 through the same domain that is relevant for Bak recruitment14.
Activation and oligomerization of Bak and Bax, leads to OMM perforation, an irreversible step which allows the release of proteins, including cytochrome c (cyto c), from the intermembrane space to the cytoplasm where they induce execution of the cells15. By regulating Bak/Bax protein targeting and function, VDAC2 is an important element in OMM permeabilization and ensuing cell death. VDAC2 has been reported to exert either pro- or anti-apoptotic effects in different tissues and cell types9,16,17. The effects of Bak and Bax are modified by interaction with other pro- or anti-apoptotic members of the Bcl-2 family. Pro-apoptotic Bcl-2 Homology (BH)3-only proteins, Bid and Bim activate Bak and/or Bax while anti-apoptotic members with four BH domains—Bcl-2, Bcl-xL, Bcl-w, and Mcl-1—restrain this process18. A major cell death pathway involving these components is triggered when TNF-family proteins like TNF-related apoptosis-inducing ligand (TRAIL) bind to death receptors on the cell surface, activating Caspase 8 which cleaves Bid. Truncated Bid (tBid) potently executes cell death in susceptible cells by moving to the OMM, where it directly activates Bak/Bax and/or antagonizes the anti-apoptotic proteins that restrain Bak/Bax oligomerization15,19,20,21.
Transient and enduring interactions among anti- and pro-apoptotic proteins can determine cancer cell survival and has been exploited to develop targeted cancer therapy22,23. BH3-mimetic molecules have been designed to antagonize anti-apoptotic Bcl-2 family members by competing with their binding to pro-apoptotic proteins’ BH3 domains. This binding is mediated by a hydrophobic pocket involving the BH1, 2 and 3 domains of pro-survival proteins that has proved a tractable target for drug designers24,25,26,27. Venetoclax (ABT-199), a specific Bcl-2 inhibitor, has been approved by the U.S. Food and Drug Administration and other regulatory agencies for certain blood cancers, and several other BH3-mimetics, including, Navitoclax (ABT-263, the oral version of ABT-737), AZD5991, AMG 397, and S63845/S64315 have progressed to clinical trials for a variety of cancers28,29.
Hepatocellular carcinoma (HCC), the main cancer of liver and third leading cause of cancer mortality, is increasing in incidence and has a poor chance of cure, especially at advanced stages, requiring new therapeutic tools30. We show here that, unexpectedly, HCC cells are orders-of-magnitude more sensitive to tBid-induced OMM permeabilization than normal hepatocytes. Among different tissues, the lowest VDAC2 protein expression was reported in liver and lung31 and we show that the paucity of VDAC2 in liver results in suppression of the Bid-Bak apoptosis pathway9. At the same time, we find high VDAC2 and Bak protein expression in HCC, and that specifically these factors are central to high tBid sensitivity. Given HCC’s sensitivity to tBid and elevated VDAC2 expression, we explore whether the upregulation of VDAC2 sensitizes liver tumors to Bid-Bak and creates an Achilles’ heel for selective targeting of hepatocarcinoma cells.
Results
Hepatocarcinoma cells are vastly more sensitive to tBid-induced OMM permeabilization and cyto c release than hepatocytes
In previous studies of liver mitochondria, 30-60 min incubation with tBid was required for complete cyto c release32,33,34,35,36,37. However, in reports of several cancer cell lines, including HepG2, cyto c discharge was found within minutes of tBid addition38,39,40. To directly test whether the mitochondria of normal hepatocytes and cancer cells are differently sensitive to tBid-induced OMM permeabilization, we performed single cell fluorescence imaging measurements of mitochondrial membrane potential (ΔΨm) in HepG2 cells, hepatocytes from 8 week old male Sprague-Dawley rats, and primary human hepatocytes. The cells were skinned by 20-40 μg/ml digitonin, which selectively permeabilizes the plasma membrane, and incubated in the presence of protease inhibitors to avoid proteolysis, with succinate and ATP to energize mitochondria and maintain the physiological suppression of the mitochondrial permeability transition, respectively. In the presence of oligomycin, cyto c release results in concurrent depolarization40. Addition of 25 nM recombinant tBid caused rapid and complete loss of ΔΨm in HepG2 cells. The depolarization started within 2 min of tBid addition and reached completion in 7 min. By contrast, primary human and rat hepatocytes did not show any depolarization for 10 min (Fig. 1A).

A Representative time-lapse imaging of TMRE-loaded permeabilized HepG2 and primary rat and human hepatocytes before and 600 s after treatment with truncated Bid (tBid) (25 nM) (Upper panels). Plots (lower panels) show the mean TMRE fluorescence of the cell population in the imaging field. Chemical uncoupler, FCCP (5 µM), was added at the end of each run to fully depolarize the mitochondria. Experiments were repeated three times with similar results. B Representative immunoblots of permeabilized cell suspensions of equal cellular protein aliquots were treated with 25 nM tBid or with 600 μg/ml digitonin for 10 min. Cyto c release from the mitochondria assayed by rapidly separating membrane and cytosolic fractions (upper and lower panels, respectively). Experiments were repeated three times with similar results. C Representative time lapse recordings of ΔΨm in permeabilized cell suspensions by TMRE dequenching. HepG2 and PLC cells and primary human hepatocytes were treated with tBid at the indicated concentrations. Digitonin (600 μg/ml) was added to human hepatocytes as a positive control. Experiments were repeated three times with similar results. D Representative ΔΨm traces of isolated HepG2 mitochondria treated with varying concentrations of tBid measured by Rhod123 quenching (upper panel). Western blot shows the release of cyto c in the supernatant fraction following treatment (lower panel). Experiments were repeated three times with similar results. E Representative ΔΨm traces of isolated mitochondria from rat and mouse liver treated with tBid (25 nM) or oligomeric Bax (150 nM) and western blots of released cyto c from the same experiments. Experiments were repeated three times with similar results. Source data are provided in the Source Data file.
At 10 min treatment, the membrane and cytosolic fractions of cell suspensions treated with tBid or digitonin (to release all cyto c) were separated and immunoblotted for cyto c. Release of cyto c from mitochondria to the cytosol occurred only in liver cancer cells—HepG2, PLC/PRF/5 (PLC), Hep3B and Huh7—but not in human or rat hepatocytes (Fig. 1B, Figure S1B). Every liver cancer cell line responded to tBid in a dose-dependent manner with even 1 nM sufficient for complete depolarization in <10 min, while human hepatocytes were completely resistant to even 100 nM tBid in a fluorometric ΔΨm time-course assay (Fig. 1C, Figure S1A). Thus, liver cancer cell lines appear greatly sensitized to tBid compared to normal hepatocytes.
To test whether the differential tBid sensitivity was intrinsic to the mitochondria or resulted from the use of skinned cells, we isolated mitochondria from HepG2 cells and the livers of 8-12 week old male Sprague-Dawley rats and Rbfl/fl mice. Addition of tBid caused rapid depolarization and cyto c release in HepG2 mitochondria, which went to completion within 5 min when maximal tBid (50 nM) was added and cyto c release was detectable even at 1 nM tBid (Fig. 1D). By contrast, rat and mouse liver mitochondria were unaffected by tBid (25 nM) after 10 min of treatment. Notably, the liver mitochondria responded to addition of recombinant oligomeric Bax (150 nM) with cyto c release and a gradual loss of ΔΨm (Fig. 1E), indicating resistance specifically to tBid-induced OMM permeabilization.
Enhanced tBid sensitivity of hepatocarcinoma cells does not result from the cell growth environment or from different tBid binding
To find the source of the enhanced tBid sensitivity in hepatocarcinoma cells, we first tested whether the difference in OMM permeabilization was the result of differences between in vitro and in vivo cell culture conditions. HepG2 cells were exposed to an in vivo environment in a tumor xenograft model by subcutaneously injecting HepG2-X cells in 8 week old SCID-NOD mice41. The tumor and the liver were harvested from the same animal and mitochondria were isolated from each. Mitochondria derived from the tumor showed rapid loss of ΔΨm and cyto c release upon tBid addition even at low concentrations of tBid (0.5 nM and 2 nM), while liver mitochondria from the same animal were resistant to even 100 nM tBid for at least 7 min (Figure S1C). We also performed the inverse experiment: rat hepatocytes cultured in vitro for one week were similarly resistant to tBid as freshly isolated hepatocytes (Figure S1D). Thus, the differential tBid sensitivity of normal liver and tumor mitochondria cannot be attributed to environmental factors.
As a next step, we aimed to test the association of tBid with the OMM. Binding of tBid to OMM lipids and proteins is required to induce the OMM permeabilization42,43. tBid binding was similarly apparent in HepG2 cells and normal human and rat hepatocytes (Figure S1E). Therefore, differential association of tBid to the OMM is unlikely to explain the difference in OMM permeabilization.
Liver cancer cells express more VDAC2 than hepatocytes and are sensitive to tBid
The primary downstream effector of tBid-induced OMM permeabilization is Bak44, the recruitment of which to the OMM depends on VDAC29,10,11. Levels of VDAC2 and Bak were substantially higher in HepG2 cells than in primary human and rat hepatocytes, while VDAC1 levels were similar (Fig. 2A). Immunoblot analysis of isolated mitochondria from normal liver and xenograft HepG2 tumors (as described above) confirmed the relatively high abundance of VDAC2 and Bak in tumors (Fig. 2B). Immunoblots of VDAC2 in three other liver tumor cell lines also showed elevations of VDAC2 between two- and three-fold compared to human hepatocytes after normalization by the mitochondrial marker, mtHSP70 (Fig. 2C). Furthermore, data from the quantitative proteomic analysis of the Cancer Cell Line Encyclopedia45 showed that other liver cancer cell lines have comparable VDAC2 and Bak levels to the ones we assayed (Fig. 2D).

A Immunoblots of VDAC1, VDAC2 and Bak in the membrane fractions of permeabilized HepG2 and primary rat and human hepatocytes. Prohibitin, an inner mitochondrial membrane protein is used as control of mitochondrial content. Experiments were repeated three times with similar results. B VDAC2 and Bak immunoblots of mitochondria isolated from livers and subcutaneous HepG2 tumor xenografts from the same mouse; Tom40 as loading control; VDAC2 blot is cropped between the 25 and 37 kDa molecular weight markers. Experiments were performed in 5 mice total with similar results. C Immunoblots of VDAC2 in pellets of permeabilized human hepatocytes, HepG2, Huh7, Huh1, and PLC cells; mtHSP70 as loading control. Relative normalized VDAC2 levels are indicated above. Representative images; the experiment was repeated 3 times with similar results. D Heatmap of protein abundances in liver cancer cell lines from quantitative proteomics of the Cancer Cell Line Encyclopedia45. Data was extracted via the depmap.org interface. E Images of livers from diethylnitrosamine (DEN)-treated and control mice. F Representative time course ΔΨm measurements of mitochondria isolated from DEN-induced liver tumors and control livers treated with 37 nM tBid. G Immunoblot of cyto c in rapidly separated supernatants (tc: time control). H Immunoblots of VDAC2 and Bak in mitochondria isolated from DEN-induced tumors (left) and Aflatoxin-induced tumors (right) with corresponding control livers; Tim23 as loading control; VDAC2 blots are cropped between the 25 and 37 kDa molecular weight markers. DEN and Aflatoxin experiments (E-H) were performed with two pairs of animals each. Source data are provided in the Source Data file.
To test the hypothesis that VDAC2 expression is increased during hepatic carcinogenesis and might be the cause of increased tBid sensitivity in liver tumor cells, we used diethylnitrosamine (DEN), a chemical carcinogen, to generate liver tumors in Rbfl/fl mice by injecting the mice at 2 weeks old46. Mitochondria were isolated from the liver tumors and from the liver of paired, untreated mice at 9 months (Fig. 2E). Only mitochondria isolated from the tumor showed rapid loss of ΔΨm and cyto c release upon tBid addition (Fig. 2F). A low concentration (3.7 nM) of tBid was enough to rapidly release cyto c from tumor mitochondria, whereas mitochondria from normal tissue showed no rapid release of cyto c from maximal doses of tBid (Fig. 2G). Western blotting revealed that the levels of VDAC2 and Bak were much higher in tumor mitochondrial samples compared to their paired control liver mitochondria (Fig. 2H). Similar results were observed for VDAC2 and Bak levels in tumor mitochondria where liver tumors were generated by a different carcinogen, Aflatoxin (Fig. 2H). All these results support a role for increased VDAC2 expression in the recruitment of Bak and enhanced tBid-induced OMM permeabilization in liver tumors compared to normal tissue.
VDAC2 and Bak are frequently upregulated in human liver tumors
To explore the relevance of VDAC2 and Bak expression in human pathology, we investigated their expression in samples of human tissue and in publicly available transcriptomic and proteomic databases. First, we examined their levels in normal human tissues using a published quantitative proteomic comparison47. Plotting VDAC2 and Bak in each tissue, after normalizing for the estimated mitochondrial content of each tissue (see “Methods” for estimation procedure), showed the liver as a clear outlier with markedly low expression of Bak and, especially, VDAC2 (Fig. 3A). Comparison of VDAC2 to VDAC1 in the same data confirmed the comparative scarcity of VDAC2 in the liver (Fig. 3B). Next, we performed western blot on six pairs of lysates of resected human HCC and non-tumorous adjacent tissue. The ratios of VDAC2 and Bak to prohibitin, a mitochondrial marker protein, were increased in five of six tumor samples compared to their corresponding normal liver (Fig. 3C) and, notably, the changes in VDAC2 and Bak were strongly correlated (Pearson correlation: 0.87, p = 0.025).

A Relative VDAC2 and Bak1 protein levels in 31 normal human tissues by quantitative mass spectrometry47, normalized by the estimated mitochondrial content of each tissue. Values for brain samples from cerebellum and cortex and heart samples from atrium and ventricle are indicated. B Relative VDAC1 and VDAC2 protein levels in human tissues, normalized by the estimated mitochondrial content as in (A). C Immunoblots (left) of VDAC2 and Bak in paired HCC and normal tissue samples resected from patients (see Supplementary Table 1); prohibitin as mitochondrial loading control. Quantification of changes in VDAC2:prohibitin and Bak:prohibitin, normalized by the average log2 ratio of the normal samples. Statistical significance from two-sided paired t-test is indicated. SDS-PAGE and immunoblot was performed twice with similar results. D vdac2 and bak gene expression fold increases and percentage ranks in normal versus cancer comparisons across five mRNA databases available from Oncomine as of 2018. At right, heatmap for rank of each gene; hsp9a (mitochondrial HSP70) was used as a mitochondrial gene control. Gray indicates that the transcript was not measured in the Chen study. p values from Wilcoxon Rank Sum test. E Differences in vdac2 and bak mRNA in 214 HCC patients from the Roessler Liver 2 dataset48, calculated by subtracting the log2 values (normalized using the Robust Multi-Array Average method and global median centering) in tumor from the value in the liver sample taken from the same patient. Percentages represent the fraction of patients in that quadrant. F Differences in VDAC2 and Bak protein levels (after normalization for mitochondrial content) in 159 paired tumor and liver samples from49. Source data are provided in the Source Data file.
We further explored VDAC2 and Bak expression in HCC databases, particularly in those that also included samples of normal liver tissue. We extracted vdac2-bak1 expression levels in five such mRNA databanks from the Oncomine platform (oncomine.org, ThermoFisher Scientific). vdac2 showed significant upregulation in HCC compared to normal liver in all five datasets, while bak1 was increased in four out of five. The overall changes in vdac2 and bak expression are summarized in Fig. 3D. The gene ranks are illustrated in the heatmap in right panel with hspa9 (mitochondrial Hsp70) included as a reference. We further examined the individual patients’ gene expression data from one of these datasets, Roessler Liver 2, which consists of Chinese patients, largely males (86%), 95.6% of whom had a history of Hepatitis B virus (HBV) infection (GEO accession #GSE14520)48. Using gene expression data for paired tumor and normal liver samples from 214 individuals, the greatest fraction of these patients (59%) had increased expression of both vdac2 and bak in tumor samples (Fig. 3E). Performing similar analysis of VDAC2 and Bak protein levels from a proteomic analysis of HBV-related HCC and paired normal liver tissue in a mostly male (81%) Chinese population49 yielded very similar results (Fig. 3F). After normalizing for estimated differences in mitochondrial content which generally declines in tumor relative to liver (Figure S2C, see “Methods” for estimation procedure), we found that 94% of tumors in the dataset have increased VDAC2 and that VDAC2 and Bak changes are strongly positively correlated (Pearson correlation: 0.331, p = 0.00002). VDAC1 is also upregulated in HCC relative to liver at both the mRNA (Figure S2A) and protein (Figure S2B) levels. However, unlike VDAC2, VDAC1 levels in human liver are within the range of other tissues (Fig. 3A) and, notably, the changes in VDAC1 protein are not strongly correlated with Bak (Figure S2B, Pearson correlation: 0.095, p = 0.233).
To investigate the relationship between VDAC2 and Bak gene expression and common risk factors for HCC30, we used a subset of the Cancer Genome Atlas (TCGA) HCC cohort (LIHC) for which RNA-seq and detailed clinical data was available, including HBV and HCV status, alcoholic liver disease (ALD), race, gender and age50. We obtained tumor mRNA-Seq data through the cBioPortal interface51 for 191 patients, with significant representation of females (34%) and different races (60% Caucasian, 28% Asian, 7% African American), of whom 23% were HBV + , 18% HCV + , and 33% with ALD. Using one- and two-way ANOVA tests, we found no significant relationship between HBV, HCV, or alcoholic liver disease status and VDAC1 or VDAC2 expression or the VDAC2:VDAC1 ratio. Bak expression was significantly higher in HBV+ patient samples, but not after controlling for race (HBV+ cases in the dataset are disproportionately among Asians). We also evaluated whether changes in VDAC2 and Bak differ among the three subgroups that Gao et al. identified from their proteomics49. Mitochondrial content varies across the three subtypes (Figure S2D), with the least mitochondrial protein in the ‘proliferative’ type (S-Pf) that has the worst prognosis. (See Supplementary Data 1 for details of statistical testing for all figures.) After normalizing for mitochondrial content, VDAC2 is elevated similarly across the three groups while Bak levels in tumors are more increased in S-Pf and S-Me than the most benign group, S-Mb (Figure S2E), indicating unidentified mechanisms controlling Bak expression in HCC beyond simply the presence of VDAC2.
Finally, we evaluated vdac2, bak and vdac1 mRNA levels across cancer types using mRNA-Seq data from TCGA (Figure S2F). We compared expression levels in primary tumor and normal tissue in 12 cohorts that had mRNA data for at least 30 normal tissue samples. In the full LIHC cohort, which is more racially diverse (49% White, 43% Asian, 5% Black) and has a greater representation of female patients (32%), we again found low expression of vdac2 and bak in normal liver which is significantly increased in tumors. Three other cancer types—notably lung squamous cell carcinoma—also show the same pattern (Figure S2G), and, in fact, bak is increased in all four tumor types where vdac2 is significantly increased. Altogether, these data show that increases in both VDAC2 and Bak are prevalent in human HCC.
VDAC2 overexpression is sufficient to sensitize normal hepatocytes to tBid
To test directly if VDAC2 was the missing factor for high sensitivity to tBid in hepatocytes, a genetic overexpression strategy was used. VDAC2 was expressed in primary rat hepatocytes (Sprague-Dawley males, 8-12 weeks old) using an adenoviral vector (Ad-VDAC2). Adenoviral GFP expression (Ad-GFP) was used as a control. The Ad-VDAC2 hepatocytes became sensitized to tBid-induced mitochondrial depolarization and cyto c release, whereas the control, Ad-GFP cells remained unresponsive (Fig. 4A, C). Unlike tBid, recombinant Bax caused similar mitochondrial depolarization and cyto c release in Ad-VDAC2 and Ad-GFP hepatocytes (Fig. 4B, C). Western blot analysis of the membrane fractions confirmed VDAC2 overexpression and mitochondrial targeting of Bak (Fig. 4D). At the same time, VDAC2 overexpression had no effect on total Bax levels (Fig. 4E). These results confirm the dependence of tBid-induced OMM permeabilization on mitochondrial VDAC2 levels and demonstrate that the presence of VDAC2 is sufficient for Bak recruitment to the OMM in hepatocytes.
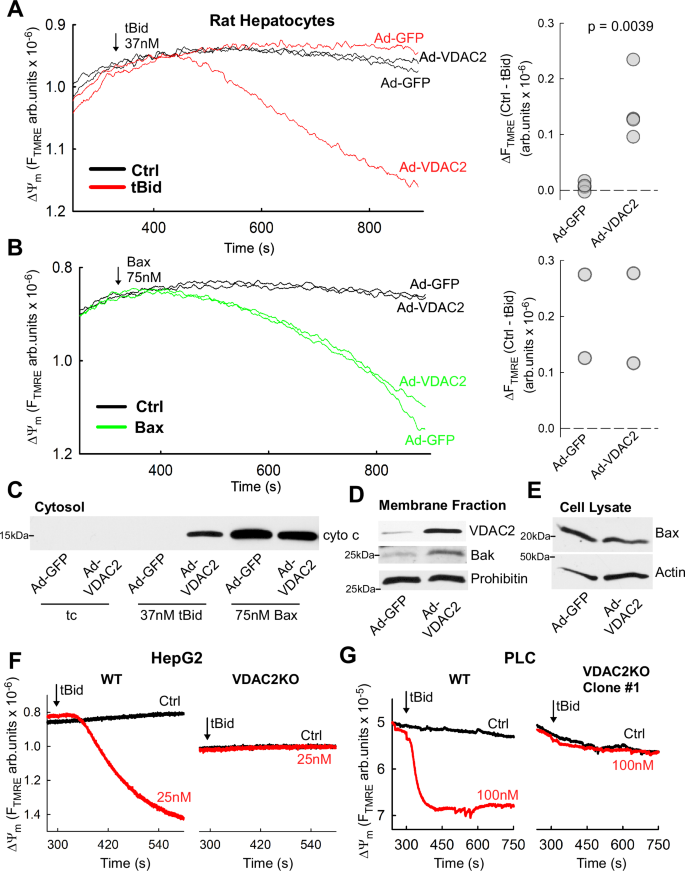
A Representative time course measurements of ΔΨm in tBid-treated, permeabilized rat hepatocytes infected with adenovirus encoding VDAC2 or GFP (left) and dot plot showing the changes in TMRE fluorescence during the treatment period (n = 4 experiments with 1 or 2 technical replicates per experiment; p = 0.0039, two-tailed t-test). B As in (A) but treatment with 75 nM Bax instead of tBid; n = 2 experiments. C Immunoblot of cyto c in the supernatant fraction from ΔΨm measurements in (A) and (B). D Representative immunoblots of VDAC2 and Bak in membrane fractions and (E) Bax in whole cell lysates of rat hepatocytes infected with Ad-VDAC2 and Ad-GFP. Prohibitin and Actin used as loading controls. VDAC2 blot is cropped between the 25 and 37 kDa molecular weight markers. Experiments were repeated 4 times with similar results. F Representative time course measurements of ΔΨm in permeabilized tBid-treated WT and VDAC2 knockout HepG2 cells. The experiment was repeated twice with similar results G Time course measurements of ΔΨm in permeabilized tBid-treated WT and VDAC2 knockout PLC/PRF/5 cells. The experiment was repeated 4 times with similar results. Source data are provided in the Source Data file.
Loss of VDAC2 eliminates tBid sensitivity in hepatocellular carcinoma cells
To test the inverse hypothesis—that loss of VDAC2 would eliminate the tBid-sensitivity of HCC cell lines—we used hepatocarcinoma cells in which VDAC2 was knocked out by CRIPSR-Cas9 gene editing (VDAC2KO). We obtained a clonal VDAC2KO HepG2 line from a commercial service (Figure S3A). Treatment of permeabilized cells with 25 nM tBid did not result in any loss of ∆Ψm or cyto c release in VDAC2KO cells (Figs. 4F & Figure S3B). We confirmed the lack of VDAC2 in the VDAC2KO cells by western blot and found a near total absence of Bak as well (Figure S3C). We also isolated two VDAC2KO clones from PLC cells targeted by different guide RNAs. We confirmed the presence of frameshift causing insertion in vdac2 in Clone#1 (Figure S3D) and loss of VDAC2 protein in both clones by western blot (Figure S3E). As in HepG2, we also found concomitant, near total loss of Bak (Figure S3E). When exposed to tBid (100 nM), there was no reduction of ∆Ψm or cyto c release in the VDAC2KO cells (Figs. 4G & Figure S3FG). Wild-type (WT) HepG2 and PLC cells were sensitive to tBid at 1 nM (Fig. 1C), demonstrating that the presence of VDAC2 is essential for tBid-induced cyto c release.
Bak is essential for the VDAC2-dependent tBid sensitivity in hepatocytes
The above results implied that the rapid effect of tBid in liver tumors depends on Bak rather than Bax. To validate the role of Bak downstream of VDAC2 in tBid-induced OMM permeabilization, we used hepatocytes of 8 week old male Bak-/- mice. We reasoned that overexpression of VDAC2 might fail to sensitize hepatocytes to tBid if no Bak is available for mitochondrial targeting. We first studied the effect of tBid in suspensions of permeabilized WT and Bak-/- hepatocytes in which we expressed VDAC2 or GFP (control) by adenovirus. Addition of 3.7 nM tBid caused dissipation of ΔΨm and cyto c release from mitochondria in Ad-VDAC2 hepatocytes of WT mice (Fig. 5A), whereas tBid had no effect on mitochondria from Ad-VDAC2 Bak-/- hepatocytes (Fig. 5B). Immunoblot analysis of membrane fractions confirmed VDAC2 overexpression in WT and Bak-/- hepatocytes and increased Bak levels in only WT hepatocytes (Fig. 5C).

A Representative time course measurements of ΔΨm in permeabilized mouse hepatocytes infected with adenovirus encoding VDAC2 or GFP and treated with 3.7 nM tBid (left) and dot plot showing the changes in TMRE fluorescence during the treatment period (n = 3 experiments with 1 or 2 technical replicates per condition; p = 0.049, two-tailed t-test). Left inset shows the cyto c release by western blot of the cytosolic fraction. B As in (A) but using hepatocytes of a Bak-/- mouse. High digitonin (600 µg/ml) was used as a reference for cyto c release in the western blot. Dot plot: n = 2 experiments with 1 or 2 technical replicates per condition. C Representative immunoblots of VDAC2 and Bak in the membrane fractions of permeabilized WT and Bak-/- hepatocytes from (A) and (B); Tim23 as loading control; VDAC2 blots are cropped between the 25 and 37 kDa molecular weight markers D Representative time-course ΔΨm measurements in control and Bak shRNA treated HepG2 cells treated with 0.5 nM tBid after removal of the cytosol. Traces are normalized between the initial and fully depolarized (FCCP) values. E Immunoblots of cyto c in the supernatant of the permeabilized control and Bak shRNA treated cells; * indicates an empty lane. (D–E) The experiments were repeated 4 times with similar results. Source data are provided in the Source Data file.
However, we observed that with a higher dose of tBid (37 nM) some depolarization and cyto c release was elicited in Ad-VDAC2 Bak-/- hepatocytes (Figure S4A). We suspected that Bax was the source of a Bak-independent effect in these cells. Bax was elevated in GFP-expressing WT cells compared with Bak-/-, but Ad-VDAC2 expression increased Bax in both genotypes (Figure S4B). We reasoned that washing out the cytosolic Bax might reduce the tBid sensitivity. Indeed, replacement of the cytosol effectively removed all Bax and subsequent addition of 37 nM tBid had almost no effect on ΔΨm and cyto c release in Ad-VDAC2 Bak-/- hepatocytes (Figure S4C, D).
To further confirm the role of Bak in tBid-induced OMM permeabilization, we reduced Bak levels in HepG2 cells using shRNA (Bak KD). The knock-down was effective at reducing Bak by ~50% (Figure S4E). Again, the cytosol-washout procedure was employed to exclude any effects of Bax. Addition of 0.5 nM tBid caused mitochondrial depolarization (Fig. 5D) and cyto c release from mitochondria (Figure S4F) to the cytosol (Fig. 5E) only in WT cells, while Bak KD cells were desensitized. To test if the desensitization of the cells is specific to tBid-induced OMM permeabilization, Bax (100 nM) was added to permeabilized cells, which caused similar mitochondrial depolarization and cyto c release in WT and Bak KD cells (Figure S4G). Thus, Bak is the primary downstream effector for VDAC2-related sensitization to tBid-induced OMM permeabilization in HepG2 and hepatocytes.
Targeting the VDAC2-Bak pathway can kill hepatocarcinoma cells while sparing normal hepatocytes
The above data demonstrate that higher expression of VDAC2 and Bak in human cancer cells and mouse tumor tissues relative to hepatocytes makes them vulnerable to tBid insult. Our analyses of public databases also indicated that VDAC2-Bak upregulation is a common feature in human HCC. Thus, we set out to test whether we can therapeutically exploit this pathway to specifically target HCC cells. We devised a two-hit strategy that combines relatively low doses of an activator of Bid-induced cell death with an antagonist of the anti-apoptotic Bcl-2 family proteins (Mcl-1, Bcl-xL) that block Bak oligomerization (Fig. 6A).

A Schematic representation of the pharmacological targeting strategy-employing an inhibitor of anti-apoptotic Bcl-2 family protein Mcl-1, S63845 together with an activator of the Bid pathway (TRAIL), tumor cells can be selectively killed. B Western blots of cyto c release in intact HepG2 and primary hepatocytes treated with 300 nM S63845 for 48 h with TRAIL (50 or 200 ng/ml) added in the final 3 h. The fraction of release, relative to high digitonin, was estimated by densitometry analysis of the western blot bands (% values above each band). Similar results were found in two biological replicates. C TRAIL dose-response curves of cell viability for HepG2 and hepatocytes with and without 48 h pre-treatment with 300 nM S63845. Cells were treated with TRAIL at the indicated concentrations for 8 h and viability was assessed by imaging propidium iodide exclusion. N = 5 biological replicates (3 technical replicates each) for 0 and 50 ng/ml TRAIL and 4 biological replicates (3 technical each) for 100 and 200 ng/ml TRAIL; statistical significance calculated by two-way ANOVA with Holm-Sidak post-hoc pairwise comparisons; statistically significant interaction between S63845 and TRAIL: p < 0.001. See p-values for pairwise comparisons in Supplementary Data 1. D Time dependence of cell killing by TRAIL (50 ng/ml) in cells with or without S63845 pre-treatment (300 nM, 48hrs). N = 2, 3 and 5 biological replicates at 2 h, 4 h, and 8 h, respectively, with 3 technical replicates within each experiment; statistical significance for the effects of time and S63845 was calculated by two-way ANOVA with Holm-Sidak post-hoc pairwise comparisons; statistically significant interaction between S63845 and time with 50 ng/ml TRAIL: p < 0.001. See p-values for pairwise comparisons in Supplementary Data 1. E TRAIL dose-response curves of WT and VDAC2KO HepG2 cell viability after 48 h pre-treatment with varying concentrations of S63845. Cells were treated with TRAIL at indicated concentrations for 4 h and viability was determined by luminescence assay, normalized to solvent-treated cells (N = 2 biological replicates). F TRAIL dose-response curves of WT and VDAC2KO PLC cell viability after 48 h pre-treatment with varying concentrations of S63845. Cells were treated with TRAIL at indicated concentrations for 4 h and viability was determined by luminescence assay, normalized to solvent-treated cells (N = 3 biological replicates). C–F Data are plotted as means ± SEM of multiple experiments; *p < 0.05, **p < 0.01, ***p < 0.001, ns: not significant; details of statistical analyzes and p-values are compiled in Supplementary Data 1. Source data are provided in the Source Data file.
First, upon recommendation of the late Gordon C. Shore, we used Obatoclax (OB), which was originally described to bind the anti-apoptotic Bcl-2 family proteins, including Bcl-xL and Mcl-1, with submicromolar Ki52,53. We combined OB with a cell-permeable Bid BH3 peptide (Bid BH3cp) that triggers Bak-dependent OMM permeabilization54,55,56. To test whether OB increased the sensitivity to Bid BH3cp, HepG2 and rat hepatocytes were treated for 24 h with 0.6 µM OB and 30 µM Bid BH3cp was added during the final 2 h. Immunoblot analysis of isolated cytosolic fractions showed release of cyto c in HepG2 cells treated with OB and Bid BH3cp but no apparent release in hepatocytes (Figure S5A). Interestingly, HepG2 cells treated with either OB or Bid BH3cp alone were also essentially unresponsive. In suspensions of permeabilized cells that were pre-treated for 24 h with 0.6 µM OB, addition of 1 µM Bid BH3cp caused rapid dissipation of ΔΨm and release of cyto c from mitochondria in HepG2 cells but not in hepatocytes (Figure S5B, C). We also checked the cell viability after OB and Bid BH3cp treatment by trypan blue exclusion. OB and Bid BH3cp individually caused small but significant decreases in the survival of HepG2 cells (p < 0.001), however, the combination of the two drugs caused ~50% cell killing, indicating a strong positive interaction of the two compounds (Figure S5D). Hepatocytes were totally resistant to the solo or combined effect of OB and Bid BH3cp (For details on statistics, see Supplementary Data 1).
As a next step, we tried OB in combination with TNF-related apoptosis-inducing ligand (TRAIL) which acts upstream of Bid truncation57. Cells were treated for 24 h with 0.6 µM Obatoclax with 100 ng/ml TRAIL added for the final 2 h. Immunoblot analysis of isolated cytosolic fractions showed a small cyto c release in HepG2 cells treated with TRAIL alone, and a much larger release in HepG2 cells treated with the combination of TRAIL and OB, while hepatocytes remained unaffected (Figure S5E). Cyto c released to the cytoplasm initiates activation of the executioner caspases58. Accordingly, caspase 3 activity was greatly elevated in HepG2 when OB and TRAIL were combined while, again, no effect was observed in hepatocytes (Figure S5F). Under the same treatment, cell viability was reduced by ~75% in HepG2 treated with the combination of OB and TRAIL (Figure S5G).
Obatoclax has been shown to target several anti-apoptotic Bcl-2 family proteins and other targets and recent literature points to indirect effects on Mcl-159,60. Because Mcl-1 exerts specific inhibitory interaction with Bak61,62 and Mcl-1 has emerged as a major resistance factor in human cancer63,64, we next applied a specific Mcl-1 inhibitor, S6384528,65 in combination with TRAIL. HepG2 and isolated mouse hepatocytes (8–12 week old male Rbfl/fl) were treated for 48 h with 300 nM S63845 with TRAIL added to the medium for the final 3 h. Immunoblots of the cytosolic fractions, showed little to no cyto c release in HepG2 and hepatocytes treated with S63845 or TRAIL alone, but a 50% cyto c release in the HepG2 treated with both 50 ng/ml TRAIL and S63845 (Fig. 6B). In hepatocytes, combination of S63845 with up to 200 ng/ml TRAIL did not cause any cyto c release. We also assessed cell viability in HepG2 and hepatocytes that were treated with 300 nM S63845 for 48 h and 0, 50,100 or 200 ng/ml TRAIL, added in the last 8 h (Fig. 6C). In HepG2, S63845 alone had no significant effect on viability, while TRAIL alone showed some cell killing with increasing concentrations (p < 0.001). The combination of TRAIL and S63845 showed significant synergistic effect at every concentration of TRAIL, reducing cell viability by as much as 60% (p < 0.001). The viability of hepatocytes, by contrast, showed no significant impacts by individual or combination treatments with TRAIL and/or S63845. S63845 was reported to have approximately six-fold lower affinity for mouse Mcl-1 compared to human66, so in a separate experiment we tested combinations of TRAIL with up to 3 μM S63845 in mouse hepatocytes and still found no significant impacts on cell viability in this range (Figure S5H). Finally, we measured the time-dependent killing of HepG2 cells treated with TRAIL and/or S63845 (Fig. 6D). 50 ng/ml TRAIL produced a small but significant reduction in viability after 4 h (p = 0.013) but showed no further killing at 8 h, whereas, following 48 h pretreatment with S63845, TRAIL caused significant and progressive killing from 2 h through 8 h. Collectively, these results support that using either Bid BH3cp or TRAIL as the activator of Bid-induced cell death in combination with OB or S63845 to suppress the anti-apoptotic Mcl-1 selectively targets HepG2 hepatocarcinoma cells while sparing hepatocytes.
We also tested an alternative strategy of combining BH3-mimetic drugs, S63845 and ABT-737, to inhibit the major anti-apoptotic Bcl-2 family proteins. ABT-737 binds with varying affinities to Bcl-2, Bcl-xL and Bcl-w67,68, that, when combined with Mcl-1 inhibition by S63845, mimics the inhibitory profile of tBid. However, the direct activator function of tBid20,69,70 is not recapitulated by this combination. 48 h treatment with up to 3 μM ABT-737 alone did not significantly impact the viability of mouse hepatocytes, however in combination with ≥ 1 μM S63845, significant cell death was observed (Figure S5I). Statistical analysis by two-way ANOVA indicated a significant interaction between the two drugs (p < 0.001). Likewise, In HepG2 and PLC cells, no significant loss of viability was observed with ABT-737 alone, while combination with S63845 showed strong interaction (p < 0.001) in both cell lines (Figure S5J). Overall, the HCC cell lines were more sensitive to combinations of S63845 and ABT-737 than hepatocytes, but the strong killing of hepatocytes at high combination doses indicated a narrower therapeutic window than S63845 and TRAIL, with which we observed no detrimental impacts on hepatocytes in the tested concentration range. Given this result, we decided to further pursue S63845 + TRAIL for selective killing of HCC cells.
VDAC2 is indispensable for the action of S63845 and TRAIL
We sought to test the two-hit strategy in two HCC cell lines, and to validate the VDAC2-dependency of its effect, using WT and VDAC2KO HepG2 and PLC cells. WT PLC cells showed overall similar dose responses to combinations of S63845 and TRAIL as HepG2 (Fig. 6E, F). In VDAC2KO cells, HepG2 showed some desensitization to treatment with TRAIL alone relative to its WT (see statistics in Supplementary Data 1), while PLC VDAC2KO somewhat desensitized to S63845 treatment alone. However, both VDAC2KO cell lines were significantly desensitized relative to their WTs overall (p < 0.001, two-way ANOVA interaction term) and with every combination treatment across the range we tested (p < 0.001) (Fig. 6E, F). Thus, both HepG2 and PLC are effectively killed by the combination of S63845 + TRAIL only when VDAC2 is expressed. Notably, PLC VDAC2KO cells were also desensitized to combination treatment with S63845 and ABT-737 (p < 0.001, two-way ANOVA interaction term) (Figure S5J). Interestingly, the sensitivity to the either of the drugs individually was not altered but the synergistic effect of combination was lost in the absence of VDAC2 (p = 0.958 interaction between S63845 and ABT-737 from two-way ANOVA).
Combination treatment with S63845 and TRAIL reduces tumor growth in vivo, dependent on VDAC2
Finally, we explored the efficacy of this combination therapy in an in vivo mouse model by subcutaneous injection of WT or VDAC2KO PLC cells into the right flank of 8 week old male SCID-NOD mice. Mice were imaged every week to monitor tumor progression. Tumors were detected earlier and showed larger tumor load in the VDAC2KO PLC-injected mice. By week 4 of tumor implantation more than 95% of the animals had detectable tumor load in both WT and VDAC2KO PLC injected animals (Figure S6A). At this time, mice were administered a combination treatment of S63845 (25 mg/kg, given intraperitoneal on days 1, 2, 3, 5 and 7) and TRAIL (5 mg/kg, given intraperitoneal on days 2, 3, 5, 7 and 9) or received a mock treatment of the solvent (200 mg/ml beta cyclodextrin in 10% DMSO and 90% saline (v/v)) (Fig. 7A). Animals injected with WT cells and treated with S63845 and TRAIL showed, on average, no change in the tumor load measured during the treatment period by bioluminescence imaging (Fig. 7B, C) or caliper-estimated volume (Fig. 7D) compared to a more than three-fold increase for the solvent-treated group. Intrahepatic implantation of PLC cells resulted in tumors in the liver and treatment with S63845 + TRAIL also stopped the tumor growth measured through bioluminescence imaging (Figure S7A). In agreement with the in vitro experiments, there was no significant effect of the combination treatment on the tumors derived from VDAC2KO cells, which showed virtually identical increase in tumor size as the solvent treated group, though both groups had somewhat slower growth than the solvent-treated WT cells (Fig. 7C).

A Graphic showing the experimental design for testing S63845-TRAIL combination treatment in vivo. Control and VDAC2KO PLC cells expressing luciferase were injected subcutaneously into the right flank of SCID-NOD mice. The tumor growth was monitored every week using in vivo bioluminescence imaging. After 4 weeks, the animals were either treated with a combination of S63845 and TRAIL or with solvent. Created in BioRender. Hajnoczky, G. (2025) https://BioRender.com/h28f802. B Representative bioluminescence images of the tumors of 3 mice per group before treatment and at 14 d after the start of the treatment period, with constant radiance (p/s/cm2/sr) scale. C Graph showing the change in tumor size from the beginning of the treatment period, measured by bioluminescence flux; Data are shown as means of all animals ± SEM, N = 29 mice for each treatment in the WT PLC group and 9/8 for solvent/S63845 + TRAIL in the VDAC2KO PLC group. ***: p < 0.001, S + TRAIL vs. solvent in WT PLC based on the estimated marginal means with Sidak adjustment multiple comparisons from a general linear model with repeated measures. D Box plots of change in tumor volumes at days 6 and 14 estimated by caliper measurement with representative images of tumor sizes from the solvent and treatment group in the WT PLC group (N = 19/27 mice, solvent/S63845 + TRAIL). Boxes indicate the median, 25th and 75th percentiles, whiskers show 10th and 90th percentiles. p < 0.001 for S63845 + TRAIL vs. solvent overall from two-way repeated measure ANOVA. Holm-Sidak pairwise post-hoc values as indicated. E Representative images of hematoxylin and eosin (H&E)-stained tissue slices of tumors from two mice per group, dissected at 21 d after the start of the treatment period. For each treatment group, 8 samples each from mice injected with WT cells, and 5 each from VDAC2KO were randomly selected for H&E staining (scale bar: 200 µm). F Box plots showing the difference in tumor load as measured by bioluminescence imaging (left) and caliper measurements (middle), and the animals’ body weight (right) as a percentage of Day1 of treatment. (N = 6/8 mice solvent/S + TRAIL; p-values as indicated from two-sided rank sum test). Details of statistical analyzes and p-values for (C, D, F) are compiled in Supplementary Data 1. Source data are provided in the Source Data file.
After the treatment period, tumor growth was monitored for 12 days (3 weeks from the start of treatment), after which the mice were euthanized and liver and tumor biopsies were collected for histology and biochemistry. Hematoxylin and eosin staining of tumor sections taken from mice injected with WT PLC cells and under treatment with S63845 and TRAIL (n = 8) revealed extensive necrotic regions of the tumors (Fig. 7E). In solvent-treated WT (n = 8) and VDAC2KO solvent and combination treated groups (n = 5 for each group), regions with only focal necrosis or no necrosis were observed. This was also confirmed using the TUNEL assay where treatment with S + TRAIL in WT PLC cells showed massive staining as compared to the solvent control or the normal liver (Figure S7B). Importantly, histology of sections of liver, lung (Figure S6B, C), heart, kidney and spleen (Figure S8) collected from the treated animals showed no abnormalities that would indicate tissue toxicity from the treatment regimen. Immunohistochemistry for GFP in the tumor biopsies also confirmed that the tumor was indeed generated from the implanted cells (Figure S9A) and Ki-67 showed that they were highly proliferative (Figure S9B). Immunostaining of the tumor and normal liver sections revealed that the normal liver has lower VDAC2 expression than the tumor and that different cell types within the liver have similar expression of VDAC2 (Figure S9C–D). The efficacy of this combinatorial treatment was also tested over a longer time-period, where the animals were kept up to 30 days after the conclusion of the treatment regimen. The tumor load as measured through bioluminescence imaging and caliper measurement was less in the treated group vs the solvent control group, while the body weight of the treated mice was greater (Fig. 7F), indicating an overall improvement in their health. These results collectively suggest that elevated expression of VDAC2 in HCC relative to hepatocytes may represent an Achilles’ heel that can be exploited therapeutically to selectively kill cancer cells.
Discussion
The major finding of our experiments and datamining is that liver cancers display VDAC2 upregulation that results in Bak elevation in the OMM. A consequence of this is an enhanced sensitivity to tBid-induced mitochondrial apoptosis that can be exploited to selectively target HCC in vivo without harming the normal liver tissue.
VDAC upregulation in cancer
Upregulation of VDACs, primarily VDAC1 has been reported in some cancer cell lines and tissues including HCC71,72,73. VDAC1 was also suggested to be critical in growth and proliferation of cancer cells73,74. All VDAC isoforms showed upregulation in the hepatocarcinoma cell line, AH13075. We found VDAC1 at similar levels in HepG2 cells and normal hepatocytes (Fig. 2A) but databases of paired patient-derived samples48,49 show concomitant increases in VDAC1 and VDAC2 in HCC relative to liver tissue are common in the HBV-affected Chinese populations (Figure S2B). Our cross-cancer analysis of vdac1 expression in TCGA cohorts found significant upregulation in 9 out of 12 cancer types relative to normal tissue, including all four that show vdac2 increase (Figure S2F). Of these, the LIHC (HCC) cohort has the greatest ratio of vdac2:vdac1 changes (Figure S2G).
Previously, specific VDAC2 upregulation has been reported in malignant mesothelioma76, and thyroid tumors/follicular adenoma77,78 and for the latter it has been proposed as a diagnostic marker78. Furthermore, VDAC2 was used a mitochondrial marker predicting treatment failure and tumor recurrence in patients with advanced-stage, estrogen receptor positive breast cancer79. We documented elevated VDAC2 protein in several human liver cancer cell lines ( > 2-fold, Fig. 2C), and in tumors induced from hepatocarcinoma cell lines or by chemical hepatocarcinogens in mouse (Fig. 2H). Broad upregulation of VDAC2 in HCC was confirmed in human HCC databases (Fig. 3D–F, Figure S2F) and in a new panel of paired human HCC and liver samples (Fig. 3C). VDAC2 upregulation might be prominent and have particularly great impact in the liver because VDAC2 abundance is very low in liver31 compared to most other tissues (Fig. 3A, B).
We did not experimentally investigate the mechanisms of the apparent repression of VDAC2 in liver or of its increase in carcinogenesis, but some clues arose from the public databases of human HCC patients. Gao et al. reported a Spearman correlation of 0.53 for VDAC2 mRNA and protein levels across tumor and normal liver samples (near the median of all protein-mRNA pairs)49, implying that transcriptional regulation is a factor, but whether mRNA upregulation alone can explain the protein-level changes is not yet clear. VDAC2 increase does not seem to be commonly mediated by copy number increases: in the analyses of the TCGA cohort available on cBioportal51, only 12% of samples are predicted to have more than two copies of VDAC2. Nor is the protein abundance linked to regulatory mechanisms that create the proteomic subtypes (Figure S2E). Further studies are needed to fully understand the causes of VDAC2 upregulation.
Is Bak increased in HCC as an outcome of VDAC2 upregulation?
Studies by the Mihara group10 and us9 have shown that VDAC2 is required for effective import of Bak into the OMM and unimported Bak is prone to rapid turnover. The engagement of VDAC2 is isoform specific; VDAC1 failed to support Bak recruitment to the OMM9,11. Moreover, in the proteomics data of Gao et al49. differences between tumor and liver in VDAC2, but not VDAC1, significantly correlated with Bak. This likely explains why we detected little VDAC2 and Bak in normal hepatocytes and liver (Fig. 2A, B and H, Fig. 3C). Ample evidence suggests that the shared OMM permeabilization function of Bak and Bax is present in the liver32,33,34,35,37, however it seems to be mediated primarily through Bax (Fig. 1E), which acts on a much longer time scale than the rapid Bak-mediated permeabilization in HCC cells.
We are not aware of literature on increased expression of the pro-apoptotic protein Bak in cancer. However, our in vitro and in vivo studies (Fig. 2A, B and H), human tissue samples (Fig. 3C), and datamining (Fig. 3D–F) revealed VDAC2-associated upregulation of Bak in HCC as well as several other cancer types (Figure S2F). Furthermore, we documented an overall strong positive relationship between VDAC2 and Bak protein increases in HCC (Fig. 3C, F), however the different patterns of Bak and VDAC2 in tumors of different proteomic subgroups imply other mechanisms that drive the subgroup distinctions can also regulate Bak abundance independently from VDAC2 (Figure S2E). We also showed here, specifically in the liver, that VDAC2 overexpression causes Bak increase in the mitochondria (Fig. 4D) and that in HCC cells VDAC2 silencing results in a decrease in Bak (Figure S3C, E). Thus, Bak mRNA and protein are commonly elevated in HCC, and the rise in Bak is contingent upon the upregulation of VDAC2. Notably, tissues such as heart, skeletal muscle and brain, where mitochondria have the highest levels of VDAC2 and VDAC1, presumably in support of their energetic demands, express Bak at low levels (Fig. 3A).
What benefit might be offered by VDAC2 to liver cancer?
VDAC2 was first described as a suppressor of Bak-mediated apoptosis16. This could confer the recognized advantage of anti-apoptotic mechanisms in cancer growth28. However, we have shown that VDAC2, through recruitment of Bak to the OMM, sensitizes cells to tBid-linked and Bak-mediated cell killing9. We also showed here that increased tBid-linked apoptosis is broadly present in HCC and is overwhelmingly dependent on VDAC2 and Bak. Thus, VDAC2 does not seem to attenuate apoptosis in HCC through Bak.
In terms of tumor initiation and growth, our in vivo data do not support a benefit from the presence of VDAC2 since we detected tumors earlier and of larger size in mice injected with VDAC2KO PLC cells than in the WT-injected control (Figure S6A). However, VDAC2 was upregulated in tumors of diverse origins including chemically induced mouse tumors (Fig. 2H), human samples with different risk factors (ALD, HBV, HCV), and across proteomic subgroups of HBV + HCC (Figure S2E). We found correlation of worse survival of HCC patients with high VDAC280 and Bak81,82 in the TCGA LIHC cohort, indicating that VDAC2 might be beneficial in some way to HCC pathogenesis, perhaps related to the higher levels of Bak detected in the proteomic subgroups with worse prognosis (Figure S2E). It seems that VDAC2 upregulation is part of a broader reprogramming in HCC carcinogenesis. The subtleties of its connections to other molecular or clinical features need to be dissected in future studies.
Can upregulation of VDAC2/Bak be exploited to selectively harm HCC in the liver?
VDACs have long been considered as targets for cancer therapy71,83,84 because of their role in the transport of metabolites into and out of mitochondria and thus, in the regulation of mitochondrial metabolism and the Warburg effect4,85. In case of VDAC1, the most expressed isoform in most tissues, it has also been proposed that interaction with the rate-limiting enzymes of glycolysis, hexokinases, will increase glycolysis and block the pro-apoptotic function of VDAC1 protein in interaction with Bax83. VDAC1-based peptides73 and plant extracts stimulating VDAC1 expression86 are currently evaluated in cancer therapy. Erastin is the only anti-cancer drug that has been suggested to target VDAC2, resulting in non-apoptotic cell death87.
Our demonstration of VDAC2-mediated Bak upregulation specifically in HCC indicates that HCC might be “primed” to be targeted by an activator of Bak or drugs that can block its inhibitors. Bak can be inhibited by Bcl-xL but structurally the best complement for Bak is Mcl-161 that is also often upregulated in HCC88. Sorafenib, a multi-kinase drug, induces downregulation of Mcl-1 and has been used for HCC treatment89,90. Targeting Mcl-1 by antisense oligonucleotides was reported to sensitize HCC cells to cisplatin91. Obatoclax, which suppresses Mcl-1, has been shown to reduce HCC cell adhesion and migration92. Recently, S63845, a specific Mcl-1 inhibitor, was found to induce apoptosis signaling in HCC stem cell-like cells93. ABT-737, a BH3 mimetic that strongly binds Bcl-2, Bcl-xL and Bcl-w, but not Mcl-194, overcame Bcl-xL upregulation in HCC. However, in samples with Mcl-1 increase, it was not effective and had to be combined with other therapeutics95.
To induce Bak/Bax activation, TNF-related apoptosis-inducing ligand (TRAIL) has been commonly used96. TRAIL induces cell death in many human cancers without apparent toxic side effects in normal tissues. In hepatoblastoma cells, TRAIL has been tested in combination with ABT-737 and Bortesomib97. In another study, using mice carrying human hepatoblastoma, Obatoclax synergized more strongly with TRAIL/TNFα than ABT-73798. Obatoclax also potentiated TRAIL in models of hepatoblastoma and pancreatic cancer98,99. In our experiments, combining inhibitors, S63845 and ABT-737, was detrimental to hepatocytes unlike S63845 and TRAIL (Figure S5H, I). This could be due to a lack of sensitivity to TRAIL at the receptor level in hepatocytes, but also to insensitivity to tBid due to their scarcity of mitochondrial Bak. S63845 and ABT-737 together mimic the inhibitory effects of tBid on Mcl-1, Bcl-xL, Bcl-2 and Bcl-w68,100 but the drugs lack tBid’s ability to directly activate Bak20,69,70. There are also some differences in the relative affinities of Bid and ABT-737 for different targets37,67,68, which may be relevant for the combination treatment where the doses used have minimal individual impacts, and the membrane targeting of tBid upon cleavage may add an additional layer of targeting. Our finding that a significant portion of PLC cells’ sensitivity to S63845 + ABT-737 is dependent on the presence of VDAC2 (Figure S5J) is consistent with Bak as a primary effector. This will need confirmation in HepG2 and other cell models as well as further dissection of the other pathways, likely Bax-mediated, that are activated by this treatment in HCC cells and hepatocytes.
In our study, we homed in on the combination of S63845 and TRAIL for selective killing of HCC cells while sparing normal hepatocytes. We confirmed that the cell killing was dependent on the expression of VDAC2 in HepG2 and PLC cells (Fig. 6E&F) and employed S63845 + TRAIL in vivo, observing arrest of HCC tumor growth only in tumors expressing VDAC2 and no significant damage to liver tissue (Figs. 7D–F, Figure S6BC, Figure S8A). These results not only extend the literature on the efficacy of S63845 + TRAIL treatment and HCC selectivity over normal liver, but also rationalize why the treatment strategy is effective. However, further experiments will be needed to test for detrimental impacts on non-tumor cells, for instance using the humanized Mcl-1 mouse model101. More broadly, going forward it will be imperative to establish the most effective, and clinically useful treatment to exploit this vulnerability, whether S63845 + TRAIL or perhaps a different combination from the numerous BH3-mimetic compounds developed in recent years. Our data with ABT-737 (Figure S5I, J) shows that cells lacking VDAC2 (hepatocytes and PLC VDAC2KO) retain sensitivity to certain apoptotic stimuli, highlighting the need to specifically activate Bak, as tBid does, while minimizing activation of other pathways. Notably, for human HCC, the drugs can be directly delivered to the liver by regional chemotherapy that would increase the HCC selectivity over other organs102,103,104. In conclusion, our study suggests that elevated expression of VDAC2 in HCC relative to hepatocytes may represent an Achilles’ heel that can be exploited therapeutically to selectively kill the cancer cells.
Methods
All animal experiments were performed in accordance with the regulations of the animal ethical committee (IACUC) of Thomas Jefferson University, protocol IDs 01338-2 (mouse) and 00192 (rat). Human sample studies were approved by the IRB at Thomas Jefferson University (IRB#20D.138).
Cell cultures
HepG2 (ATCC, HB-8065), HuH-7 (RIKEN BRC Cell Bank: RCB1366), PLC/PRF/5 (PLC) (ATCC, CRL-8024), Hep3B2.17 (Hep3B) cells (ATCC, HB8064) were cultured in Eagle’s minimal essential medium supplemented with 10% fetal bovine serum (FBS), 2 mM glutamine, 1 mM pyruvate and 100 U/ml penicillin and 100 µg/ml streptomycin in humidified air (5% CO2) at 37 °C.
Primary rat hepatocytes were isolated by collagenase perfusion of cannulated liver from male Sprague-Dawley rats as described previously105. Primary mouse hepatocytes were isolated from the livers of male WT and Bak-/- mice using collagenase perfusion as described previously106.
Both rat and mouse hepatocytes were then cultured in Williams E medium (Invitrogen) containing 4.6 mM L-glutamine, 200 µg/ml penicillin/streptomycin, 100 nM dexamethasone (Sigma), 10 µg/ml Insulin (Sigma) and 5-10% FBS in tissue culture plates coated with rat tail collagen type I (BD Bioscience). After 4 h, medium was changed which medium contained 0-2% FBS. For experiments testing the effect of the cell culture environment on rat hepatocytes, cultures were maintained for 1 week in the medium used for HepG2 cells. Infection of rat and mouse hepatocytes was done using 2000 adenoviral particles (GFP or VDAC2) per cell for 24-36 h.
Primary human hepatocytes derived from two deidentified donors were obtained from Lonza. Hepatocytes were plated as confluent monolayers in collagen-coated plates and were cultivated in Hepatocyte Maintenance Medium (CC-3197, Lonza) according to the manufacturer’s protocol.
For imaging experiments cells were plated onto poly-D-lysine-treated glass coverslips at a density of 20,000 − 25,000/cm2 and were grown for 3 − 4 days. For cell suspension studies with cultured hepatocytes, cells were cultured for 3 − 4 days in 75 cm2 flasks.
Animal housing
Laboratory mice and rats were housed in facilities with a 12/12 h light/dark cycle daily with temperature maintained at 18-23 C and 30-70% relative humidity.
Obtaining human liver and HCC samples
Patients undergoing resection or transplant with underlying liver disease and cancers were recruited for study participation at the Thomas Jefferson University Hospital. Informed written consent for the collection of tissue and clinical information was obtained from all patients using a study protocol approved by the TJUH Institutional Review Board. Final diagnosis was determined by final pathology reports and standard clinical pathological variables including sex (self-reported), age, date of surgery, tumor stage, and treatment type were collected for each patient as part of a prospective liver disease database. Clinical data is summarized in Supplementary Table 1, but was not considered in the analyzes herein because the small number of patients included is insufficient for statistical comparison
Isolation of mitochondria
Rat (Sprague-Dawley, males, 8–12 weeks old) and mouse (male RBfl/fl, 8–12 weeks old) liver and tumor mitochondria were generated as described107 with minor modifications. Briefly, liver slices were homogenized with a Dounce teflon/glass homogenizer (pestle B) in Buffer A containing 250 mM mannitol, 70 mM sucrose, 0.5 mM EGTA, HEPES-NaOH, 5 mM, pH 7.2, and 0.1 mm phenylmethylsulfonyl fluoride. The homogenates were centrifuged at 1000 g for 10 min at 4 °C to remove intact cells and nuclei, and the supernatants were further centrifuged at 10,000 g at 4 °C for 10 min to collect the heavy membrane fractions (mitochondria). The mitochondrial pellet was resuspended in small volume of Buffer B containing 250 mm sucrose, 10 mM Tris-Cl, pH 7.5, 0.1 mM EGTA, and 0.1 mM phenylmethylsulfonyl fluoride. Mitochondria from HepG2 cells were isolated as described108. Cells were harvested using trypsin/EDTA and washed with Na-HEPES/EGTA. All further steps were carried out at 4 C°. Cells were resuspended in a hyposmotic buffer (water (80%), ICM (20%), 5 mM MgCl2, 200 µM EGTA and 1X complete protease inhibitors (Roche)) on ice for 10-15 min. Subsequently, the cells were homogenized in a Dounce glass/glass homogenizer (30–35 strokes, tight pestle). To restore osmolarity 3 volume of 100% ICM supplemented with sucrose 125 mM, EGTA 200 µM and MgCl2 5 mM was added. To eliminate unbroken cells and nuclei the homogenate was centrifuged at 750 g (10 min). The supernatant was further centrifuged at 10,000 g (15 min) and the pellet (mitochondrial fraction) was resuspended in small volume of ICM, protease inhibitors and EGTA (10 µM). Isolated mitochondria were kept on ice and used within 2-3 h of preparation.
∆Ψm and cyto c release assay in suspension of permeabilized cells and isolated mitochondria
Measurement of ∆Ψm in skinned cells and in isolated mitochondria was carried out as described previously40. Briefly, equal aliquots of HepG2, Hep3B, Huh7, PLC cells (2.4 mg protein each) or hepatocytes (1.2 mg protein) were resuspended and permeabilized with 20-40 µg/ml digitonin in 1.5 ml of an intracellular medium (ICM) composed of 120 mM KCl, 10 mM NaCl, 1 mM KH2PO4, 20 mM Hepes/Tris, pH 7.2 supplemented with 1 µg/ml of each antipain, leupeptin, pepstatin and 2 mM MgATP for 5 min. For isolated mitochondrial analysis equal aliquots (0.5 mg/ml protein each) were resuspended and measured in a similar buffer without digitonin. For washout protocols, after permeabilization, the cells were separated from the buffer rapidly by centrifugation at 10,000 g for 5 min and the pellet was resuspended in fresh ICM. Measurements were carried out in the presence of 2 mM MgATP, 2 mM succinate and 5 µg/ml oligomycin to prevent reversed function of the mitochondrial F1F0 ATPase. When the effect of Bax was tested, 4 mM MgCl2 was also present. To detect ∆Ψm, TMRE (1-2 µM) and Rhodamine123 (Rh123, 2 µM) was used for skinned cells and isolated mitochondria, respectively. Fluorescence was monitored in a fluorometer (Delta RAM, PTI) using ex: 540 nm and em: 580 nm for TMRE and ex: 500 nm and em: 530 nm for Rh123. Experiments were carried out at 35 °C under continuous stirring. tBid and oligomeric Bax109,110 were kindly provided by Dr. Bruno Antonsson (Merck SERONO) or were obtained from R&D Systems.
At the end of the fluorometric measurements of ∆Ψm, supernatant was separated from the membranes by centrifugation at 10,000 g for 5 minutes or by a rapid filtration technique40. Lysates from membrane fractions and whole cells were generated by using RIPA buffer supplemented with complete protease inhibitor (Roche).
Fluorescence imaging
Prior to use, the cells on the coverslip were pre-incubated for 15 min in an extracellular medium containing 2% BSA and 30 nM TMRE (Invitrogen) at 37 oC for dye loading. Subsequently, they were washed with a Ca2+ free extracellular buffer and then incubated in ICM supplemented with 2–40 µg/ml of digitonin111 for 5-6 min. After permeabilization, the cells were washed into fresh buffer without digitonin and incubated in the imaging chamber at 35oC. 2 nM TMRE was present in the buffer during the run. Fluorescence imaging was performed using an inverted microscope (Leica DMIRE2) fitted with a 40x Olympus objective (Uapo340, NA 1.35) and a cooled CCD camera (Photometrics Ltd). Images were captured continuously using an optical filter (Chroma) for rhodamine with a 3 s acquisition delay. All image analysis was done using custom designed software (Spectralyzer).
Drug treatment and viability assays
Stocks for Obatoclax mesylate (GX15-070, Selleck Chemicals) (5 µM), cell permeable Bid BH3 peptide (Bid BH3cp, [Arg](9)-Bid BH3; Selleckchem), (5 mM), recombinant human TRAIL (Peprotech) (100 ug/ml) and S63845 (Apex-Bio A8737) (300 uM) were prepared in DMSO for Obatoclax or S63845 and water for BH3 domain peptide and TRAIL.
HepG2 cells (33-50,000/cm2) and rat/mouse hepatocytes (50-70,000/cm2) were seeded for 24 h. Next day, cells were treated with various concentrations of Obatoclax, S63845, or S63845 and ABT-737 for 24 or 48 h. The media was refreshed with 2% FBS media containing BH3 domain peptide of Bid or TRAIL for 2-8 h in incubator before running experiments.
Cell viability was assessed either by counting the cells using 1) trypan blue exclusion after harvesting cells, used for the combination of Obatoclax-BH3 Bid peptide or Obatoclax-TRAIL, or, 2) staining with Hoescht 33342 and propidium iodide and automated, imaging-based cell counting in multi-well plates, or 3) by CellTiter-Glo (Promega #G9241) bioluminescence-based assay.
Imaging method (2), used for initial S63845 + TRAIL experiments in HepG2 and hepatocytes (Fig. 6CD), and performed using an Olympus IX81 microscope with ZDC autofocus module, using a LUCPLFLN 20x/0.45NA objective, Fura2/TRITC multiband dichroic and emission filter set with 380 nm and 548 nm excitation for Hoescht and PI, respectively (Chroma), a Hamamatsu ImagEM EM-CCD camera (Hamamatsu), Lambda DG4 Xenon light source (Sutter) and an encoded, motorized stage (Prior, H117), controlled through Metamorph software (Molecular Devices).
A tile-scan image was configured for the first well using the ‘Scan Slide’ app in Metamorph and a custom-made Python (2.7) script generated settings files and a Metamorph journal to image identical region in each well of a 24-well plate. Stitching and compilation of tile-scan images was done in ImageJ (FIJI) using the “Grid/Collection stitching” plugin112, automatized by a custom-made script (Python 2.7 (Jython)). Each tile-scan contained thousands of cells, which was analyzed by custom ImageJ Jython script executing the following steps:
-
1.
Made smoothed (3×3 pixel average) copy of Hoechst 33342 image.
-
2.
Found maxima of smoothed image (user-determined noise threshold)
-
3.
Drew binary image of circles centered at maxima points (user-determined nucleus size)
-
4.
Thresholded and binarized smoothed image (user-defined value or automatically by Li’s Minimum Cross Entropy method).
-
5.
Created union of two binary images.
-
6.
Used ImageJ ‘Analyze Particles’ to get ROI selections (user-defined size filtering applied)
-
7.
Measured Hoechst and PI intensities for each mask and output to table or file.
Bioluminescence assay (3) was used for experiments with HepG2 and PLC VDAC2 KO cells (S63845 + TRAIL and S63845 + ABT-737). 5000 cells/ well in a 96 well plate were seeded for 12 h. Cells were then treated with S63845 or S63845 + ABT-737 concentrations treatment for 48 h and the media was refreshed and TRAIL was added for the last 4-8 h of the incubation. At the end of 48 h, CellTiter-Glo reagent was added to each well followed by incubation for 10 min, and the luminescence readout was recorded using a plate reader (Biotek Synergy Neo2).
To evaluate cyto c release, equal aliquots of cellular protein in each condition were resuspended in ICM containing 20–40 µg/ml digitonin supplemented with 2 mM MgATP and 2 mM succinate and 5 µg/ml oligomycin at 35 °C under continuous stirring for 5 min. Then cytosol and membrane fractions were separated by centrifugation at 10,000 g for 5 min and subjected to western blot analysis.
Immunoblot analysis
Proteins 20–40 µg were separated on 12% or 15% SDS-PAGE and were electrophoretically transferred to nitrocellulose membranes. Membranes were blocked with blocking buffer (Pierce) overnight, followed by incubation with primary antibodies using the dilutions recommended by the manufacturers. Primary antibodies were anti–cytochrome c 1:1000 (clone 7H8.2C12; Pharmingen 556433), anti-VDAC2 1:1000 (Abcam ab47104), anti-Bak NT 1:500 (Millipore 06-536), anti-Bax N20 1:200 (Santa Cruz sc-493), anti-VDAC1 1:1000(Abcam ab15895), anti-Actin 1:2000 (BD Biosciences 612656), anti-TOMM40 1:1000 (Abcam ab51884), anti-Tim23 1:2500 (BD Biosciences 611222), and anti-Prohibitin 1:1000 (Abcam ab28172). After incubation with the primary antibody, bound antibodies were visualized using horseradish peroxidase–coupled secondary antibody (GE Healthcare) and West Pico chemiluminescence–developing kit (Pierce) or by infrared fluorescence using Licor CW800-tagged secondary antibodies.
Bak knock-down
Bak was silenced using a lentiviral shRNA system (Santa Cruz, sc-29786-V). Briefly 2-5*105 HepG2 cells were seeded in 35 mm dish and treated with Bak shRNA according to the manufacturer’s protocol.
CRISPR-Cas9 knockout of VDAC2 in HCC cells
PLC: sgRNA sequences targeting exons 3 (Clone#1) and 2 (Clone#2) of vdac2 were designed: ATTTGTTGAAGGTTTTGGGT and GATGGAGGAATACACATTGC, respectively. Each of the gRNAs was cloned into the pCas-Guide-EF1a-GFP (GE100018) vector from Origene. PLC cells were transfected with the indicated plasmids using Lipofectamine (Life Technologies, Carlsbad, CA, USA), 48 h after transfection single cells were sorted for GFP expression and collected in 96 well plates. The single clones were grown in EMEM + 10 % FBS and checked for VDAC2 expression using immunoblot. Clone#1, which was used for in vitro cell death and in vivo experiments, was additionally validated by PCR amplification of a ~ 550 bp fragment of the genome surrounding the gRNA target and Sanger sequencing using the primer pair, forward: AAAACTAGACAAAGCAGCATAGGGA and reverse: TGGGTTCCCTGCCTTCAAATGT, and analysis by the ICE v2 CRISPR analysis tool (Synthego, ice.synthego.com).
HepG2 VDAC2KO cells were generated by the Cristiana Care Gene Editing Institute through a commercial partnership with Jefferson using a dual gRNA strategy targeting exon 4 of vdac2 (See Figure S3A). gRNAs: TGTTAGGAATTTTCAACGTC and AGAAATCGCAATTGAAGACC.
Lentiviral expression of GFP-luciferase
The GFP_luciferase construct (CAG-ffLuc-eGFP lentiviral vector) was received as a kind gift from Dr. Chi-Ping Day at NIH. The virus packaging and infection was done as described113. Briefly, HEK293T cells were co-transfected with the ViraPower™ Packaging and the lentivirus expression construct using Lipofectamine 2000. The media was changed the next day and the virus particles were harvested 48 h later from the supernatant after passing it through a 0.45 µm syringe filter. For transducing PLC control and VDAC2 KO cells, 10 cm plate with 50% confluent cells was transduced with lentiviral particles collected above. 1 ml of the collected lentivirus in 10 ml media was added to the PLC WT and VDAC2 KO cells and and the expression was checked under the microscope after 48 h.
Generation of tumors in mice
For Figure S1C, tumor xenografts were generated as described114. Briefly, male 8 week old SCID-NOD were injected subcutaneously at a single site with 5 × 10⁶ HepG2 cells containing HBV-encoded X antigen (HepG2X cells)115. Animals were sacrificed 6 weeks post-injection and the tumors were verified as being HCCs by H&E staining.
The genotoxic hepatocarcinogen, diethylnitrosamine (DEN)-induced tumors were generated as described116. Briefly, at day 14 male Rbfl/fl mice were treated with a single i.p. injection of DEN (Sigma) dissolved in saline at a dose of 20 mg/kg body weight; littermates used as controls were inoculated with an equal volume of saline and then aged to 9 months. Mice were then sacrificed and the tumors were harvested. Control mice were also aged to 9 months and sacrificed in a similar fashion to harvest normal liver. The genotoxic carcinogen Aflatoxin B1 (Sigma-Aldrich) induced liver tumors were generated as described before117.
To create a xenograft model of HCC, 1 million PLC cells (WT and VDAC2KO) expressing luciferase were inoculated subcutaneously at the right flank of 10 weeks old, male, SCID-NOD mice obtained from Jackson Laboratories. 70 mice were injected with PLC control cells and 20 mice were injected with VDAC2KO cells. For the orthotopic model, 0.2 million PLC cells were injected intrahepatically into the left lobe of the mouse liver after opening the peritoneum cavity. 20 mice each were injected with PLC control and VDAC2KO cells. The tumor progression was monitored every week with the help of in vivo imaging system (IVIS) for 4 weeks post implantation of the cells. At 4 weeks, the tumor dimensions were recorded with calipers as well as IVIS. The animals were randomly assigned to two equal groups: half of the animals from control and VDAC2KO injected cells respectively were given a combination treatment of S63845 (25 mg/kg, given intraperitoneal on days 1, 2, 3, 5 and 7) and TRAIL (5 mg/kg, given intraperitoneal on days 2, 3, 5, 7 and 9); while the other half received a mock treatment of the solvent control (20% beta cyclodextrin in 10% DMSO and 90% saline). The tumor sizes were measured both physically and with the IVIS (Living Image 4.7.2.20319) in a double-blind approach every week for 3 weeks after the commencement of the treatment. If obvious weight loss was noted (maximum weight loss: 20%), or the animal does not eat for 24 hours, and the attending veterinarian believed that this condition could not be resolved, the animal was euthanized. During the monitoring, if a condition developed such that the attending veterinarian believed that the animal was in a state from which pain cannot be relieved, or satisfactory health could not be achieved, upon the advice of the veterinarian the animal was euthanized. For animal bearing tumors, animals with tumor ‘burden’ larger than 2 cm3 were to be euthanized, but in our study, we did not have a weight loss >20% and the maximum tumor burden was around 0.6 cm3. At the end of 3 weeks, the mice were sacrificed and tissues were collected for histology and biochemistry.For the long-term efficacy of the treatment, HepG2 cells were used and the mice were kept for 30 days post conclusion of the treatment. The average tumor load was calculated for each group and plotted using GraphPad prism software. The animals that did not develop tumor or died prior to completion of the treatment were left out of the study.
Histopathological, IHC and TUNEL analysis
Histopathological and IHC assay were performed by Translational Pathology Shared Resources at Sidney Kimmel Cancer Center, Thomas Jefferson University. Mouse tissue samples were harvested and fixed in 4% formaldehyde fixative at room temperature for 12 hours, then processed and embedded in paraffin for sectioning. Formalin-Fixed Paraffin-Embedded (FFPE) blocks were cut at 4 µm. H&E were performed by using standard methods. IHC staining was performed using an intelliPATH FLX® Automated Slide Stainer (Biocare medical, LLC) with manual staining for Anti-VDAC2 antibody. Antibodies and epitope retrieval methods are: Anti-Ki67 (Abcam #ab16667) 1/100 dilution; Anti-GFP (Abcam #ab13970) 1/2000 dilution; Anti-VDAC2 Abcam #ab118872, Heat Induced Epitope Retrieval (HIER) using buffer (Citrate buffer, pH6.0 or Tris -EDTA buffer, pH9.0) at 98 °C for 20 minutes. Basically, the slides were deparaffinized, rehydrated and then undergo epitope retrieval. After endogenous peroxidase, normal serum and endogenous biotin blockings, primary antibodies were applied and incubated at room temperature for 30 minutes. Biotinylated secondary antibody and ABC-HRP complexes were applied following the primary antibodies with 30 minutes incubation time at room temperature. Three 1xTBST washes were performed between each step above. The signals were visualized using DAB. The slides were counter stained with Hematoxylin, dehydrated, cleared and coverslipped with Permount mounting medium. TUNEL stain was performed using TACS 2 TdT-DAB In Situ Apoptosis Detection Kit (Bio-Techne, Cat# 4810-30-K) following the manufacturer’s instructions.
Estimation of mitochondrial content in proteomics data
The three proteomics studies we used employed tandem mass tag (TMT) methodology for quantitative mass spectrometry45,47,49 and reported log scale relative abundances for each protein normalized across all samples. Using a curated list of over 1000 mitochondrial proteins118, the relative protein abundance for every mitochondrial protein present in the proteomics dataset was pulled out for each sample. We reasoned that persistent shifts in the relative abundances of mitochondrial proteins in a sample would reflect the mitochondrial content. We used the median of each resulting list of values to minimize the effect of outliers and the estimate of relative mitochondrial content.
Statistics
Experiments were replicated in ≥ 2–5 different cell preparations. Data are presented as means ± S.E.M except where noted. Statistical significance was calculated in SigmaPlot 12.5 or SPSS 28.0 and p < 0.05 was considered significant. Post-hoc testing was used for pairwise comparisons in multi-group/multi-variable ANOVAs and multiple hypothesis adjustments within each experiment. Details of statistical tests and p values for each figure panel are shown in Supplementary Data 1.
Reporting summary
Further information on research design is available in the Nature Portfolio Reporting Summary linked to this article.
Responses