VDAC2 loss elicits tumour destruction and inflammation for cancer therapy

Main
Immunotherapies such as adoptive cell therapy (ACT) and immune checkpoint blockade (ICB) show considerable clinical benefits for cancer treatment1,2. CD8+ T cells contribute to the cancer–immunity cycle and immunotherapeutic effects3 by releasing cytotoxic granules4 and producing pro-inflammatory cytokines5. In particular, IFNγ contributes to tumour control by increasing tumour antigen presentation and production of chemokines that mediate immune cell recruitment and remodelling of the tumour microenvironment (TME). Accordingly, IFNγ signalling is key to the immunotherapeutic success of ACT and ICB6,7. Nonetheless, immunotherapies do not achieve sustained clinical responses in most patients with solid tumours1,2,8, with loss-of-function mutations in IFNγ-pathway-related genes accounting for such therapeutic resistance in a small population of patients9,10. As it remains unclear how the majority of cancers evade immunosurveillance11, targeting the mechanisms that overcome tumour resistance to IFNγ and CD8+ T cell-induced cytotoxic effects holds promise for inducing potent anti-tumour effects and maximizing immunotherapeutic responses.
The TME is characterized by nutrient competition and metabolic communication between cancer cells and immune cells that contribute to the tumour immune escape12,13,14,15. Furthermore, targeting metabolism-associated processes, including electron flow through mitochondrial complex I16 or autophagy17, in cancer cells reinvigorates anti-tumour immunity and ICB. However, we lack a systemic understanding of the molecules or pathways in tumour cells that mediate immune escape, including those related to metabolism and associated signalling events.
VDAC2 mediates tumour immune evasion
To identify metabolism-associated factors underlying tumour immune evasion, we transduced Cas9- and ovalbumin (OVA)-expressing B16F10 (B16-OVA) melanoma cells with a single guide RNA (sgRNA) library targeting 3,017 metabolism-associated genes18, and performed CRISPR drop-out screens19 under conditions of T cell-mediated immune pressure (Fig. 1a and Methods). sgRNAs targeting Vdac2 were among the top depleted sgRNAs in tumour cells responding to immune pressure in vitro and in vivo (Fig. 1b,c, Extended Data Fig. 1a and Supplementary Table 1a–d), suggesting its role in tumour immune evasion. To validate these findings, we transduced Cas9-expressing B16-OVA tumour cells with two independent sgRNAs targeting Vdac2 (or non-targeting control, NTC) to mediate Vdac2 deletion (Extended Data Fig. 1b and Supplementary Table 2). VDAC2-deficient B16-OVA tumour cells were more sensitive to OT-I-mediated cytotoxicity (Fig. 1d and Extended Data Fig. 1c) but showed undisturbed in vitro proliferation (Extended Data Fig. 1d). Also, Vdac2 deletion in MC38-OVA tumour cells increased their sensitivity to OT-I-cell-mediated killing (Extended Data Fig. 1b,e). After transplantation into immunocompetent wild-type mice, VDAC2-deficient tumour cells showed greatly reduced growth, associated with extended mouse survival, while such phenotypes were not observed in immunodeficient Rag1−/− mice (Extended Data Fig. 1f,g), suggesting adaptive-immune-dependent effects. Moreover, VDAC2-deficient tumours were markedly sensitized to OT-I-mediated therapeutic effects in an ACT model (Fig. 1e and Extended Data Fig. 1h). Together, these results indicate that VDAC2 targeting sensitizes tumour cells to CD8+ T cell-mediated killing in vitro and in vivo.

a, Schematic for CRISPR screening in B16-OVA tumour cells. Created in BioRender. Sun, R. (2025) https://BioRender.com/g06b183. b, The top depleted genes in tumour cells from C57BL/6 + OT-I cell versus Rag1−/− condition. RRA, robust rank aggregation. c, The overlap between the top 100-ranked gene candidates from CRISPR screens. d, Control or VDAC2-deficient tumour cell viability after co-culture with OT-I cells. n = 3 per group. E:T, effector:target ratio. e, Control or VDAC2-deficient B16-OVA tumour growth without or with (indicated by arrow) adoptive transfer of activated OT-I cells. f, Control and VDAC2-deficient B16-OVA tumour growth after the indicated treatments. Arrow indicates tumour rechallenge of sgVdac2 and anti-PD-L1 group (left). Right, the survival of mice after primary tumour challenge. g, Control and VDAC2-deficient MC38 tumour growth after the indicated treatments. Arrow indicates tumour rechallenge of sgVdac2 and anti-PD-1 group (left). Right, the survival of mice after primary tumour challenge. h, Indicated sgRNA-transduced B16-OVA tumour growth after the indicated treatments. i,j, Liver tumour burden (i) and histological analyses (j) at day 25. n = 4 (sgNTC) and n = 8 (sgVdac2). Scale bars, 1 cm (i), 500 μm (j, left) and 100 μm (j; high-magnification inset, right). k, Control or VDAC2-deficient LoVo tumour cell viability after co-culture with B7-H3-CAR T cells. n = 3 per group. l,m, Control or VDAC2-deficient B16-OVA (l, n = 2 per group) or LoVo (m, n = 3 per group) tumour cell death after IFNγ treatment. Data are mean ± s.e.m., representative of three (f, i, j and m), two (d, e, g, k and l) or one (h) independent experiments. Statistical analysis was performed using two-tailed unpaired Student’s t-tests (d, i and k), two-way analysis of variance (ANOVA) (e; f and g (tumour size); h and m) and Mantel−Cox tests (f and g (survival)); NS, not significant; *P < 0.05; **P < 0.01; ***P < 0.001.
Source Data
We next tested whether VDAC2 deficiency influences ICB efficacy. VDAC2 deficiency in tumours greatly improved responsiveness to anti-PD-L1 and anti-PD-1 in B16-OVA and MC38 tumour models, respectively (Fig. 1f,g), and tumour-free mice after ICB therapy were protected against tumour rechallenge (Fig. 1f,g), indicating robust induction of long-term immune memory. In a metastatic tumour model, VDAC2 loss reduced the lung tumour burden and extended mouse survival in an adaptive-immune-dependent manner (Extended Data Fig. 1i–l). Given that unresponsiveness to tumour necrosis factor (TNF) represents a major therapeutic barrier to ICB20, we generated B16-OVA tumour cells lacking both VDAC2 and TNF receptor (TNFR; encoded by Tnfrsf1a) to test whether VDAC2 targeting overcomes ICB resistance in TNF-unresponsive tumours. Although TNFR-deficient tumours were resistant to OT-I-cell- or IFNγ- and TNF-induced killing21, Vdac2 co-deletion improved their responsiveness to these treatments (Extended Data Fig. 1m,n). Furthermore, Vdac2 co-deletion also sensitized TNFR-deficient tumours to anti-PD-L1 ICB therapy (Fig. 1h and Extended Data Fig. 1o), indicating that VDAC2 loss enhances the therapeutic potential of ICB-resistant tumours. Finally, we targeted VDAC2 in a well-established genetic model of constitutively active AKT and NRAS-driven liver cancer. The liver tumour burden was decreased and mouse survival was extended after VDAC2 targeting (Fig. 1i,j and Extended Data Fig. 1p). Such effects were not observed in Rag1−/− mice (Extended Data Fig. 1p–r), suggesting that Vdac2 deletion also conferred adaptive-immune-dependent protection in this genetic model. Thus, VDAC2 deficiency impedes tumour growth and improves anti-tumour and immunotherapeutic effects in multiple tumour models in vivo.
To expand the physiological and therapeutic relevance, we examined the dependency of human cancer cells for VDAC2 using the Cancer DepMap. VDAC2 perturbation impaired the fitness of a small subgroup of human tumour cell lines (Extended Data Fig. 1s), suggesting that VDAC2 is not a common essential gene for tumour fitness. By contrast, VDAC2 deletion in a patient-derived melanoma cell line modestly sensitized those cells to tumour-infiltrating lymphocyte (TIL) therapy in vitro22 (Extended Data Fig. 1t). Consistent with this notion, VDAC2-deficient LoVo tumour cells (a human colon cancer cell line that expresses the B7-H3 antigen) were more sensitive to B7-H3 chimeric antigen receptor (CAR)-T cell-mediated killing in vitro (Fig. 1k and Extended Data Fig. 1u). Collectively, targeting VDAC2 in tumour cells represents a powerful means to overcome immune evasion and bolster cancer immunotherapy.
VDAC2 loss enables tumour killing by IFNγ
To determine the mechanisms underlying improved CD8+ T cell-mediated killing of VDAC2-deficient tumour cells, we generated perforin-, IFNγ- or TNF-deficient OT-I cells and cultured them with control or VDAC2-deficient B16-OVA tumour cells. Loss of IFNγ but not perforin or TNF prevented OT-I-cell-mediated killing of VDAC2-deficient tumours (Extended Data Fig. 2a). Similar impairment occurred after IFNγ blockade (Extended Data Fig. 2b). Consistent with this notion, co-deletion of Ifngr1, Ifngr2 or Jak1 in VDAC2-deficient B16-OVA cells blocked their increased susceptibility to OT-I-cell-mediated killing (Extended Data Fig. 2c). Thus, IFNγ enables increased CD8+ T cell-mediated killing of VDAC2-deficient tumour cells in vitro.
We therefore tested whether VDAC2 deficiency renders tumour cells more sensitive to IFNγ. Whereas control cells were not susceptible to IFNγ-induced cell death, VDAC2-deficient B16-OVA cells showed markedly increased cell death and lactate dehydrogenase (LDH) release after IFNγ (but not TNF) stimulation (Fig. 1l and Extended Data Fig. 2d,e). To validate the cell-intrinsic effects, we used a dual-colour co-culture system (Methods) and found that IFNγ but not TNF treatment impaired the survival of VDAC2-deficient B16-OVA cells compared with the control cells (Extended Data Fig. 2f), indicating that IFNγ mediates the increased death of VDAC2-deficient tumour cells. Mechanistically, VDAC2 deficiency did not affect canonical IFNγ–STAT1 signalling (Extended Data Fig. 2g). Instead, we found increased cleavage of caspase-3, caspase-7 and gasdermin E (GSDME) in VDAC2-deficient cells after IFNγ stimulation (Extended Data Fig. 2g). Such effects on GSDME cleavage were dependent on caspase-3 or caspase-9 (Extended Data Fig. 2h), suggesting activation of secondary necrosis mediated by caspase-3 and GSDME23,24,25 in the absence of VDAC2.
To assess the requirement of specific caspases or GSDME in mediating cell death in response to IFNγ treatment, we generated VDAC2-deficient tumours cells lacking caspase-3, caspase-7 or GSDME (Extended Data Fig. 2i). Individual targeting of these molecules showed partial effects in mitigating the increased IFNγ-induced death of VDAC2-deficient cells (Extended Data Fig. 2j,k). Similarly, treatment with the pan-caspase inhibitor emricasan reduced IFNγ-induced cell death of VDAC2-deficient tumour cells, while inhibition of ferroptosis (using ferrostatin-1), necroptosis (using necrostatin-1) and GSDMD-mediated pyroptosis (with disulfiram) had no such effects (Extended Data Fig. 2l). Moreover, there was increased staining of activated caspase-3 and elevated cleavage of caspase-3, caspase-7 and GSDME in VDAC2-deficient tumours, especially in response to anti-PD-L1 treatment, which promoted IFNγ production in the TME (Extended Data Fig. 2m–o). Collectively, VDAC2 loss drives IFNγ-mediated tumour cell death, mediated by apoptosis and secondary necrosis, in vitro and in vivo.
We next analysed the expression of VDAC family members in tumour cells and immune cells from syngeneic mouse tumour (Gene Expression Omnibus (GEO): GSE121861), human melanoma (GEO: GSE215121) and human lung cancer (GEO: GSE148071), and found higher expression in mouse and human tumour cells compared with in various immune cells (Extended Data Fig. 2p,q). However, only tumour cells deficient in VDAC2 but not VDAC1 or VDAC3 showed elevated IFNγ-induced cell death (Extended Data Fig. 2r), indicating the selectivity for VDAC2 deficiency. In human LoVo tumour cells, VDAC2 deficiency also increased IFNγ-induced cell death (Fig. 1m), suggesting conserved effects in mouse and human tumour cell lines.
PTPN2 targeting improves the immunotherapeutic response by enhancing IFNγ signalling7. B16-OVA tumour cells lacking VDAC2 or PTPN2 showed comparable sensitivity to CD8+ T cell-mediated killing (Extended Data Fig. 3a), whereas VDAC2-deficient cells showed greater sensitivity to IFNγ-induced cell death (Extended Data Fig. 3b). Moreover, targeting of VDAC2 or PTPN2 in tumour cells showed a similar therapeutic benefit in vivo (Extended Data Fig. 3c). Importantly, Vdac2 and Ptpn2 co-deletion further enhanced IFNγ-induced death of VDAC2-deficient tumour cells and impaired their in vivo growth compared with loss of either molecule alone (Extended Data Fig. 3d–f), suggesting that VDAC2 and PTPN2 represent molecular targets for combination therapy.
Loss of VDAC2 inflames the TME
To unbiasedly profile the tumour immune microenvironment, we performed paired single-cell RNA-sequencing (scRNA-seq) with single-cell T cell receptor sequencing (scTCR-seq) analysis of intratumoural immune cells (CD45+) and tumour cells (CD45–) from control and VDAC2-deficient B16-OVA tumour-bearing mice. Unsupervised manifold approximation and projection (UMAP) clustering of intratumoural CD45+ cells identified several major immune cell populations (Fig. 2a). Among them, the CD8+ T cell proportion was increased in VDAC2-deficient tumours (Fig. 2b). Flow cytometry analysis validated the increased proportion and number of CD8+ T cells, as well as the increased cellularity of intratumoural CD45+ cells and CD4+ T cells (Fig. 2c,d and Extended Data Fig. 4a). Furthermore, the ratio of CD8+ T cells to regulatory T (Treg) cells was increased in VDAC2-deficient tumours (Fig. 2e), consistent with improved anti-tumour effects. Moreover, CD8+ T cells had markedly increased clonal expansion in VDAC2-deficient tumours (Fig. 2f). Furthermore, CD8+ T cells from VDAC2-deficient tumours showed increased activity scores of gene signatures related to early activation and effector/cytokine production (Fig. 2g) and augmented expression of Ifng and Prf1 (Extended Data Fig. 4b), indicating enhanced effector function. Accordingly, there was an increased number of IFNγ+TNF+ or granzyme B+ (GZMB+) cells among intratumoural CD8+ T cells, and expression of IFNγ, TNF and IL-2 was also elevated in intratumoural CD8+ T cells (Fig. 2h,i and Extended Data Fig. 4c), suggesting improved quality of CD8+ T cell effector function in the TME.
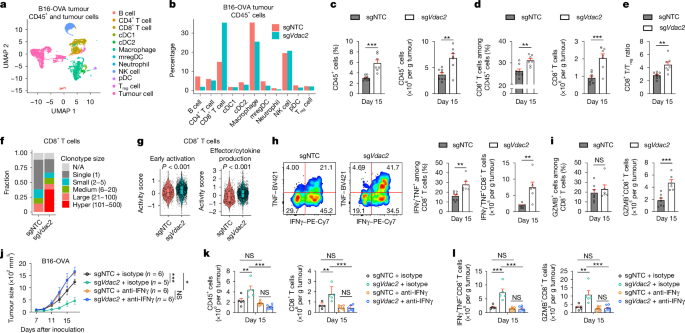
a, UMAP plot of the indicated cell clusters from scRNA-seq profiling of control and VDAC2-deficient tumours. n = 2 biological replicates per group. cDC, conventional dendritic cell; mregDC, mature dendritic cell enriched in immunoregulatory molecules; pDC, plasmacytoid dendritic cell. b, The frequencies of the indicated intratumoural immune cell populations among CD45+ cells in each genotype. c–e, CD45+ cells (c), CD8+ T cells (d) and the ratio of CD8+ T cells to Treg cells (e) in control (n = 8) and VDAC2-deficient (n = 7) B16-OVA tumours. f, The frequencies of CD8+ T cells grouped by clonotype sizes, as assessed by scTCR-seq. N/A, TCR type not detected. g, Activity scores of early activation and effector/cytokine production-related gene signatures in intratumoural CD8+ T cells from control (n = 710 cells) and VDAC2-deficient (n = 2,295 cells) B16-OVA tumours. The box plots show the median (centre line) and the interquartile range (25% to 75%; box limits). h,i, IFNγ+TNF+ (h) and GZMB+ (i) CD8+ T cells from B16-OVA tumours. n = 7 (sgNTC) and n = 6 (sgVdac2). j, Control and VDAC2-deficient tumour growth after the indicated treatments. k,l, CD45+ cells (k, left) and CD8+ T cells (k, right) or IFNγ+TNF+ (l, left) and GZMB+ (l, right) CD8+ T cells from the indicated B16-OVA tumours. n = 5 (sgNTC + isotype and sgVdac2 + isotype) and n = 7 (sgNTC + anti-IFNγ and sgVdac2 + anti-IFNγ). Data are mean ± s.e.m., representative of three (c–e, h and i) or two (j–l) independent experiments. Statistical analysis was performed using two-tailed unpaired Student’s t-tests (c–e, h and i), one-way ANOVA (k and l), two-way ANOVA (j) and two-tailed Wilcoxon rank-sum tests (g).
Source Data
Additionally, stem-like and terminally differentiated CD8+ T cells showed reduced and increased frequencies in the VDAC2-deficient TME, respectively (Extended Data Fig. 4d–f). Notably, terminally differentiated CD8+ T cells retained high expression of Prf1, Ifng and Gzmb (Extended Data Fig. 4e), suggesting that these cells were not fully exhausted. Moreover, the effector-like CD8+ T cell population26,27,28,29 was increased in VDAC2-deficient tumours (Extended Data Fig. 4f), consistent with their more activated state (Fig. 2g). For further mechanistic insights, we performed assay for transposase-accessible chromatin using sequencing (ATAC–seq) analysis of PD-1– and PD-1+CD8+ T cells from control and VDAC2-deficient tumours. Both PD-1– and PD-1+CD8+ T cells (largely representing non-clonally expanded and clonally expanded cells, respectively; Extended Data Fig. 4d,e) from VDAC2-deficient tumours had increased chromatin accessibility of T cell-activation-associated genes including Batf, Ifng and Prkcb (Extended Data Fig. 4g, Supplementary Table 3). Accordingly, the frequency of effector-like PD-1+Ki67+CD8+ T cells29 was increased in VDAC2-deficient tumours (Extended Data Fig. 4h), further establishing increased effector function.
Chronic IFNγ stimulation increases the expression of ligands for T cell inhibitory receptors (TCIRs) such as PD-L1 and TNFRSF1430. We therefore inoculated wild-type mice with control or VDAC2-deficient B16-OVA tumour cells and analysed the expression of TCIR ligands30 (Extended Data Fig. 4i). VDAC2 deficiency did not exert major or consistent effects on TCIR ligands at days 15 and 21 after primary tumour inoculation, except for a modest increase in CD86 expression (Extended Data Fig. 4j). We next isolated control or VDAC2-deficient tumour cells on day 21 after primary tumour challenge, and reinoculated these cells into naive recipient mice (Extended Data Fig. 4i). On day 15 after transplantation into new recipients, TCIR ligands were also not upregulated (Extended Data Fig. 4k). Thus, TCIR ligand expression is not increased after long-term loss of VDAC2.
Beyond B16-OVA tumours, MC38-OVA tumours lacking VDAC2 had reduced tumour growth and altered immune cell compositions (Extended Data Fig. 4l–q). Notably, the effects of Vdac2 deletion in tumour cells on intratumoural CD8+ T cells were similar to those induced by anti-PD-1 treatment in B16-OVA31 and MC3832 tumours (Extended Data Fig. 4r,s), suggesting that VDAC2 deficiency in tumour cells reprograms CD8+ T cell activity, potentially through pathways that overlap with PD-1 blockade. Thus, VDAC2 deficiency reshapes the tumour immune compartment, with a particular effect on intratumoural CD8+ T cells.
To establish translational relevance, we examined the correlation between VDAC2 expression and inflammatory signatures or T cell-related genes in human tumour types (Methods), and found that 9 out of 33 tumour types showed a negative correlation (P ≤ 0.05) between VDAC2 expression and a tumour inflammation signature (Extended Data Fig. 4t). Moreover, VDAC2 expression was often negatively correlated (P ≤ 0.05) with CCL5 (13 out of 33 tumour types) or CD3D expression (18 out of 33 tumour types) (Extended Data Fig. 4t). Accordingly, melanoma and non-small cell lung cancer with high VDAC2 expression had reduced CD8+ and CD4+ T cell fractions (Extended Data Fig. 4u,v), suggesting that VDAC2 expression negatively correlates with inflammatory- and T cell-related signatures and T cell infiltration in human tumours. Finally, high expression of a curated VDAC2-suppressed gene signature was associated with improved overall survival in patients with melanoma, including those treated with anti-PD-1 antibody (Extended Data Fig. 4w,x and Supplementary Table 4). Thus, an increase in VDAC2-suppressed gene signature corresponds to improved disease outcomes and response to ICB in patients with melanoma.
VDAC2 loss improves anti-tumour immunity
To examine the contribution of IFNγ to VDAC2-deficiency-associated effects, we treated VDAC2-deficient B16-OVA tumour-bearing mice with anti-IFNγ, which enhanced tumour growth to levels comparable to those observed in anti-IFNγ-treated control tumours (Fig. 2j). Blocking IFNγ also reduced intratumoural CD45+ immune cells and the abundance and effector function of CD8+ T cells in VDAC2-deficient tumours (Fig. 2k,l). We next treated mice transiently with anti-IFNγ at early or late time periods after tumour inoculation (Methods) and found that both treatment regimens eliminated the beneficial effects of Vdac2 deletion (Extended Data Fig. 5a,b). Thus, IFNγ reshapes the tumour immune microenvironment of VDAC2-deficient tumours.
To determine the cellular sources of IFNγ, we compared Ifng expression in different immune cell populations and found high expression of Ifng in CD8+ T cells and, to a lesser extent, natural killer (NK) cells, in both control and VDAC2-deficient B16-OVA tumours (Extended Data Fig. 5c). Given the pronounced accumulation of CD8+ T cells in VDAC2-deficient tumours, we then depleted CD8+ T cells. We found that VDAC2-deficient tumour growth was increased (Extended Data Fig. 5d,e), suggesting the importance of CD8+ T cells in mediating VDAC2 deficiency-associated effects. To test whether CD8+ T cell-derived IFNγ contributes to these effects, we generated Cd8creIfngfl/fl chimeras to deplete Ifng specifically in CD8+ T cells (Methods) (Extended Data Fig. 5f). Compared with control tumours, VDAC2-deficient tumours had the expected reduction in tumour growth and enhanced mouse survival in wild-type chimeras, whereas VDAC2-deficient tumours and control tumours had comparable growth in Cd8creIfngfl/fl chimeras (Extended Data Fig. 5g). Collectively, these results indicate that intratumoural IFNγ derived from CD8+ T cells has a major role in mediating the impaired growth of VDAC2-deficient tumours.
VDAC2 impedes IFNγ-induced STING signalling
To determine the mechanistic basis, we first analysed the transcriptome profiles of control and VDAC2-deficient tumour cells in the scRNA-seq dataset. Gene set enrichment analysis (GSEA) showed that VDAC2-deficient tumour cells had increased IFNα- and IFNγ-related gene signatures (Fig. 3a). Furthermore, GSEA of tumour cells treated with IFNγ or OT-I cells revealed increased IFNγ and IFNα response signatures in VDAC2-deficient versus control tumour cells, with such signatures representing the only shared Hallmark pathways upregulated in the absence of VDAC2 under conditions of immune pressure (Extended Data Fig. 6a–c and Supplementary Table 5). Accordingly, multiple genes in the IFN-responsive pathways were upregulated in VDAC2-deficient tumours treated with IFNγ or OT-I cells (Fig. 3b,c and Extended Data Fig. 6d). Furthermore, Ifnb1 and Ccl5, which are induced by cGAS–STING33, were increased in IFNγ-treated VDAC2-deficient tumour cells, with elevated IFNβ protein levels also detected after IFNγ treatment in vitro or in tumour lysates in vivo (Fig. 3d–f and Extended Data Fig. 6e). Thus, IFNγ stimulation aberrantly upregulates the type I IFN response in VDAC2-deficient tumour cells.
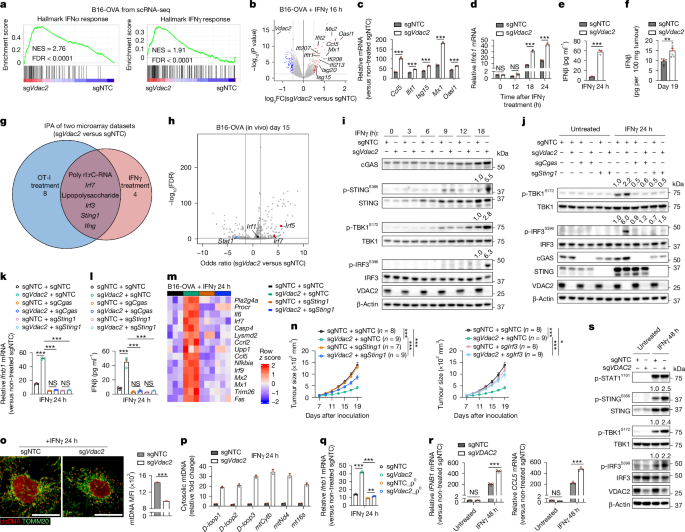
a, Hallmark IFNα and IFNγ response signatures. FDR, false-discovery rate; NES, normalized enrichment score. b, Gene expression profiles in IFNγ-treated B16-OVA tumour cells, with selective upregulated (red) and downregulated (blue) genes labelled. c,d, The relative levels of IFN-responsive genes (c) or Ifnb1 (d) in IFNγ-treated B16-OVA tumour cells. n = 3 per group. e,f, IFNβ levels in culture supernatants from IFNγ-treated B16-OVA tumour cells (e; n = 3 per group) or from tumour lysates after inoculation into wild-type mice (f; n = 6 per group). g, Overlap of activated IPA-predicted upstream regulators from transcriptome profiling of OT-I- or IFNγ-treated B16-OVA tumour cells. The numbers indicate uniquely activated regulators. h, Motif enrichment analysis of differentially accessible chromatin profiled by ATAC–seq (n = 4 per group), with selective upregulated (red) and downregulated (blue) motifs labelled and black-labelled genes being unaltered. i,j, Immunoblot analysis of B16-OVA tumour cells after IFNγ treatment, with densiometric quantification of phosphorylated STING (p-STING), p-TBK1 or p-IRF3 shown (i), and p-TBK1 or p-IRF3 shown (j). k,l, The relative levels of Ifnb1 in indicated cells (k; n = 3 per group) and IFNβ in culture supernatants of indicated cells (l; n = 3 per group). m, The relative expression of IFN-responsive genes repressed by VDAC2 in the indicated IFNγ-treated B16-OVA tumour cells. n = 3 per group. n, The growth of B16-OVA tumours. The same sgNTC and sgVdac2 groups are shown on the left and right. o, dsDNA and TOMM20 co-localization in IFNγ-treated B16-OVA tumour cells. n = 4,525 (sgNTC) and 5,948 (sgVdac2). Scale bar, 20 μm. MFI, mean fluorescence intensity. p, Relative cytosolic mtDNA levels (versus non-treated control cells) in IFNγ-treated B16-OVA tumour cells. n = 2 per group. q, Relative Ifnb1 levels in IFNγ-treated B16-OVA tumour cells that lack (ρ0 cells) or contain mtDNA (n = 3 per group). r, The relative IFNB1 and CCL5 levels in IFNγ-treated LoVo tumour cells. n = 3 per group. s, Immunoblot analysis of LoVo tumour cells before and after IFNγ treatment, with densiometric quantification of p-STING, p-TBK1 or p-IRF3 shown. Data are mean ± s.e.m., representative of three (c, d, i, k and l), two (e, j and o–s) or one (f and n) independent experiments. Statistical analysis was performed using two-tailed unpaired Student’s t-tests (c–f and o), one-way ANOVA (k, l and q), two-way ANOVA (n and r) and two-tailed Fisher’s exact test (h).
Source Data
Furthermore, Ingenuity pathway analysis (IPA) revealed upregulated activities of STING, IRF3 and IRF7 in VDAC2-deficient tumour cells after IFNγ or OT-I cell treatment (Fig. 3g and Supplementary Table 6). ATAC–seq profiling of VDAC2-deficient versus control tumour cells, followed by motif enrichment analysis of differentially accessible chromatin, revealed that IRF5 and IRF7 (albeit not IRF1) activities were increased in VDAC2-deficient tumour cells (Fig. 3h), indicating enhanced type I IFN-related responses in VDAC2-deficient tumour cells in vitro and in vivo. On the basis of these findings, we examined STING expression and activation, and found that STING expression was upregulated in both control and VDAC2-deficient tumour cells after IFNγ treatment (Fig. 3i and Extended Data Fig. 6f). By contrast, compared with control tumours, the levels of phosphorylated STING (Ser365), TBK1 (Ser172) and IRF3 (Ser396) were increased in VDAC2-deficient tumour cells at ≥12 h of IFNγ stimulation (Fig. 3i and Extended Data Fig. 6f). Thus, VDAC2 restrains IFNγ-induced STING activation.
We next co-targeted cGAS or STING in VDAC2-deficient tumour cells to establish functional effects and found that their targeting largely blocked the capacity of VDAC2-deficient tumour cells to increase TBK1 or IRF3 phosphorylation or IFNβ expression after IFNγ stimulation (Fig. 3j–l). Co-deletion of Irf3 (albeit not Mavs, which induces STING-independent type I IFN response34) also rectified such aberrant IFNβ expression (Extended Data Fig. 6g,h). In transcriptome profiling, STING co-deletion largely reversed the increased expression of IFN-response genes induced by VDAC2 deficiency (Fig. 3m). By contrast, co-deletion of Cgas, Sting1 or Irf3 did not mitigate the excessive cell death of IFNγ-stimulated VDAC2-deficient tumour cells (Extended Data Fig. 6i), suggesting that the effects of STING signalling were specific in mediating the increased type I IFN response, albeit not the cell death phenotypes, induced by Vdac2 deletion. Likewise, IFNγ-induced cell death of VDAC2-deficient cells was unaltered after IFNαR1 blockade (Extended Data Fig. 6j). Upon in vivo tumour challenge, Sting1 or Irf3 co-deletion also partly blocked the therapeutic benefits of Vdac2 deletion on tumour growth and mouse survival (Fig. 3n and Extended Data Fig. 6k). Together, these results reveal an interplay between IFNγ signalling, VDAC2 and STING activation that dictates type I IFN response and tumour growth.
Ccl5 expression was among the top-most upregulated genes in VDAC2-deficient tumour cells treated with IFNγ or OT-I cells (Fig. 3b and Extended Data Fig. 6d). This increased Ccl5 expression was rectified after co-deletion of Cgas, Sting1 or Irf3 (albeit not Mavs) and was validated to occur after co-culture with OT-I cells in vitro (Extended Data Fig. 6l–o). Furthermore, VDAC2-deficient tumour cells expressed higher levels of Ccl5 in vivo, whereas intratumoural CD8+ T cells from such tumours expressed higher levels of Ccr5 (Extended Data Fig. 6p,q). These results prompted us to test whether CCL5 contributes to the reshaping of the tumour immune landscape after Vdac2 deletion. Ccl5 co-deletion impeded the increased accumulation of CD8+ T cells, including those expressing IFNγ and TNF or GZMB, in the VDAC2-deficient TME (Extended Data Fig. 6r). Thus, CCL5 contributes to the robust accumulation of effector CD8+ T cells in VDAC2-deficient tumours.
Cytosolic mitochondrial DNA (mtDNA) release triggers STING activation35. As VDAC2 is a mitochondrial protein (Extended Data Fig. 6s), we hypothesized that cytosolic mtDNA release may occur in IFNγ-treated VDAC2-deficient tumour cells. Indeed, immunostaining revealed a decreased abundance of mitochondrially localized double-stranded DNA in VDAC2-deficient tumour cells after IFNγ treatment (Fig. 3o and Extended Data Fig. 6t). Furthermore, VDAC2-deficient tumour cells showed increased abundance of cytosolic mtDNA (Fig. 3p and Extended Data Fig. 6u). We next generated control and VDAC2-deficient tumour cells lacking mtDNA (ρ0 cells; Methods) and found that mtDNA depletion in IFNγ-stimulated VDAC2-deficient tumour cells rectified the increased levels of phosphorylated TBK1, IFNβ and Ccl5 (Fig. 3q and Extended Data Fig. 6v–y). Likewise, VDAC2-deficient human LoVo cells had increased inflammatory gene expression and STING activation (Fig. 3r,s, Extended Data Fig. 6z and Supplementary Table 7), thereby establishing that VDAC2 restrains IFNγ-induced STING activation in human tumour cells. Together, aberrant cytosolic mtDNA drives cGAS–STING signalling and type I IFN response in IFNγ-stimulated VDAC2-deficient cells.
VDAC2–BAK axis tunes tumour remodelling
To unbiasedly identify functional genetic interactions for enhanced susceptibility to IFNγ-induced cell death, we performed a genetic interaction screen by co-transducing VDAC2-deficient B16-OVA-Cas9 tumour cells with a genome-scale sgRNA library and, after IFNγ treatment, assessed sgRNA enrichment or depletion among the viable VDAC2-deficient tumour cells to nominate genetic interactions that either alleviate or synergize with VDAC2 deficiency-driven effects on tumour cell death (Fig. 4a). Targeting Ptpn2 potentiated, and depleting IFNγ signalling-associated genes (Ifngr1, Ifngr2, Jak1, Jak2 and Stat1) alleviated, VDAC2 deficiency-mediated cell death after IFNγ treatment (Extended Data Fig. 7a and Supplementary Table 8a,b). Next, we overlaid these genetic interaction screen hits with the MitoCarta 3.0 database, which contains all annotated mitochondria-associated genes36. We found that targeting Casp9 and Bak1 (encoding BAK) had the most substantial effects on alleviating VDAC2-deficiency-mediated tumour cell death (Fig. 4b and Supplementary Table 8c). BAK and/or the closely related protein BAX orchestrate mitochondria-dependent cell death by promoting mitochondrial outer membrane permeabilization (MOMP), cytochrome c release and initiation of APAF-1- and caspase-9-dependent cell death25. We found that co-deletion of Bak1, but not Bax, blocked IFNγ-induced cell death and LDH release of VDAC2-deficient tumour cells (Extended Data Fig. 7b,c). Furthermore, in the absence of IFNγ treatment, overexpression of Bak1, but not Bax, promoted cell death of VDAC2-deficient tumour cells (Extended Data Fig. 7d), further supporting an interplay between VDAC2 and BAK in orchestrating tumour cell death.
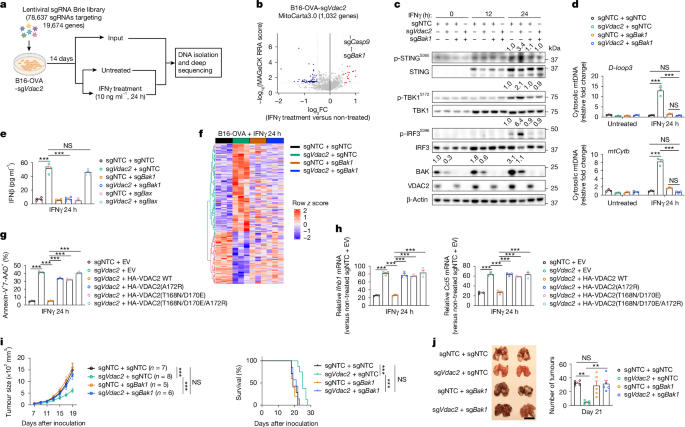
a, Schematic of the secondary genome-scale CRISPR screen. Created in BioRender. Sun, R. (2025) https://BioRender.com/g06b183. b, Enriched (red) and depleted (blue) sgRNAs targeting mitochondria-associated genes in IFNγ-treated versus non-treated VDAC2-deficient B16-OVA tumour cells. c, Immunoblot analysis of the indicated sgRNA-transduced B16-OVA tumour cells after IFNγ treatment for indicated times; densiometric quantification of p-STING, p-TBK1, p-IRF3 or total BAK is shown. d, The relative cytosolic mtDNA levels (versus non-treated control cells) in the indicated B16-OVA tumour cells treated with or without IFNγ. n = 3 per group. e, IFNβ levels in the culture supernatants from the indicated B16-OVA tumour cells after IFNγ treatment. n = 4 per group. f, The relative gene expression in the indicated B16-OVA tumour cells after IFNγ treatment. n = 3 per group. g, Cell death of the indicated B16-OVA tumour cells treated with IFNγ. n = 3 per group. EV, empty vector. h, Relative Ifnb1 and Ccl5 levels (versus non-treated control cells) in the indicated B16-OVA tumour cells treated with IFNγ. n = 3 per group. i, Control, VDAC2-deficient, BAK-deficient, or VDAC2 and BAK co-deficient B16-OVA tumour growth (left) and survival of tumour-bearing mice (right). j, Lung tumour burden in mice that received intravenous injection of the indicated B16-OVA tumour cells. n = 5 per group. Scale bar, 1 cm. Data are mean ± s.e.m., representative of three (c and i), two (d, e, g and h) or one (j) independent experiments. Statistical analysis was performed using one-way ANOVA (d, e, g, h and j), two-way ANOVA (i (tumour size)) and Mantel−Cox test (i (survival)).
Source Data
Next, we examined STING activation in cells lacking VDAC2 and BAK and found that Bak1 co-deletion blocked the increased phosphorylation of STING, TBK1 and IRF3 in IFNγ-stimulated VDAC2-deficient cells (Fig. 4c). Furthermore, co-deletion of Bak1 (but not Bax) rectified the increased mtDNA release and expression of IFNβ and IFN-responsive genes (Fig. 4d,e and Extended Data Fig. 7e,f). Global transcriptome alterations induced by VDAC2 deficiency were also substantially mitigated by BAK co-deletion (Fig. 4f and Extended Data Fig. 7g). Collectively, Vdac2 deletion acts through BAK to mediate mtDNA release, STING activation and inflammatory reprogramming.
Mechanistically, VDAC2 interacted with BAK but not BAX in B16-OVA tumour cells, consistent with previous findings37 (Extended Data Fig. 7h). To determine whether VDAC2 affects BAK or BAX activity, we measured BAK or BAX oligomer formation38 in mitochondrial fractions of IFNγ-treated control and VDAC2-deficient cells, which revealed increased BAK but not BAX dimer and trimer formation in VDAC2-deficient cells, especially after IFNγ treatment (Extended Data Fig. 7i). Thus, there was aberrant activation of BAK in IFNγ-treated VDAC2-deficient cells, which occurred despite a reduction in total BAK protein abundance (Fig. 4c). Accordingly, downstream events of BAK activation, including MOMP39 and cytosolic release of cytochrome c and SMAC, were increased in VDAC2-deficient tumour cells after IFNγ treatment (Extended Data Fig. 7j,k). Thus, VDAC2 interacts with and suppresses BAK in tumour cells, and IFNγ-stimulated BAK activity is unleashed after Vdac2 deletion.
To establish the functional importance of the VDAC2–BAK interaction, we generated a wild-type VDAC2 construct or three types of VDAC2 mutants impairing the VDAC2–BAK interaction40,41. The interactions between these mutant proteins with BAK were substantially reduced compared with wild-type VDAC2 (Extended Data Fig. 7l). Moreover, only wild-type, but not mutant, VDAC2 largely rectified the phenotypes of VDAC2-deficient cells, including enhanced IFNγ-induced cell death and type I IFN responses (Fig. 4g,h and Extended Data Fig. 7m), thereby establishing the functional importance of the VDAC2–BAK interaction to VDAC2-mediated effects in response to IFNγ.
We next compared the functional effects of VDAC2 with MCL-1 and BCL-2, which are known to inhibit BAK25,42. At 24 h of IFNγ treatment, in contrast to VDAC2-deficient cells, MCL-1- or BCL-2-deficient cells showed slightly increased or negligible cell death, respectively (Extended Data Fig. 7n,o), and no major changes in type I IFN responses (Extended Data Fig. 7n,p). Nonetheless, after extended (48 h) IFNγ treatment, MCL-1-deficient cells and, to a lesser extent, BCL-2-deficient cells, showed increased cell death (albeit less pronounced than VDAC2-deficient cells) (Extended Data Fig. 7o) and Ifnb1 and/or Ccl5 expression (Extended Data Fig. 7p). Furthermore, only VDAC2-deficient cells displayed increased BAK activation at 24 h after IFNγ treatment, while both VDAC2- and MCL-1-deficient cells showed enhanced BAK activation at 48 h (Extended Data Fig. 7q). Compared with the pronounced effects of Vdac2 deletion, loss of MCL-1 or BCL-2 modestly sensitized tumour cells to OT-I-cell-mediated killing (Extended Data Fig. 7r). Thus, VDAC2-deficient B16-OVA cells are more sensitive than MCL-1- and BCL-2-deficient cells to these IFNγ-induced effects of cell death and inflammation.
To mechanistically understand how VDAC2 deficiency unleashes the sensitivity to IFNγ-induced mitochondrial apoptosis, we examined the gene expression of BCL-2-family members in control and VDAC2-deficient B16-OVA tumour cells treated with IFNγ. IFNγ stimulation increased expression of Bcl2l11 (encoding BIM) and Bid, along with their downstream target Bak1, with such observations also evident at the protein levels (Extended Data Fig. 8a,b). By contrast, except for BIM, these proteins were not upregulated by anti-cancer apoptosis inducers such as cisplatin and etoposide, which instead promoted expression of PUMA and p53 (Extended Data Fig. 8c). Mechanistically, BID and BAK expression was decreased in STAT1- or IRF1-deficient cells, whereas BIM and STING expression was reduced in STAT1-deficient cells (Extended Data Fig. 8d,e). Furthermore, the protein levels of BIM and BAK (but not BID) (Extended Data Fig. 8f), as well as STING (Fig. 3s), were increased in IFNγ-stimulated human LoVo tumour cells, suggesting conserved effects between human and mouse tumour cells.
To determine the functional contributions of STAT1 and IRF1 signalling, we co-deleted Stat1 or Irf1 in VDAC2-deficient tumour cells. Co-deletion of Stat1 or Irf1 completely or partially rectified the IFNγ-induced cell death and type I IFN phenotypes of VDAC2-deficient cells, respectively (Extended Data Fig. 8g,h). Thus, STAT1 and, to a lesser extent, IRF1 contribute to the increased sensitivity of VDAC2-deficient cells to IFNγ-induced cell death and inflammatory remodelling. We next co-deleted Bcl2l11 and Bid in VDAC2-deficient tumour cells, which largely rescued IFNγ-induced cell death or CD8+ T cell-mediated killing (Extended Data Fig. 8i,j). Accordingly, compared with VDAC2-deficient tumour cells, VDAC2-deficient tumour cells lacking BIM and BID had reduced BAK oligomerization (Extended Data Fig. 8k) and cytochrome c or mtDNA release, as well as decreased STING activation and inflammatory gene expression after IFNγ treatment (Extended Data Fig. 8l–p). Together, IFNγ sensitizes tumour cells by upregulating expression of BIM, BID and BAK, with VDAC2 loss triggering BAK activation and subsequent cell death and cGAS–STING activation.
Our genetic interaction CRISPR screen and validation experiments also revealed that co-deletion of pro-apoptotic APAF-1 or caspase-925 rescued the increased cell death and LDH release of IFNγ–stimulated VDAC2-deficient tumour cells (Extended Data Figs. 7a and 9a–c). Similarly, pan-caspase inhibitor treatment led to a greater than 90% reduction in IFNγ-induced cell death in VDAC2-deficient cells (Extended Data Fig. 9d). Notably, inhibition of apoptosis through pharmacological or genetic approaches only delayed cell death of VDAC2-deficient tumour cells, as extensive cell death was still observed after 72 h of IFNγ stimulation (Extended Data Fig. 9e–g). Furthermore, co-deletion of Apaf1 or Casp9 in VDAC2-deficient tumour cells led to further enhanced IFNγ-induced STING signalling and expression of downstream inflammatory genes (Extended Data Fig. 9h–k), in contrast to Bak1 co-deletion, which blocked both the increased cell death and cGAS–STING activation. Similar effects were observed in VDAC2-deficient cells with Casp3 or Casp7 co-deletion and those that were treated with the pan-caspase inhibitor Q-VD-OPh or emricasan (Extended Data Fig. 9l,m), consistent with the notion that apoptotic caspases inhibit the type I IFN response43,44,45,46. Accordingly, GSEA revealed upregulation of the IFNα signature in IFNγ-stimulated VDAC2 and APAF-1 co-deficient tumour cells compared with that in VDAC2-deficient tumour cells (Extended Data Fig. 9n and Supplementary Table 9). Moreover, co-deletion of Apaf1 or Casp9, or treatment with emricasan, further reduced the growth of VDAC2-deficient tumours in vivo, corresponding to increased mouse survival (Extended Data Fig. 9o,p), suggesting that inhibition of apoptosis modestly boosts the therapeutic effects of VDAC2 deficiency. Together, these data reveal that VDAC2 deficiency overrides the inhibitory effects of apoptotic caspases on cGAS–STING activation to enable BAK-dependent caspase and STING activation after IFNγ stimulation.
To establish the physiological relevance of VDAC2–BAK axis in vivo, we challenged wild-type mice with control B16-OVA tumours or those lacking VDAC2 and/or BAK. Bak1 co-deletion reversed the reduced growth of VDAC2-deficient tumours in both subcutaneous (s.c.) and lung metastasis models (Fig. 4i,j). Moreover, Bak1 co-deletion largely blocked the increased accumulation and effector-like features of CD8+ T cells (Extended Data Fig. 9q,r). Bak1 co-deletion also blocked the enhanced therapeutic benefit of combining anti-PD-L1 treatment with VDAC2 deficiency in tumour cells (Extended Data Fig. 9s,t). Thus, the VDAC2–BAK axis tunes anti-tumour and ICB responses in vivo.
To further explore the potential widespread effects of targeting VDAC2, we examined whether VDAC2 limits IFNγ-induced cell death of non-tumorigenic cells. IFNγ stimulation did not cause marked cell death of VDAC2-deficient mouse embryonic fibroblasts (MEFs), in contrast to treatment with etoposide or TNF plus cycloheximide37 (Extended Data Fig. 10a). IFNγ also did not induce substantial cell death of control or VDAC2-deficient OT-I cells in vitro (Extended Data Fig. 10b) and, accordingly, VDAC2-deficient OT-I cells retained potent anti-tumour function in vivo (Extended Data Fig. 10c). Similarly, VDAC2 deficiency did not alter cell death of T helper type 1 (TH1) and in vitro-derived Treg (iTreg) cells (Extended Data Fig. 10d). We also found that only BAK (but not BIM or BID) was upregulated by IFNγ in control and VDAC2-deficient MEFs, whereas BID expression was modestly downregulated in IFNγ-treated OT-I cells (Extended Data Fig. 10e,f). These results suggest that IFNγ stimulation coordinately upregulates BIM, BID and BAK selectively in tumour cells, associated with their increased sensitivity to VDAC2-deficiency-driven cell death.
Finally, tumour cells are in a more primed state compared with normal cells for apoptosis, with such effects associated with their more abundant expression of certain apoptotic molecules42,47. Given that VDAC2-deficient B16-OVA cells but not MEFs are sensitive to IFNγ-induced cell death, we compared the expression of BCL-2-family proteins in these cell types in the absence or presence of IFNγ. Without IFNγ stimulation, B16-OVA tumour cells and MEFs showed comparable BIM, BID, BAK, MCL-1 and BCL-xL expression, while BAX, PUMA and BCL-2 levels were highly expressed in B16-OVA tumour cells (Extended Data Fig. 10g). These results suggest that B16-OVA cells probably exist in a partly primed state for apoptosis compared with MEFs. After IFNγ treatment, BIM, BID and BAK expression was upregulated to considerably higher levels in B16-OVA cells compared with in MEFs (Extended Data Fig. 10g). Thus, IFNγ differentially regulates the expression of BIM, BID and BAK in tumour cells compared with in MEFs, which probably underlies the capacity of IFNγ to selectively sensitize tumour cells to cell death after Vdac2 deletion (Extended Data Fig. 10h).
Discussion
Tumour immune evasion and resistance to T cell-mediated killing represent barriers to effective immune-mediated cancer therapies. Besides directly killing tumour cells, T cells produce cytokines such as IFNγ that remodel the inflammatory status of the TME48. Mechanisms mediating tumour cell responsiveness to IFNγ-mediated cytotoxicity are underexplored. Here we identified Vdac2 as a potent immune evasion gene, and the deletion of Vdac2 induced IFNγ-mediated destruction of tumour cells in vivo. Notably, although IFNγ signalling in tumours cells may favour tumour immune evasion by epigenome remodelling to induce expression of TCIR ligands30, VDAC2-deficient tumour cells showed no such effects. Furthermore, VDAC2 deficiency promoted mitochondrial damage, suggesting that targeting VDAC2 may override the metabolic advantage enabled by IFNγ signalling for immune evasion49. Notably, co-deletion of Vdac2 and Ptpn2 further boosted anti-tumour immunity, probably through combined effects at potentiating IFNγ-induced canonical JAK–STAT signalling7 (through Ptpn2 deletion) together with activating Vdac2-deletion-associated downstream events, including induction of pronounced cell death phenotypes that were stronger than Ptpn2 deletion. Mechanistically, IFNγ stimulation increased the expression of BIM, BID and BAK in tumour cells, while VDAC2 counterbalances BAK activation downstream of IFNγ priming and protects tumour cells from IFNγ-induced MOMP and mitochondrial disruption to inhibit cell death and inflammatory remodelling. Overall, our study broadens our understanding of IFNγ signalling in mediating T cell-dependent cytotoxicity against tumours and cancer immunotherapy.
Although cGAS–STING signalling contributes to tumour immune surveillance, cancers often silence STING activity to mediate immune evasion50 by maintaining genome stability51 or clearing cytosolic DNA52. However, whether STING activity and mtDNA release in tumour cells are shaped by adaptive immunity remains unclear. We establish targeting VDAC2 as an effective means to overcome immune evasion by sensitizing tumour cells to IFNγ-induced mtDNA release and cGAS–STING activation, highlighting the role of VDAC2 as a gatekeeper for such non-canonical IFNγ signalling events. Consequently, VDAC2-deficient tumours showed increased CD8+ T cell accumulation and anti-tumour responses. Therefore, VDAC2 targeting links CD8+ T cell-mediated IFNγ production and adaptive immune responses to tumour-intrinsic activation of innate immune machinery as well as eliciting excessive tumour cell death, which mechanistically distinguishes VDAC2 from other targets that mediate tumour immune evasion7,31,53,54,55. Although BAK mediates both effects of VDAC2 targeting, our data reveal that cell death and STING-mediated inflammatory signals become divergent downstream of BAK, further highlighting the role of VDAC2 in coordinately orchestrating these two events.
From a therapeutic perspective, our study highlights the importance of the dual effects of destructing and inflaming tumours to induce effective tumour immunity and immunotherapy, thereby advancing our knowledge on cancer–immunity cycle3. Notably, many clinical trials combining ICB with other anti-tumour drugs are underway to explore possible combinatorial effects56. Targeting VDAC2 may provide opportunities to improve ICB therapies, and may be further leveraged in combination with ACT or with small-molecule inhibitors such as those targeting PTPN257. It will be important to determine the therapeutic window and/or specific targeting strategies to minimize potential deleterious effects. Although Vdac2 deletion impairs the development and survival of thymocytes58, we showed that mature CD8+ T cells retained their anti-tumour effects in the absence of VDAC2, highlighting discrete functional effects of VDAC2 in different T cell populations. Thus, selective targeting of VDAC2 or the VDAC2–BAK axis may be permissive to facilitate IFNγ- and CD8+ T cell-mediated killing and inflammatory rewiring of tumour cells. Collectively, our study establishes the targeting of VDAC2 in tumour cells as a potent strategy for cancer therapy, by enforcing IFNγ-dependent apoptotic cell death and an inflammation feedforward loop (Extended Data Fig. 10h), namely the induction of ‘inflammatory apoptosis’ by partially overriding caspase-mediated inhibition of STING activation. While innate control of adaptive immunity is a fundamental immunological principle59,60, our study provides insights into how adaptive immunity instructs innate immune-like reprogramming in tumour cells. Whether Vdac2 deletion effects and coordination of adaptive and innate responses and cell death are functionally conserved in additional contexts that require IFNγ signalling and type 1 immunity, such as infectious, inflammatory and autoimmune diseases, warrants further investigation.
Methods
Mice
C57BL/6 (000664), OT-I (003831), SMARTA (030450), Rosa26-Cas9 knock-in (026179), Cd8Cre (008766) and Rag1−/− (002216) mice (all on the C57BL/6 background) were purchased from the Jackson Laboratory. OT-I mice were crossed with Rosa26-Cas9 knock-in mice to generate OT-I-Cas9 mice. To generate Ifngfl/fl mice, loxP sites were inserted into intron 1 and the 3′ UTR of the Ifng gene, resulting in Cre-mediated deletion of exons 2–4, which were then bred with Cd8cre mice to generate Cd8CreIfngfl/fl mice. Sex- and age-matched (6–10-week-old) mice with predetermined genotypes (not blinded to investigators) were randomly assigned to control and experimental groups throughout the study, and both male and female mice were used. To generate complete bone marrow chimeras, bone marrow cells from Cd8CreIfngfl/fl or control Ifngfl/fl mice were flushed from mouse tibias and femurs, and red blood cells were lysed using ACK lysis buffer, followed by intravenous injection into sublethally (5.5 Gy) irradiated Rag1−/− recipient mice. Mice were inoculated with the indicated tumours at 8 weeks after bone marrow reconstitution. All of the mice were maintained under specific-pathogen-free conditions in the Animal Resource Center at St. Jude Children’s Research Hospital. The animals were housed under 12 h–12 h light–dark cycles coinciding with daylight in Memphis, TN, USA (light on at 06:00 and off at 18:00). Food and water were provided ad libitum. The St. Jude Children’s Research Hospital Animal Resource Center was maintained at 20–25 °C and 30–70% humidity. The research conducted in this study complied with all of the relevant ethical regulations. Experiments and procedures were approved by and performed in accordance with the Institutional Animal Care and Use Committee (IACUC) of St. Jude Children’s Research Hospital. The number of mice per group were selected based on previous publications29,49,61.
Cell lines
B16-OVA, MC38-OVA and MC38 cell lines were provided by D. Vignali. The HEK293T and LoVo cell lines were purchased from the American Type Culture Collection (ATCC). The Plat-E cell line was provided by Y.-C. Liu. All cell lines were cultured in Dulbecco’s modified Eagle’s medium (DMEM) (Gibco) or RPMI-1640 medium (Gibco) supplemented with 10% (v/v) FBS and 1% (v/v) penicillin–streptomycin at 37 °C with 5% CO2. No commonly misidentified cell lines (International Cell Line Authentication Committee) were used in this study. Cell lines were tested and determined to be free of mycoplasma contamination. The aforementioned cell lines were not independently authenticated.
Plasmid and stable cell line generation
The sgRNAs targeting Vdac2, Casp3, Casp7, Gsdme, Ifng, Tnf, Tnfrsf1a, Prf1, Ifngr1, Ifngr2, Jak1, Ptpn2, Vdac1, Vdac3, Cgas, Sting1, Mavs, Irf3, Ccl5, Bak1, Bax, Apaf1 and Casp9 or non-targeting control were synthesized, annealed and ligated into BbsI-HF-digested (R3539L, NEB) retroviral sgRNA vectors (LMA or pSIR-DsRed (BbsI), with Ametrine or DsRed as a selection marker, respectively)18,62. A list of the sgRNA sequences is provided in Supplementary Table 10. For the mouse liver tumour model, pX330-sgNTC and pX330-sgVdac2 plasmids were generated from pX330 (42230, Addgene) according to the established protocol63. To generate Cas9-expressing tumour cell lines (B16-OVA-Cas9, MC38-OVA-Cas9 and MC38-Cas9), lentivirus was produced by co-transfecting Lenti-Cas9-GFP (86145, Addgene) plasmid with psPAX2 (12260, Addgene) and pMD2.G (12259, Addgene) packing plasmids into HEK293T cells. The supernatant containing viral particles was collected at 48 h after transfection. B16-OVA, MC38-OVA and MC38 cells were transduced with viral supernatant for 48 h in RPMI-1640 (for B16-OVA) or DMEM (for MC38-OVA and MC38) + 10% (v/v) FBS supplemented with 10 μg ml−1 polybrene (Sigma-Aldrich), followed by sorting of transduced (GFP+) into single clones, followed by expansion. Cas9 expression was verified by immunoblot analysis61. To generate tumour cells deficient for the indicated genes using CRISPR–Cas9, retrovirus was produced by co-transfecting the indicated LMA or pSIR-DsRed (BbsI) vector(s) with pCL-Eco (12371, Addgene) and VSV.G (14888, Addgene) packing plasmids into Plat-E cells. The supernatant containing viral particles was collected 48 h after transfection. B16-OVA-Cas9, MC38-OVA-Cas9 or MC38-Cas9 cells were transduced with viral supernatant for 48 h in RPMI 1640 (for B16-OVA) or DMEM (for MC38-OVA and MC38) + 10% (v/v) FBS supplemented with 10 μg ml−1 polybrene (Sigma-Aldrich), followed by sorting Ametrine+ or Ametrine+DsRed+ (for dual targeting) cells. Cells were cultured for another 14 days for genome editing and expansion. Unless otherwise noted, Cas9-expressing tumour cells were used for all of the experiments described in this study.
To generate the pMIG-II-HA-VDAC2 plasmid used for VDAC2–BAK interaction analysis in B16-OVA cells that did not express Cas9 (see the ‘Immunoprecipitation and immunoblot analysis’ section below), the Vdac2 coding sequence was PCR-amplified from B16-OVA cDNA and cloned into the pcDNA3.1-HA vector (128034, Addgene). The HA-Vdac2 coding sequence was amplified and cloned into the pMIG-II (52107, Addgene) retroviral vector. To generate the pMIA-Flag-BAK and pMIA-Flag-BAX plasmids, Flag-Bak1 and Flag-Bax coding sequences were PCR-amplified from pcDNA-Flag-BAK or pMIG-BAX (8788, Addgene) and cloned into pMIA (52113, Addgene). To generate wide-type HA-VDAC2 plasmid, the HA-Vdac2 sequence with 6 amino acid synonymous mutation at sgVdac2 targeting sequence (to circumvent CRISPR–Cas9-mediated cleavage; ATCCATGGGTCAGCTGTCTTTGGT changed (bold bases) to ATACACGGATCGGCAGTATTTGGT) was first synthesized by Integrated DNA Technologies (IDT). On the basis of this CRISPR–Cas9-resistant VDAC2 construct, we designed three VDAC2 mutants to alter specific sequences (A172R, T168N and D170E (T168N/D170E) or T168N, D170E and A172R (T168N/D170E/A172R) reported to have reduced ability to bind BAK40,41, and these were synthesized by IDT. The following sequences were used for introducing such mutations: (1) A172R (GCC > CGC); (2) T168N/D170E (ACCTTTGAC > AACTTTGAA); (3) T168N/D170E/A172R (ACCTTTGACAGTGCC > AACTTTGAAAGTCGC). All of the plasmids were cloned using the NEBuilder HiFi DNA Assembly Cloning Kit (E5520S, NEB). To generate stable B16-OVA cells with Omi-mCherry (for imaging analysis), HA-VDAC2 and/or Flag-BAK/BAX overexpression (for immunoprecipitation), retrovirus was produced by co-transfecting pBabe(puro)-Omi-mCherry (48685, Addgene), pMIG-II-HA-VDAC2 or pMIA-Flag-BAK/BAX plasmid with pCL-Eco (12371, Addgene) and VSV.G (14888, Addgene) packing plasmids into plat-E cells. Omi-mCherry-, HA-VDAC2-, Flag-BAK- or Flag-BAX-expressing cells were sorted based on the fluorescence reporter mCherry (for Omi-mCherry), GFP (for HA-VDAC2) or Ametrine (for Flag-BAK or Flag-BAX).
T cell-mediated tumour cell killing assay in vitro
In total, 1 × 10⁵ tumour cells were seeded into a 12-well plate for the timepoints indicated in the figures and their legends. Naive OT-I CD8+ T cells were isolated from the spleen and peripheral lymph nodes of OT-I mice and activated using 10 μg ml−1 anti-CD3 (2C11, Bio X Cell, BE0001-1) and 5 μg ml−1 anti-CD28 (37.51, Bio X Cell, BE0015-1) antibodies as previously described18. Activated OT-I cells were then expanded in Click’s medium (Irvine Scientific) containing 10% dialysed FBS supplemented with glutamine in the presence of human recombinant IL-2 (20 IU ml−1; PeproTech), mouse IL-7 (12.5 ng ml−1; PeproTech) and IL-15 (25 ng ml−1; PeproTech) for 2–3 days. Preactivated OT-I CD8+ T cells were then cocultured with tumour cells at the indicated effector:tumour target ratios. The live tumour cell number was calculated, and the mean value of E:T = 0:1 group was set equal to 100%. Fresh human leukapheresis products were purchased from Charles River. These leukapheresis products were obtained from three de-identified healthy donors (donor numbers ECT026, ECT028 and ECT031) and were used to generate human CAR T cells (ECT24-PD030) by St. Jude Experimental Cellular Therapeutics Laboratory (ECTL), using an established protocol and a previously described lentiviral vector that encodes a B7-H3-CAR with a CD28ζ signalling domain64. Generated CAR T cells were cryopreserved at the end of production. As de-identified leukapheresis products were used, CAR T cell generation and experiments with these cells are considered non-human subject research. This determination was confirmed by the Institutional Review Board (IRB) at St. Jude Children’s Research Hospital. Before conducting cytotoxicity assays, CAR T cells were thawed and cultured in X-VIVO-15 medium (BEBP04-744Q, Lonza) containing 5% human serum (H4522, Sigma-Aldrich) in the presence of human recombinant IL-7 (10 ng ml−1, 130-093-764, Miltenyi) and human recombinant IL-15 (10 ng ml−1, 130-095-362, Miltenyi) for 24 h. Recovered CAR T cells were then co-cultured with sgNTC- or sgVDAC2-transduced LoVo cells65 at the indicated B7-H3-CAR T effector:tumour target ratios. At the indicated timepoints of co-culture, the number of live tumour cells were counted by flow cytometry using CountBright Absolute Counting Beads (C36950, Invitrogen).
T cell purification, differentiation and viral transduction for in vitro assays and adoptive transfer into tumour-bearing mice
Naive Cas9-expressing OT-I CD8+ T cells were isolated as mentioned above. Purified naive OT-I cells were activated in vitro for 18–20 h with 10 μg ml−1 anti-CD3 (2C11, Bio-X-Cell), 5 μg ml−1 anti-CD28 (37.51; Bio-X-Cell) before viral transduction. Viral transduction was performed by spin-infection at 900g at 25 °C for 3 h with 10 mg ml−1 polybrene (Sigma-Aldrich). After transduction, cells were cultured in T cell medium containing human recombinant IL-2 (20 IU ml−1; PeproTech), mouse recombinant IL-7 (12.5 ng ml−1; PeproTech) and mouse recombinant IL-15 (25 ng ml−1; PeproTech) for 4 days. Naive Cas9-expressing CD4+ T cells were isolated from the spleen and peripheral lymph nodes of Cas9-SMARTA mice as previously described66. Viral transduction was performed by spin-infection at 900g at 25 °C for 3 h with 10 mg ml−1 polybrene (Sigma-Aldrich). After transduction, cells were cultured for iTreg or TH1 differentiation: naive CD4+ T cells were stimulated with 5 μg ml−1 anti-CD3 (2C11; Bio-X-Cell), 5 μg ml−1 anti-CD28 (37.51; Bio-X-Cell) in the presence of human IL-2 (100 U ml−1) plus human TGFβ (0.5 ng ml−1; PeproTech) for iTreg polarization; or human recombinant IL-2 (100 U ml−1) plus mouse recombinant IL-12 p40 (0.5 ng ml−1; BD Biosciences) for TH1 polarization for 5.5 days. Transduced cells were sort-purified based on the expression of Ametrine.
For assays involving IFNγ or anti-IFNγ treatments of sgNTC- or sgVdac2-transduced OT-I, iTreg or TH1 cells, Ametrine+ sorted cells were incubated with IFNγ (10 ng ml−1) or anti-IFNγ (10 μg ml−1) for 12–24 h as indicated in the figure legends. Cells were collected for flow cytometry, immunoblotting or quantitative PCR with reverse transcription (RT–qPCR) analysis as indicated in the figure legends. For adoptive transfer of sgNTC- or sgVdac2-transduced OT-I cells into B16-OVA tumour-bearing mice, C57BL/6 mice were s.c. injected with 3 × 10⁵ B16-OVA melanoma cells on day 0. At day 12 after tumour inoculation, a total of 4 × 10⁶ sgNTC-transduced (labelled with Ametrine) and sgVdac2-transduced (labelled with Ametrine) OT-I cells were injected intravenously into separate B16-OVA tumour-bearing mice. Tumour growth and mouse survival were monitored.
Cas9+ MEF isolation, transduction and treatment
Cas9-expressing mouse embryos were isolated from Cas9-transgenic mice on E14.5. The embryos were euthanized by decapitation, and the fetal liver and heart were removed with forceps, followed by rinsing of the embryos with ice-cold PBS. The embryos were incubated with 3–5 ml ice-cold Trypsin-EDTA (25200-56, Gibco) overnight on ice in a 50 ml conical tube (Falcon). The trypsin-EDTA was aspirated off the embryos, followed by resuspension in 2 ml of pre-warmed (37 °C) trypsin-EDTA and incubation for 5–7 min in a 37 °C water bath. The digestion reaction was stopped by addition of 10 ml of MEF medium (DMEM + 10% FBS) followed by pipetting without introduction of air bubbles. After resting for 5 min at room temperature, the embryo suspension was transferred to a new 50 ml conical tube and centrifuged at 1,500 rpm for 5 min. The cell pellet was resuspended in MEF medium and filtered through a 70 μm cell strainer to remove debris. The cells from each embryo were plated into one T-160 plates or three T-75 (or 10 cm plates), reaching around 70% confluency within approximately 2 days. MEFs were transduced with sgNTC- or sgVdac2-expressing retrovirus for 48 h in MEF medium containing 10 μg ml−1 polybrene (Sigma-Aldrich), followed by sorting Ametrine+ MEFs. Ametrine+ transduced MEFs were cultured for another 14 days for genome editing and expansion. For assays involving IFNγ (10 ng ml−1, 24 h), ΤNF (10 ng ml−1) plus cycloheximide (5 μg ml−1, 4 h), or etoposide (20 μM, 24 h) treatments, sgNTC- or sgVdac2-transduced MEFs were treated for the indicated times listed above, followed by flow cytometry, immunoblotting or RT–qPCR analysis, as indicated in the figure legends.
Tumour models and immunotherapeutic treatments
Mice (C57BL/6 mice, Cas9+ transgenic mice, Rag1−/− mice or complete bone marrow chimeras) were injected s.c. with 1 × 10⁶ B16-OVA-Cas9, MC38-OVA-Cas9 or MC38-Cas9 cells expressing the indicated sgRNAs in the right flank. For the lung metastasis model, 1 × 10⁶ B16-OVA-Cas9 cells transduced with the indicated sgRNAs were resuspended in 100 μl phosphate-buffered saline (PBS, Gibco) and injected into Cas9+ transgenic mice through the tail vein. After tumour inoculation, mice were randomly assigned to different groups for ICB and/or ACT treatments. For tumour models with OT-I T cell transfer, preactivated OT-I cells (the details are provided above) were transferred intravenously into tumour-bearing mice at day 7 after tumour inoculation (1 × 10⁷ OT-I cells per mouse). Anti-PD-L1 antibody (10 F.9G2, Bio X Cell) or IgG isotype control (LTF-2, Bio X Cell) was injected intraperitoneally three times at a dose of 100 μg in 100 μl PBS on days 7, 10 and 13 after inoculation of B16-OVA-Cas9 cells transduced with the indicated sgRNAs, as described previously61. Anti-PD-1 antibody (J43, Bio X Cell) or rat IgG isotype control (LTF-2, Bio X Cell) was injected intraperitoneally three times at a dose of 100 μg in 100 μl PBS on days 7, 9 and 11 after inoculation of MC38-Cas9 cells expressing the indicated sgRNAs, as described previously61. Mice that completely rejected tumours were rechallenged with 1 × 10⁶ B16-OVA-Cas9-sgNTC or MC38-Cas9-sgNTC cells on day 40 or day 50. Anti-CD8α antibody (2.43, Bio X Cell) or rat IgG isotype control (LTF-2, Bio X Cell) was injected intraperitoneally at a dose of 200 μg in 100 μl PBS on days −1, 2, 5, 8 and 11. Anti-IFNγ antibody (XMG1.2, Bio X Cell) or IgG isotype control (HRPN, Bio X Cell) was injected intraperitoneally at a dose of 200 μg in 100 μl PBS on days −1, 3, 7, 11 and 15 or the timepoints as indicated in the figures and their legends. Emricasan was dissolved in PBS and tumour-bearing mice were treated with emricasan (or PBS vehicle) intraperitoneally at 20 mg kg−1, twice a day for 3 days43. To establish the constitutively active AKT and NRAS-driven liver tumour mouse model, 6-week-old male mice were injected with 5 μg pT3-EF1a-myrAKT1-HA (31789, Addgene), 5 μg pT-Caggs-NRASG12V (20205, Addgene) and 2.5 μg pCMV(CAT)T7-SB100 (34879, Addgene) as previously described67. To target Vdac2 in vivo, 50 μg pX330-sgNTC or pX330-sgVdac2 was mixed together with the above oncogenic vectors and injected into mice. A volume of plasmid solution equal to 10% of the body weight in sterile Ringer’s solution was injected through the tail vein within 5–7 s67. s.c. B16-OVA, MC38-OVA and MC38 tumours were measured every 2 days with digital callipers and the tumour volumes were calculated using the formula: length × width × width × π/6. To isolate intratumoural lymphocytes, s.c. tumours were collected on the indicated days after inoculation, excised, minced and digested with 1 mg ml−1 collagenase IV (LS004188, Worthington Biochemicals) and 200 U ml−1 DNase I (DN25-1G, Sigma-Aldrich) for 1 h at 37 °C and passed through 70-μm filters to remove undigested tumour tissues. TILs from MC38-OVA tumours were further isolated by density-gradient centrifugation over Percoll (17089101, Cytiva). Tumour size limits were approved to reach a maximum of 3,000 mm3 or ≤20% of body weight (whichever was lower) by the IACUC of St. Jude Children’s Research Hospital.
CRISPR–Cas9 mutagenesis screening using the lentiviral metabolic library
Lentiviral sgRNA metabolic library construction
The mouse metabolic library containing 3,017 genes was synthesized based on the gene list from reported human metabolic-associated genes, and library synthesis, purification and quality control were described previously18. In brief, 6 sgRNAs were designed for each gene and were split into two sub-libraries (AAAQ05 and AAAQ07), with each containing 3 sgRNAs targeting one gene and 500 non-targeting controls.
In vitro and in vivo screens
Lentivirus was produced by co-transfecting HEK293T cells with the two lentiviral metabolic sublibrary plasmids, psPAX2 (12260, Addgene) and pCAG4-Eco (35617, Addgene). Then, 48 h after transfection, the supernatant containing viral particles was collected and frozen at −80 °C. A single clone of B16-OVA-Cas9 cells with high Cas9-editing activity was expanded and transduced with the two sub-pools at a multiplicity of infection (MOI) of 0.2–0.3 to achieve 20–30% transduction efficiency. The sublibrary-transduced B16-OVA-Cas9 cells were purified by sorting of Ametrine+ cells and then mixed at 1:1 ratio. Cells were cultured in vitro for another 14 days for genome editing and expansion. An aliquot of 5 × 10⁶ transduced B16-OVA-Cas9 cells (about 250× cell coverage per sgRNA) was saved as the input. For in vitro screening, transduced B16-OVA-Cas9 cells were co-cultured with preactivated OT-I CD8+ T cells (see details above) for 18 h. The remaining tumour cells (5 × 10⁶, about 250× cell coverage per sgRNA) were sorted and used for deep sequencing analysis. For in vivo screening, 1 × 10⁶ transduced B16-OVA cells were inoculated into Rag1−/− mice or Cas9+ transgenic mice (10 mice each group, 2 replicates). Preactivated OT-I cells (the details are provided above) were transferred intravenously into B16-OVA tumour-bearing mice at day 7 after tumour inoculation (1 × 10⁷ OT-I cells per mouse). At day 17 after tumour challenge, Ametrine+ tumour cells were collected from the pooled tumour tissues using a cell sorter. At least 5 × 10⁶ sorted B16-OVA cells (>250× cell coverage per sgRNA) were used for deep sequencing analysis.
Sequencing library preparation
Genomic DNA was extracted by using the DNeasy Blood & Tissue Kits (69506, Qiagen). Primary PCR was performed using the KOD Hot Start DNA Polymerase (71086, Millipore) and the following pair of Nextera next-generation sequencing (NGS) primers: (Nextera NGS forward (-F): TCGTCGGCAGCGTCAGATGTGTATAAGAGACAGTTGTGGAAAGGACGAAACACCG; Nextera NGS reverse (-R): GTCTCGTGGGCTCGGAGATGTGTATAAGAGACAGCCACTTTTTCAAGTTGATAACGG). Primary PCR products were purified using the AMPure XP beads (A63881, Beckman). A second PCR reaction was performed to attach Illumina adaptors and indexes to barcode each sample. Hi-seq 50-bp single-end sequencing (Illumina) was performed for library sequencing.
Secondary genome-scale CRISPR–Cas9 mutagenesis screening in VDAC2-deficient tumour cells
In vitro screening after IFNγ treatment
Lentivirus was produced by co-transfecting HEK293T cells with lentiviral genome-scale Brie library plasmids with the puromycin-resistance gene68, psPAX2 (12260, Addgene) and pCAG4-Eco (35617, Addgene). Then, 48 h after transfection, the supernatant containing viral particles was collected and frozen at −80 °C. VDAC2-deficient B16-OVA-Cas9 cells (transduction efficiency, ~5%) were subsequently transduced with the Brie library at an MOI of 0.2–0.3. Brie-library-transduced VDAC2-deficient B16-OVA-Cas9 cells were then cultured with 4 μg ml−1 puromycin for another 14 days to select for transduced cells. An aliquot of 8 × 10⁶ transduced VDAC2-deficient B16-OVA-Cas9 cells (about 100× cell coverage per sgRNA) were saved as input. In total, 5 × 10⁷ transduced VDAC2-deficient B16-OVA-Cas9 cells were treated with IFNγ (554587, BD) at 10 ng ml−1 for 24 h, resulting in more than 50% tumour cell death (2 replicates). Transduced VDAC2-deficient B16-OVA-Cas9 cells without IFNγ treatment were used as control. A total of 8 × 10⁶ transduced VDAC2-deficient tumour cells (about 100× cell coverage per sgRNA) was collected and used for deep sequencing. DNA exaction and sequencing library preparation were as described in the ‘Sequencing library preparation’ section using Q5 enzyme (M0541L, NEB) for PCR reactions.
Data processing
For data analysis, FASTQ read files obtained after sequencing were demultiplexed using the Hi-Seq analysis software (Illumina) and processed using MAGeCK (v.0.5.9.4)69. Raw counts for each sgRNA were generated with MAGeCK ‘count’ module by mapping reads to the mouse metabolic library or the Brie library with non-targeting sgRNAs as the control. The MAGeCK ‘test’ function was used to identify screen hits. For the initial in vitro and in vivo screens, we were able to detect the majority (~99.9% and ~98.8%, respectively) of genes contained in the library from tumour cells (Supplementary Table 1). Total read counts were used for raw count normalization and the secondbest method was used for log2FC quantification. The effects of screen hits were ranked by MAGeCK RRA score.neg (in vitro OT-I treated versus non-treated or C57BL/6 mice + OT-I versus Rag1−/− mice). For the genome-scale secondary genetic interaction screen using the Brie library68, median read counts across all samples were used for normalization, and the ‘mean’ method was used for log2FC quantification and –gene-test-fdr-threshold was set to 1. The significantly enriched or depleted screen hits in sgVdac2-transduced B16-OVA tumour cells were defined as |log2FC| > 0.5 and MAGeCK RRA score < 0.05 (Extended Data Fig. 7a). The targeted genes in the Brie library were further overlapped with genes included in the MitoCarta 3.0 database36 (1,140 for total) to generate a list of 1,032 mitochondria-associated genes (Fig. 4b). The log2FC values and MAGeCK RRA scores of the mitochondria-associated genes in this secondary genetic interaction screen were visualized as a volcano plot by ggplot2 R package (v.3.3.5), with the top 1 and 2 significantly enriched (based on MAGeCK RRA score) mitochondria-associated gene candidates (Casp9 and Bak1) annotated.
Flow cytometry
For analysis of surface markers, cells were first incubated with Fc block (2.4G2, Bio X Cell) for 10 min in PBS containing 2% (w/v) FBS, and then stained with the appropriate antibodies on ice for 30 min. For intracellular cytokine detection, cells were stimulated for 4 h with phorbol 12-myristate-13-acetate (Sigma-Aldrich) plus ionomycin (Sigma-Aldrich) in the presence of monensin (GolgiStop, 554724, BD Biosciences) and stained for surface markers. The cells were fixed and permeabilized using the CytoFix/CytoPerm fixation/permeabilization kit (554774, BD Biosciences) according to the manufacturer’s instructions followed by intracellular cytokine staining using the appropriate antibodies on ice for 30 min. For transcription factor staining, cells were stained for surface markers, followed by fixation and permeabilization using FOXP3/transcription factor staining buffer set (00-5523-00, eBioscience) according to the manufacturer’s instructions and intracellular staining with the appropriate antibodies on ice for 30 min. 7-AAD (A9400, 1:200, Sigma-Aldrich) or fixable viability dye (65-0865-18, 1:1,000, eBioscience) was used for dead cell exclusion. Active caspase-3 staining of control and VDAC2-deficient tumour cells was performed using instructions and reagents from an active caspase-3 apoptosis kit (BD Biosciences). The following antibodies were used: PE–anti-CD45 (1:400, 30-F11, 12-0451-83, eBioscience), FITC–anti-CD45.2 (1:400, 104, 109806, BioLegend), Brilliant Violet 785–anti-CD45.2 (1:400, 104, 109839, BioLegend), Alexa Fluor 700–anti-CD8α (1:400, 53-6.7, 100730, BioLegend), Brilliant Violet 605–anti-CD8α (1:400, 53-6.7, 100743, BioLegend), Alexa Fluor 650–anti-CD4 (1:400, GK1.5, 100469, BioLegend), Brilliant Violet 785–anti-TCRβ (1:400, H57-597, 109249, BioLegend), PE/Dazzle 594–anti-PD-1 (1:400, 29F.1A12, Biolegend,135228), Brilliant Violet 711–anti-B220 (1:400, RA3-6B2, 103255, BioLegend), FITC–anti-CD19 (1:400, eBio1D3, 11-0193-85, eBioscience), PE/Cyanine7–anti-IFNγ (1:200, XMG1.2, 505826, BioLegend), Brilliant Violet 421–anti-TNF (1:200, MP6-XT22, 506328, BioLegend), Alexa Fluor 647–anti-GZMB (1:100, GB11, 515406, BioLegend), FITC–anti-FOXP3 (1:200, FJK-16s, 11-5773-82, eBioscience), BV650–anti-Ki-67 (1:100, B56, 563757, BD Biosciences), Alexa Fluor 647–anti-active caspase-3 (1:100, C92-605, 560626, BD Biosciences), PE–anti-IL-2 (1:200, JES6-5H4, 554428, BD Biosciences). Intratumoural CD8+ T cells were gated as CD45+CD8+TCRβ+; CD4+FOXP3− T cells were gated as CD45+CD4+TCRβ+FOXP3−; CD4+FOXP3+ Treg cells were gated as CD45+CD4+TCRβ+FOXP3+; B cells were gated as CD45+B220+CD19+. Tumour cells were gated as Ametrine+CD45− cells. BD FACSDIva software (v.8) was used to collect flow cytometry data on LSRII, Fortessa or Symphony A3 cytometers (BD Biosciences).
Cytokine-induced cell death assays in vitro
To analyse cytokine-induced cell death, the indicated concentration of IFNγ and/or TNF (554589, BD) or human IFNγ (554616, BD) was added. For cell death inhibition assays, pan-caspase inhibitor emricasan43 (20 μM), ferroptosis inhibitor ferrostatin-170 (Fer-1, 10 μM), necroptosis inhibitor necrostatin-171 (Nec-1, 20 μM) and GSDMD-mediated pyroptosis inhibitor disulfiram72 (20 μM) were used. Tumour cell numbers were quantified at the indicated timepoints by flow cytometry using the cell counting beads. Alternatively, cell death was detected and quantified in real-time using the IncuCyte S3 or IncuCyte SX5 imaging system (Sartorius). In brief, 2 × 10⁴ B16-OVA cells per well were plated into a 48-well plate in RPMI-1640 medium containing 10% FBS, 500 nM propidium iodide (P3566, Invitrogen) or 100 nM SYTOX Deep Red (S11381, Invitrogen) and the indicated concentration of IFNγ (details are provided in the associated figures). Cells were imaged every 1 or 2 h and the PI+ or SYTOX Deep Red+ cells (counted as dead cells) were quantified using the IncuCyte FLR or Zoom software (http://www.essenbioscience.com/en/products/software/) as described previously73. For the LDH-release assay, the cell culture medium was collected at the indicated timepoints and centrifuged at 2,000g for 5 min to obtain the supernatant. LDH release was detected using the CytoTox 96 Non-Radioactive Cytotoxicity Assay Kit (G1780, Promega) according to the manufacturer’s instructions. The absorbance was measured on the VERSAmax Tunable Microplate Reader (Molecular Devices). For annexin-V and 7-AAD staining, tumour cells (including both the adherent and suspension fractions) were washed and resuspended with annexin V binding buffer (00-0055-56, eBioscience) and then stained with APC–anti-annexin V (1:50, BMS306APC-100, Invitrogen) in annexin V binding buffer for 15 min at room temperature. After washing with annexin V binding buffer, the cells were resuspended with 7-AAD working solution (51-65875X, BD) and analysed using flow cytometry.
Cytosolic mtDNA extraction and quantification
B16-OVA cells were cultured in a 10 cm dish and treated with 10 ng ml−1 IFNγ plus pan-caspase inhibitor Q-VD-OPh (40 μM, HY-12305, MedChemExpress) for 24 h, followed by extraction and detection of total DNA and cytosolic DNA as described previously35. In brief, 1 × 10⁷ B16-OVA cells were divided into two equal aliquots. One aliquot was resuspended in 300 μl of 50 mM NaOH and boiled for 60 min to solubilize DNA. Then, 10% volume of 1 M Tris-HCl (pH 7.5) was added to neutralize the pH and then centrifuged at 12,000g for 10 min to pellet intact cells. Moreover, these extracts served as normalization controls for total genomic DNA and mtDNA. The second equal aliquots were resuspended in 300 μl of buffer containing 150 mM NaCl, 50 mM HEPES (pH 7.4), and 20 mg ml−1 digitonin (D141, Sigma-Aldrich). The homogenates were incubated for 15 min on ice to allow selective plasma membrane permeabilization and then sequentially centrifuged at 980g for 3 min for a total of three times to pellet intact cells. Finally, the cytosolic supernatants were transferred to fresh tubes and centrifuged at 16,000g for 10 min to pellet any remaining cellular debris. The cytosolic DNA and total cellular DNA (from whole-cell extracts) were purified using the DNeasy Blood & Tissue Kit (69506, Qiagen). RT–qPCR was performed on both whole-cell extracts and cytosolic fractions using mtDNA primers (mtCytb, mtNd4, mt16S, D-loop1, D-loop2 and D-loop3), and the CT values of whole-cell extracts served as normalization controls for the values of cytosolic fractions (FC = log2−ΔΔCT). A list of the primers used for qPCR analysis is provided in Supplementary Table 11.
Generation of mtDNA-depleted cells
B16-OVA cells were cultured in the presence or absence of 200 ng ml−1 ethidium bromide (EtBr, E7637, Sigma-Aldrich), as described previously44,45, for 6 days. Before IFNγ treatment, the culture medium was replaced, and cells were cultured overnight in the absence of EtBr. To measure the efficiency of mtDNA depletion, total extracts were prepared by resuspending the cells in NaOH 50 mM, incubating at 95 °C for 1 h and neutralizing by adding 10% volume 1 M Tris (pH 7.5). The ratio of mtDNA versus genomic DNA was measured using qPCR .
Immunoprecipitation, subcellular fractionation and immunoblot analysis
For immunoprecipitation, 2 × 10⁶ cells expressing HA-VDAC2 and/or Flag-BAK or Flag-BAX were lysed in ice-cold Pierce IP lysis buffer (87787, Thermo Fisher Scientific) containing protease and phosphatase inhibitor cocktail (78442, Thermo Fisher Scientific) and 1% digitonin (D141, Sigma-Aldrich) with rotation at 4 °C for 30 min. The cell lysate was centrifuged at 13,000g for 10 min at 4 °C, and the supernatant was incubated with anti-Flag (M8823, Sigma-Aldrich) or anti-HA (88836, Thermo Fisher Scientific) magnetic beads at 4 °C for 2 h. The beads were washed three times with ice-cold IP lysis buffer (87787, Thermo Fisher Scientific) and resuspended with 1× complete Laemmle sample buffer (1610747, Bio-Rad).
To detect cytochrome c and SMAC in the subcellular fractions, the mitochondrial and cytosolic fractions were isolated using the Mitochondrial Fractionation Kit (Active Motif) according to the manufacturer’s instructions. In brief, cells were treated with 10 ng ml−1 IFNγ plus 40 μM pan-caspase inhibitor Q-VD-OPh for 24 h and then washed using pre-chilled 1× PBS and centrifuged at 600g for 5 min at 4 °C. The cell pellet was resuspended in 1 ml ice-cold cytosolic buffer and incubated on ice for 15 min, then transferred to a pre-chilled pestle homogenizer. Cells were homogenized using 30–50 strokes with the homogenizer and centrifuged at 800g for 20 min at 4 °C. After centrifugation, the supernatant was transferred to a fresh pre-chilled microcentrifuge tube and centrifuged at 10,000g for 20 min at 4 °C to pellet the mitochondria; the supernatant contained the cytosolic fraction. The mitochondrial pellet was washed once with 100 μl 1× cytosolic buffer and lysed with 100 μl complete mitochondrial buffer on ice for 15 min to obtain the mitochondrial fraction. The cytosolic fraction was transferred to a fresh pre-chilled microcentrifuge tube and centrifuged at 16,000g for 20 min at 4 °C to remove any residual mitochondria.
For chemical cross-linking of cysteines, cells were treated with IFNγ (10 ng ml−1) plus Q-VD-OPh74 (40 μM) for 24 h or ABT-737 (5 mM) + S63845 (5 mM) + Q-VD-OPh75 (40 μM) for 6 h. The mitochondrial fraction was obtained as mentioned before and resuspended in cross-linking buffer (20 mM HEPES/KOH (pH 7.5), 100 mM sucrose, 2.5 mM MgCl2 and 50 mM KCl) containing the fresh added 1,6-bis-maleimidohexane (BMH, 0.5 mM, 13.0 A° linker, Thermo Fisher Scientific) and incubated for 30 min at room temperature. Cross-linking was quenched by addition of reducing buffer (1× complete Laemmle sample buffer with 10% 2-mercaptoethanol, M6250, Sigma-Aldrich), and the samples were analysed by SDS–PAGE.
For immunoblot analysis of tumours treated with isotype or anti-PD-L1 in vivo (as described above), B16-OVA tumour tissues (~100 mg) from tumour-bearing mice were homogenized in 1 ml ice-cold RIPA buffer (89900, Thermo Fisher Scientific) containing protease and phosphatase inhibitor cocktail and homogenized using the Bead Ruptor Elite (OMNI). The lysate was centrifuged at 13,000g for 10 min at 4 °C, and the supernatant was mixed with 4× complete Laemmli Sample Buffer (1610747, Bio-Rad). For immunoblot analysis of cells treated with IFNγ, cisplatin (HY-17394, MCE) or etoposide (HY-13629, MCE) in vitro, cultured cells were directly lysed with 1× complete Laemmli sample buffer. In Extended Data Figs. 8c and 10g, IFNγ-induced expression of BCL-2 family members was analysed in B16-OVA cells without Cas9 expression. All of the protein samples were boiled at 95 °C for 10 min, separated using 4–12% Criterion XT Bis-Tris Protein Gel (3450125, Bio-Rad) and transferred to a PVDF membrane (1620177, Bio-Rad). The membranes were blocked using 5% BSA for 1 h and then incubated overnight with primary antibodies (see below). The membranes were then washed with TBST and then incubated with secondary antibodies for 2 h. After antibody incubation, HRP was activated with Supersignal West Dura Extended Duration Substrate (34075, Thermo Fisher Scientific) and visualized with a chemiluminscent detection system using Amersham Imager 600 (GE Healthcare Life Sciences). The blots were then processed and analysed using Image J. Primary antibodies and dilutions were as follows: anti-VDAC2 (1:1,000, PA5-28106, Invitrogen), anti-BCL-2 (1:1,000, sc-7382, Santa Cruz), anti-MCL-1 (1:1,000, ab32087, Abcam), anti-GSDME (1:1,000, ab215191, Abcam), anti-Flag (1:5,000, F1804, Sigma-Aldrich), anti-BIM (1:1,000, B7929, Sigma-Aldrich); anti-Cas9 (1:5,000, 14697), anti-β-actin (1:5,000, 4970), anti-p-STAT1Y701 (1:1,000, 9167), anti-STAT1 (1:1,000, 14994), anti-caspase-3 (1:1,000, 9662), anti-cleaved caspase-3 (1:1,000, 9661), anti-caspase-7 (1:1,000, 9492), anti-cleaved caspase-7 (1:1,000, 9491), anti-caspase-9 (1:1,000, 9504), anti-APAF-1 (1:1,000, 8969), anti-cGAS (1:1,000, 31659), anti-STING (1:1,000, 13647), anti-p-STINGS365 for mouse cells (1:1,000, 72971), anti-p-STINGS366 for human cells (1:1,000, 19781), anti-TBK1 (1:1,000, 38066), anti-p-TBK1S172 (1:1,000, 5483), anti-IRF3 (1:1,000, 4302), anti-p-IRF3S396 (1:1,000, 29047), anti-MAVS (1:1,000, 4983), anti-BAK (1:1,000, 12105), anti-BAX (1:1,000, 2772), anti-BCL-xL (1:1,000, 2764), anti-BID for mouse cells (1:1,000, 2003), anti-BID for human cells (1:1,000, 2002), anti-PUMA (1:1,000, 98672), anti-HA (1:5,000, 3724), anti-SMAC (1:1,000; 15108), anti-cytochrome c (1:1,000, 4280) and anti-TOMM20 (1:1,000, 42406) (all from Cell Signaling Technology). Secondary antibodies and dilutions were as follows: HRP-conjugated anti-mouse IgG (1:3,000; W4021; Promega) or HRP-conjugated anti-rabbit IgG (1:3,000, W4011, Promega). Densiometric quantification of phosphorylated protein levels was normalized relative to the corresponding total protein, and densiometric quantification of total protein expression was normalized relative to the loading control β-actin or TOMM20 (specifically for Extended Data Fig. 7k). All densiometric quantifications depict the fold changes compared with the relative control (set equal to 1.0) and are shown above the immunoblot image.
MTT assay
To assess tumour cell expansion in vitro, the MTT cell proliferation assay was performed using a commercial kit (30-1010K, ATCC). In brief, 1,000 cells per well B16-OVA-Cas9-sgNTC or B16-OVA-Cas9-sgVdac2 cells were plated onto the 96-well plate on day 0, and the cell number was detected every 24 h according to the manual. Absorbance was measured on the VERSAmax Tunable Microplate Reader (Molecular Devices).
ELISA
For in vivo IFNγ and IFNβ detection, B16-OVA tumour tissues (~200 mg) from tumour-bearing mice were homogenized in 500 μl ice-cold RIPA buffer (89900, Thermo Fisher Scientific) containing protease and phosphatase inhibitor cocktail using Bead Ruptor Elite device (OMNI). The lysate was centrifuged at 13,000g for 10 min at 4 °C, and the supernatant was used for IFNγ and IFNβ enzyme-linked immunosorbent assay (ELISA). For in vitro cultured cells, the culture medium was collected at the indicated timepoints and centrifuged at 13,000g for 10 min at 4 °C to obtain the supernatant. IFNγ and IFNβ was measured by ELISA using the Mouse IFNγ Quantikine ELISA Kit (MIF00-1, R&D systems) or Mouse IFNβ Quantikine ELISA Kit (MIFNB0, R&D systems) according to the manufacturer’s instructions. Absorbance was measured on a VERSAmax Tunable Microplate Reader (Molecular Devices).
Immunostaining and histology analyses
Live-cell imaging was performed using B16-OVA-Cas9-sgNTC or B16-OVA-Cas9-sgVdac2 cells, which were cultured in chambered coverslips (80426, Ibidi). Tumour cells expressing Omi-mCherry were used for determination of MOMP (the pBabe(puro)-Omi-mCherry plasmid expresses fusion protein in the mitochondria intermembrane space, and is released on MOMP39). Time-lapse imaging was performed using the A1RHD25 (Nikon Instruments) resonant scanning confocal equipped with heat and CO2 incubation, and NIS Elements software (64 bit, v.5.30.03). Images were collected with either a ×40/1.3 NA Plan Fluor or 60× 1.3 NA Plan Apo oil objective and 561 nm laser excitation, and acquired with 1,024 × 1,024 with 0.1 μm px−1 resolution.
mtDNA imaging was performed using control (sgNTC) and VDAC2-deficient B16-OVA cells with or without 10 ng ml−1 IFNγ plus 40 μM pan-caspase inhibitor Q-VD-OPh treatment for 0 to 24 h as indicated in figures. All of the cells were cultured in chambered coverslips (80426, Ibidi), fixed with 2% paraformaldehyde for 10 min at room temperature, and then treated with 0.1% Triton-100 for permeabilization. Cells were blocked with PBS containing 1% bovine serum albumin and 5% normal goat serum before addition of anti-dsDNA (1 μg ml−1; MAB030, Millipore-Sigma), anti-TOMM20 (1 μg ml−1; 186735, Abcam) or anti-HA (1 μg ml−1; 2367, Cell Signaling Technology) antibodies, followed by detection with donkey anti-mouse (1:500, A32773, Thermo Fisher Scientific) and donkey anti-rabbit (1:500, A32795, Thermo Fisher Scientific) secondary antibodies. Images were acquired using the A1RHD25 (Nikon Instruments) resonance scanning confocal microscope using a ×40/1.3 NA Plan Fluor oil objective, 1,024 × 1,024 and 0.1 μm px−1 resolution, 561 nm and 640 nm laser lines. Images were deconvolved using NIS Elements (64 bit, v.5.30.03) and analysed using Imaris software (Bitplane, v.9.5.1×64). For histology analyses, mouse tissues were fixed by 10% (v/v) neutral buffered formalin solution, embedded in paraffin, sectioned and stained with haematoxylin and eosin.
RNA isolation and gene expression profiling
Cells were lysed with Buffer RLT in the RNeasy Micro Kit (74004, Qiagen), and total RNA was extracted according to the manufacturer’s instructions. Then, 1 μg total RNA was reverse transcribed using the High-Capacity cDNA Reverse Transcription Kit (4368814, Applied Biosystems). Diluted cDNA was subjected to RT–qPCR reactions containing Power SYBR Green PCR Master Mix (4367659, Applied Biosystems) and gene-specific primers. The reactions were performed in a QuantStudio7 Flex Real-Time PCR System (Applied Biosystems). Actb was used as the housekeeping control. A list of the primers is provided in Supplementary Table 11.
Microarray transcriptome analyses
For microarray analysis, to analyse the gene expression of tumour cells after treatment with OT-I cells, control or VDAC2-deficient B16-OVA tumour cells were treated with OT-I cells for 24 h, and the remaining tumour cells were sorted for RNA extraction (n = 4 replicates each group). To compare the differently expressed genes in various groups (control, VDAC2-deficient; BAK-deficient; VDAC2 and BAK co-deficient; STING-deficient; VDAC2 and STING co-deficient; APAF-1-deficient; VDAC2 and APAF-1 co-deficient; BIM and BID co-deficient; or VDAC2, BIM and BID co-deficient) of B16-OVA tumour cells, tumour cells were treated with or without IFNγ at 10 ng ml−1 for 24 h in vitro, and the adherent tumour cell fraction was collected for RNA extraction (3 or 4 replicates for each group). To analyse the gene expression of LoVo cells after treatment with IFNγ, control or VDAC2-deficient LoVo tumour cells were treated with human IFNγ for 48 h, and the remaining tumour cells were collected for RNA extraction (n = 3 replicates each group). After RNA extraction and purification, 125 ng RNA was used to profile with Affymetrix mouse or human Clariom S assay. The expression signals were analysed using Affymetrix Expression Console (v.1.4.1), followed by differential expression analysis performed using R package limma (v.3.34.9). All of the plots were generated using R packages ggplot2 and ComplexHeatmap (v.2.6.2). Volcano plots depicting log2FC and –log10(P value) were plotted, differentially expressed genes were defined by |log2(FC)| > 0.5; P < 0.05, and the top enriched genes were highlighted.
For GSEA, the preprocessed expression dataset and gene sets were input into GSEA (v.4.3.2), and gene sets were ranked based on their enrichment scores calculated using the two-tailed Kolmogorov–Smirnov test. A ranked GSEA was conducted using the default settings except for ‘Permutation type’, which was set to ‘gene_set’. Hallmark signatures from the Molecular Signatures Database were used (MSigDB; https://www.broadinstitute.org/gsea/msigdb/; v.7.4). For IPA analysis, we used the commercial QIAGEN’s Ingenuity Pathway Analysis (IPA, QIAGEN; www.qiagen.com/ingenuity, v.01-23-01) software for upstream regulatory analysis of differentially expressed genes identified in VDAC2-deficient versus WT B16-OVA cells at 16 h after IFNγ treatment, or at 24 h after OT-I cell treatment. For upstream regulatory analysis, we used |log2FC| > 0.4 as the threshold to select 249 upregulated genes and 262 downregulated genes as the input. In the microarray dataset profiling tumour cells with single deletion or co-deletion of VDAC2 and STING treated with IFNγ for 24 h, differentially expressed genes (sgVdac2 versus sgNTC tumour cells, log2FC > 0.5, P < 0.05) were first intersected with genes in Hallmark IFNα and IFNγ response pathways to obtain a list of 15 IFN-response genes. The relative expression of these 15 IFN-response genes were then visualized by heat map in the four genotypes (sgNTC + sgNTC, sgVdac2 + sgNTC, sgNTC + sgSting1 and sgVdac2 + sgSting1).
scRNA-seq and data analysis
Library preparation
For scRNA-seq analysis, wild-type mice were challenged with control or VDAC2-deficient B16-OVA tumour cells. CD45+ immune cells and Ametrine+ CD45– tumour cells in the tumour tissues were sorted on day 14 after tumour inoculation and mixed at a 3:1 ratio (n = 2 biological replicates per genotype). The cell mixture was centrifuged at 2,000 rpm for 5 min and then resuspended in 1× PBS (Thermo Fisher Scientific) plus 0.04% BSA (Amresco) with a final concentration of 1 × 10⁶ cells per ml. The single-cell suspensions were loaded onto the Chromium Controller and encapsulated into droplets. The Chromium Next GEM Single Cell 5′ (version 2) and Gel Bead Kit (10x Genomics) was used for the library preparation according to the manufacturer’s instructions. The final libraries were quality-checked using the 2100 Bioanalyzer (Agilent Technologies). The resulting libraries were sequenced on the NovaSeq (Illumina) system with paired-end reads of 26 cycles for read 1 and 90 cycles for read 2 and 10 cycles for index 1 and 2 separately). An average of 500 million reads per sample was obtained.
Data processing and quality control
The Cell Ranger (v.6.0.0) Single-Cell software suite (10x Genomics) was used to process the scRNA-seq FASTQ files. The ‘cellranger count’ command was performed to align the raw FASTQ files to the mm10 mouse reference genome and summarize the data into matrices that describe gene read counts per cell. For the datasets with matched TCR-seq data, the ‘.vdj’ command was used to generate a count matrix, which, after filtering, was used for downstream analyses.
For gene expression sequencing, the filtered count matrices were read into the R package Seurat (v.4.1). The samples (control and VDAC2-deficient tumours with corresponding CD45+ immune cells) were merged into a single Seurat object for consistent filtering, and features detected in fewer than three cells were removed from the dataset. Cells with abnormally low features or unique molecular identifier (UMI) counts or high mitochondrial read percentages (potentially dead or damaged cells) were removed. Cells with abnormally high UMI counts (potentially multiple cells in a single droplet) were also removed. Finally, any remaining multiplets expressing mutually exclusive marker genes were removed. After filtering, 17,344 cells were retained with an average of 4,064 genes per cell (UMI median: 11,006; range: 500–149,945). After quality control, libraries were normalized with the NormalizeData function (scale.factor = 1 × 10⁶) in the Seurat R package.
Cluster annotation and data visualization
Normalized and filtered data were processed using the standard Seurat pipeline. UMAP dimensionality reduction was used for visualization, and Seurat’s FindClusters function was used to separate cells into unsupervised clusters. Cell types in clusters were defined using the following marker genes: B cells (Cd19+), CD8+ T cells (Cd3d+Cd8a+), CD4+ T cells (Cd3d+Cd4+Foxp3–), cDC1 (Xcr1+), cDC2 (Cd209a+), macrophages (Adgre1+), mregDC (Ccr7+, Cd200+, Fscn1+), neutrophils (Hdc+), NK cells (Ncr1+), pDC (Siglech+), Treg cells (Foxp3+) and tumour cells (Cd45–). Tumour cells were further verified based on the inferred presence of somatic copy-number alterations using inferCNV (v.1.3.5). For the CreateInfercnvObject() function, we used CD8+ T cells as a negative control group. For the run() function, we used the following parameter values: cutoff=0.1, cluster_by_groups=TRUE, denoise=TRUE, HMM=TRUE. CD8+ T cells were further clustered into stem-like (Tcf7+Havcr2–), effector-like (Tcf7–Havcr2+Pdcd1+ToxintMki67+) and terminally differentiated (Tcf7−Havcr2+Pdcd1+ToxhighCd38+Cd101+Mki67−) CD8+ T cells based on the expression of the indicated markers.
TCR data analysis and visualization
For TCR-seq, filtered contig annotation matrices from the Cell Ranger output were loaded into R. Annotation and quantification of TCR clonotypes were processed with the scRepertoire package (v.1.3.5). Clonal frequencies in CD8+ T cells (Cd3d+Cd8a+) were categorized as follows: NA (0), single (1), small (2–5), medium (6–20), large (21–100) and hyper (101–500). Clonal expansion bar plots were generated using the ggplot2 R package. The clonotypic information was integrated to the Seurat object using the combineExpression() function, with the cloneTypes variable set to cloneTypes=c((Single=1, Small=5, Medium=20, Large=100, Hyperexpanded=500). The cell frequencies of different clonetype sizes were further plotted as a stacked bar plot by ggplot2 R package. Cells were considered clonally expanded if the clonotype size was greater than 1 and non-expanded if the clonotype size was equal to 1.
GSEA and signature curation
For scRNA-seq analysis, nonparametric Wilcoxon rank-sum tests were used to compare the gene expression of cells between two genotypes (sgVdac2 versus sgNTC) and then genes in each comparison were ranked on the basis of their log2FC. To identify the enriched pathways, pre-ranked GSEA (an analysis of GSEA against a user-supplied, ranked list of genes) was then performed as previously described76 against gene sets from the Hallmark collection from the Molecular Signatures Database (mSigDB) (https://www.broadinstitute.org/gsea/msigdb/, v.7.4). For CD8+ T cells, gene signatures of ‘early activation’ and ‘effector/cytokine’ were curated using a previous publication77, with their activity scores calculated using the AddModuleScore() function in Seurat R package. The VDAC2-suppressed gene signature was generated by defining the upregulated genes (log2FC > 0.7, FDR < 0.05) in VDAC2-deficient versus control tumour cells based on the scRNA-seq data. A total of 26 human homologues of genes included in the list of VDAC2-suppressed genes was used for TGCA analysis (Supplementary Table 4). Specifically, to assess whether expression of VDAC2-suppressed genes is associated with the survival outcome of patients with cancer, we assigned patients with cutaneous melanoma from the TCGA SKCM cohort to high or low groups based on the median value of expression of VDAC2-suppressed genes and performed overall survival analysis using the interactive web-based tool GEPIA v.2 (http://gepia2.cancer-pku.cn/#survival)78. The survival results were displayed using Kaplan–Meier curves. P value = 0.05 was used as the threshold of statistical significance. The dotted lines in Extended Data Fig. 4w indicate the 95% confidence interval. To assess whether the expression of VDAC2-suppressed genes is associated with the survival of patients with cancer with anti-PD-1 therapy, the association between expression of VDAC2-suppressed genes and the overall survival in patients treated with anti-PD-1 were tested using Cox proportional hazards regression analysis in melanoma using TIDE (http://tide.dfci.harvard.edu/login/)79,80. The P values were generated using the two-sided Wald test in the Cox proportional hazards regression. Patient groups with high or low expression of VDAC2-suppressed genes were stratified by the median value of the signature expressing.
ATAC–seq sample preparation and analysis
C57BL/6 mice were s.c. implanted with 1 × 10⁶ control or VDAC2-deficient or control B16-OVA cells. At day 15 after tumour inoculation, control or VDAC2-deficient B16-OVA cells were sort-purified for ATAC–seq analysis (n = 4 biological replicates per group). For ATAC–seq profiling of CD8+ T cells from tumours, PD-1–CD8+ T cells and PD-1+CD8+ T cells were sorted from control or VDAC2-deficient B16-OVA tumours at day 14 after tumour inoculation (n = 4 biological replicates per group). Sorted cells were incubated in 50 μl ATAC–seq lysis buffer (10 mM Tris-HCl, pH 7.4, 10 mM NaCl, 3 mM MgCl2 and 0.1% IGEPAL CA-630) for 10 min on ice. The resulting nuclei were pelleted at 500g at 4 °C for 10 min. The supernatant was discarded. The pellet was resuspended in 50 μl transposase reaction mix (25 μl 2× TD buffer, 22.5 μl nuclease-free water and 2.5 μl transposase) and incubated at 37 °C for 30 min to allow tagmentation. The DNA was cleaned up using a Qiagen MinElute kit. The barcoding reaction of the tagmented DNA was run by a NEBNext HiFi kit and amplified for five cycles as previously described using the same primers. The optimal cycle numbers were determined from 5 μl (of 50 μl) from the previous reaction mix using KAPA SYBRFast (Kapa Biosystems) and a 20-cycle amplification on the Applied Biosystems 7900HT system. The remaining 45 μl of PCR reaction was amplified in the same reaction mix using the optimal cycle number.
ATAC–seq data analysis
Paired-end reads (2 × 50 bp) generated from NovaSeq were trimmed to remove Nextera adaptors using trimmomatic (v.0.36) in paired-end mode with the parameters LEADING:10, TRAILING:10, SLIDINGWINDOW:4:18 and MINLEN:25. These reads were then aligned to the mm10 mouse genome by BWA (v.0.7.16, default settings). Duplicated reads were flagged using Picard (v.2.9.4) and only unique, properly paired reads were retained using SAMtools (with the parameters ‘-q 1 -F 1804’; v.1.9). After adjustment of Tn5 transposase shift (with reads shifted +4 bp on the sense strand and −5 bp on the antisense strand), the fragments were divided into nucleosome-free, mononucleosome, dinucleosome and trinucleosome categories based on size as previously described29. Bigwig files were created using the centre 80 bp of each fragment, normalized to 30 × 106 nucleosome-free reads. All of the samples contained approximately 2 × 10⁸ nucleosome-free reads, reflecting high data quality. Next, peaks in nucleosome-free regions were identified using MACS2 (v.2.1.1.20160309, with the default parameters with ‘–extsize 200–nomodel’). To enhance the reproducibility, peaks were retained only if they passed a stricter threshold (MACS2 –q 0.05). Group consensus peaks were formed by retaining peaks present in at least 50% of replicates and discarding the rest. The reproducible peaks were further merged between samples if they overlapped by at least 100 bp and nucleosome-free reads from each sample were counted using bedtools (v.2.25.0).
To identify the differentially accessible open chromatin regions, the raw nucleosome-free read was first normalized as counts per million followed by differential accessibility analysis by implementation of the negative binomial model in the DESeq2 R package (v.1.43.5). P < 0.05, |log2(FC)| > 0.4 were used as cut-off values for more-accessible or less-accessible regions in B16-OVA tumour cells. P < 0.05, |log2FC| > 0.5 were used as cut-off values for more-accessible or less-accessible regions in CD8+ T cells from tumours. Principal component analysis (PCA) was performed using the function prcomp in R. Functional peak set enrichment was then performed using MSigDB, Hallmark, C2 and C5 collection for those differentially accessible genes. For motif enrichment analysis, 1,000 unchanged regions (log2FC < 0.05 and P > 0.5) were selected as control regions for each comparison. FIMO from MEME suite (v.4.11.3, ‘–thresh 1e-4–motif-pseudo 0.0001’) was used for scanning motifs (TRANSFAC database release 2019, only included Vertebrata) matches in the nucleosome-free regions, and two-tailed Fisher’s exact tests were used to determine whether a motif was significantly enriched in differentially accessible regions compared with the control regions.
Analysis of public transcriptomics datasets
To examine the expression of VDAC1, VDAC2 and VDAC3 in tumour cells and other immune cells from the TME, the human melanoma (GEO: GSE215121)81, human non-small cell lung cancer (NSCLC) (GEO: GSE148071)82 and mouse tumour scRNA-seq (GEO: GSE121861)83 datasets were analysed using Seurat. For the analysis of the human melanoma dataset, we used the provided read count matrix in GSE215121. After creating the Seurat object, we pooled the 11 samples using the merge() function. Cells were initially quality filtered based on the percentage of mitochondrial reads < 10% (to remove dead cells) and the number of detected RNA features (gene number <5,000 and UMI < 40,000 to remove potential doublets), and then the data were processed using the standard Seurat pipeline. Cell types were determined based on the indicated markers: T cells (CD3D+CD3E+), B cells (MS4A1+CD79A+), NK cells (FGFBP2+KLRD1+), combined monocytes and macrophages (LYZ+CD68+CD14+), melanoma cells (MLANA+PMEL+MITF+DCT+), endothelial cells (VWF+PECAM1+) and fibroblasts (COL1A1+COL3A1+). For the analysis of the human NSCLC dataset, we used the prefiltered read count matrix provided in GSE148071. After creating the Seurat object, we pooled the 42 samples using the merge() function. The data were then processed using the standard Seurat pipeline. Cell types were defined using the marker provided in the paper82: endothelial cells (CLDN5+VWF+PECAM1+), epithelial cells (CAPS+SNTN+), alveolar cells, (CLDN18+AQP4+FLOR1+), fibroblasts (COL1A1+COL1A2+DCN+), T cells (CD2+CD3D+CD3E+CD3G+), B cells (CD79A+CD79B+), myeloid cells (CD14+LYZ+), neutrophils (CSF3R+S100A8+S100A9+), follicular dendritic cells (FDCSP+), mast cells (GATA2+TPSAB1+TPSB2+) and cancer cells (EPCAM+). For both the human melanoma and NSCLC tumour datasets, the expression of VDAC1, VDAC2 and VDAC3 in different cell types was visualized by DotPlot() function from the Seurat package. For the mouse tumour scRNA-seq dataset, the expression of Vdac1, Vdac2 and Vdac3 in the indicated cell types from GSE121861 was also visualized using the DotPlot() function from the Seurat package.
The perturbation effects of VDAC2 among tumour lines in DepMap were visualized by Chronos dependency scores. The perturbation effects of VDAC2 in human melanoma cells treated with TILs was visualized by comparing ‘neg | score’ and ‘neg | rank’ columns in the comparison of cells treated with TILs at 1:1 ratio versus control cells on day 1722. The Pearson correlation between the VDAC2 gene and the 18-gene tumour inflammation signature (including HLA-E, NKG7, CD8A, PSMB10, HLA-DQA1, HLA-DRB1, CMKLR1, CCL5, CXCL9, CD27, CXCR6, IDO1, STAT1, TIGIT, LAG3, CD274, PDCD1LG2 and CD276)84, CCL5 or CD3D85 was calculated in each tumour type from TCGA database. Skin cutaneous melanoma and NSCLC tumour RNA-seq data from TCGA were deconvoluted by CIBERSORTx (v.1.05)86 to determine the fraction of CD4+ and CD8+ T cells.
Statistical analysis for biological experiments
For biological experiment (non-omics) analyses, data were analysed by Prism v.10 software (GraphPad) using two-tailed unpaired Student’s t-tests, one-way ANOVA or two-way ANOVA, as indicated in the figure legends. The Mantel–Cox test was used for comparing mouse survival curves. Two-tailed Wilcoxon rank-sum tests were applied for activity score or expression analysis of scRNA-seq data. P < 0.05 was considered statistically significant, with the exact P values provided in the source data that accompany this Article. In all bar plots, data are mean ± s.e.m.
Reporting summary
Further information on research design is available in the Nature Portfolio Reporting Summary linked to this article.

Responses