VisionMD: an open-source tool for video-based analysis of motor function in movement disorders
Introduction
Assessing motor symptoms is crucial for diagnosing and managing movement disorders like Parkinson’s disease (PD), yet current clinical approaches have significant limitations. The Movement Disorders Society Unified Parkinson’s Disease Rating Scale (MDS-UPDRS) Part-III Motor Examination, the most widely used method for assessing motor symptoms in PD1,2, is inherently subjective and the accuracy of assessments depends on the raters’ experience. This subjectivity poses challenges, especially in multi-center or longitudinal studies, where multiple raters can introduce unwanted variability3. Additionally, these assessments struggle to detect subtle motor symptoms in early-stage PD, limiting their utility for early diagnosis4,5. Current methods also face scalability challenges, as they require highly trained clinicians. These limitations call for more objective, scalable, and sensitive tools that can provide consistent assessments of motor function.
Recent advances in video-based analysis of MDS-UPDRS motor tasks offer great promise for complementing clinical assessments with objective, accessible evaluations of motor function6,7,8,9,10,11. However, these technologies are often inaccessible due to the need for programming and machine learning expertise. Several commercial and non-commercial video processing platforms, such as KELVIN, PARK, and FastEval, have been introduced for video-based assessment of MDS-UPDRS motor tasks11,12,13,14. On these platforms, patient’s videos are processed with proprietary algorithms that are closed-sourced and cannot be accessed or modified. Moreover, patients’ data must be uploaded to a cloud server for processing, introducing potential risks to data privacy and security. Finally, commercial platforms face significant barriers to accessibility due to high licensing costs and proprietary hardware requirements.
To address these limitations, we introduce VisionMD, an open-source software platform designed to automate video-based analysis of MDS-UPDRS motor tasks. VisionMD provides a scalable, user-friendly tool for evaluating motor symptoms in PD and other movement disorders. Different from other platforms, VisionMD processes data locally, maximizing patient data privacy and data protection. As Fig. 1 shows, VisionMD includes three primary components: (i) Subject Selection, (ii) Task Selection, and (iii) Task Analysis. In the Subject Selection component, users select a video and VisionMD automatically localizes the position of the subject of interest in the video. In the Task Selection component, users define the start and end times of the different motor tasks in the video using frame-level precision. Labels for the tasks can be selected from a drop-down menu. Finally, in the Task Analysis component, VisionMD uses machine learning algorithms to track body movements during the performance of the selected motor tasks and computes kinematic features that quantify the severity of motor symptoms. A more detailed description of the tool is provided in the Methods.
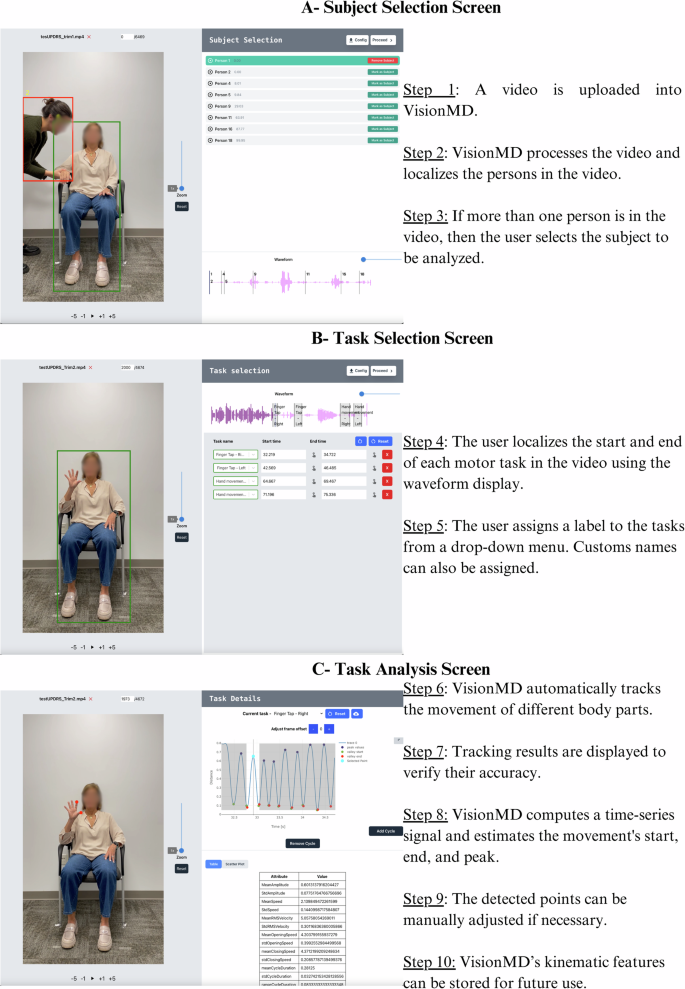
The user begins by uploading a video and VisionMD processes it to localize the person in the video. If multiple people are present, the user selects the subject to be analyzed. Next, the user defines the start and end of each motor task using the waveform display, assigns task labels from a drop-down menu, and can assign custom names. Finally, VisionMD automatically tracks body part movements, computes a time-series signal that represents the movement of the tracked body parts, and detects the movement’s start, end, and peak. Tracking results can be manually adjusted if needed. VisionMD computes kinematics features from the signal and these can be stored for future use.
To test VisionMD, we first asked whether it could identify clinically expected changes resulting from DBS therapy. We collected video data from patients (n = 12) with Parkinson’s disease (PD) undergoing a DBS-ON/DBS-OFF protocol at the University of Florida. Data corresponded to videos of four MDS-UPDRS Part III motor tasks, including Finger Tapping, Hand Movement, Leg Agility, and Toe Tapping. Table 1 presents the kinematic features that differ significantly between DBS-ON/DBS-OFF conditions for the Finger Tapping Test, including movement amplitude and the variability of movement amplitude and speed. These findings reflect the known impact of DBS in improving motor consistency and reducing hand tremor15. Additional kinematic features measured by VisionMD, and the results for the other motor tasks are available as supplementary material. To further validate the clinical utility of VisionMD, we also collected Finger Tapping videos from patients (n = 12) undergoing a standardized levodopa challenge protocol (MED-ON/MED-OFF) at the University of Würzburg. Table 1 demonstrated that kinematic features related to movement speed that differed significantly between MED-ON/MED-OFF conditions. This observation is consistent with the well-documented effects of dopamine replacement therapy on bradykinesia16. Additional kinematic features measured by VisionMD are available as supplementary material. Notably, VisionMD did not detect significant changes in movement amplitude or variability between MED-ON/MED-OFF conditions, suggesting a specific influence of levodopa on velocity-related features. Together, these results highlight VisionMD’s sensitivity in capturing clinically relevant motor changes across different therapeutic interventions.
Next, we measured the reliability of VisionMD by evaluating inter-rater agreement among six participants with no prior experience using the software: three experienced movement disorder neurologists and three medical students. After a brief tutorial, participants analyzed three Finger Tapping task videos using VisionMD. As Table 2 demonstrates, there was an excellent agreement for all 23 video-derived kinematic features regardless of the raters’ level of experience, the Intraclass Correlation Coefficients (ICCs) for all variables ranged from 0.86 to 1.00. Movement speed, a critical feature for assessing bradykinesia, achieved perfect agreement for all raters (ICC = 1.00), underscoring the robustness and user-independence of VisionMD in delivering consistent outcomes.
To further contextualize VisionMD’s reliability, we compared it to traditional clinical scoring methods. Five additional movement disorder specialists assessed the same videos using the MDS-UPDRS Part III criteria. The ICC for the clinical scores was 0.74, reflecting moderate agreement among clinicians. This moderate agreement highlights a known limitation of traditional scoring methods, even among highly trained clinicians. In contrast, VisionMD consistently produced higher ICC values, emphasizing its potential to provide objective, reproducible measures of motor function and reduce variability in clinical assessments.
To ensure that the observed changes in our measurements reflect true differences rather than measurement error, we calculated the Minimal Detectable Change (MDC) for each kinematic feature provided by VisionMD under different medication conditions. Utilizing the ICC to assess measurement reliability, we derived the Standard Error of Measurement (SEM) and subsequently computed the MDC at a 95% confidence level. We expressed the MDC values as percentages relative to each attribute’s mean score to enable comparison across measures. As Table 2 demonstrates, most relative MDCs were below 10%, indicating very high sensitivity of VisionMD. Some attributes exhibited MDCs between 10% and 20%; for example, the standard deviation of Movement Amplitude had a relative MDC of 16.75%, and the standard deviation of Opening Speed was 18.53%, suggesting that larger changes are necessary to be considered significant for these measures. Conversely, attributes such as Mean Cycle Duration and Rate demonstrated a relative MDC below 1%, allowing detection of even extremely small changes. Importantly, all relative MDCs remained below 20%, confirming that VisionMD reliably detects small changes in patient outcomes.
Despite the small size of the datasets analyzed, VisionMD successfully analyzed data recorded independently by two teams (one at the University of Florida, USA, and another at the University of Würzburg, Germany) using distinct recording protocols, settings, illumination conditions, and cameras, emphasizing VisionMD’s robustness and flexibility. Moreover, all analyses were performed on standard clinical computers without the need for internet or specialized hardware. VisionMD’s open-sourced code, vailable at www.VisionMD.ai, allows for transparency, adaptability, and the development of custom analyses tailored to individual users.
Currently, VisionMD supports four motor tasks from the MDS-UPDRS Part III, including Finger Tapping, Hand Movement, Leg Agility, and Toe Tapping. Future enhancements of VisionMD will expand the number of tasks analyzed from MDS-UPDRS Part III. Our next objective is to add four additional tasks—3.6 Pronation and Supination of the Hand, 3.15 Postural Tremor of the Hands, 3.16 Kinetic Tremor of the Hands, and 3.17 Rest Tremor Amplitude, allowing VisionMD to quantifying bradykinesia and tremor in PD and related disorders. While VisionMD offers pre-built functionalities, users can also customize it by defining their own tasks and processing pipelines using Python.
VisionMD offers a groundbreaking approach to standardizing motor assessments across clinical settings by providing objective, reproducible measures of motor function. We believe that VisionMD has the potential of accelerating the discovery of new therapies and impact the development of personalized medicine that will benefit from frequent serial monitoring of motor symptoms progression.
Methods
VisionMD – Video Data Analysis
To extract kinematic features from videos, VisionMD uses Google’s MediaPipe framework for body and hand pose detection from videos17. MediaPipe deep learning models for hand and body pose detection provide a balance between accuracy and processing speed, achieving high detection precision and near real-time performance on standard consumer computers. We have validated the accuracy of MediaPipe pose detection models against ground truth measures using different recording conditions7. Once a video is processed using MediaPipe pose estimation models, the 2D position of selected landmarks are used to compute a time-series signal that captures the movement of interest for each motor task. For the Finger Tapping task, the signal represents the Euclidian distance between the tip of the index finger and the tip of the thumb, normalized by hand’s length. For the Hand Movement task, the signal corresponds to the Euclidian distance between the tip of the middle finger and the wrist, normalized by hand’s length. For the Leg Agility task, the signal captures the Euclidian distance between the knee and the mid-shoulder, normalized by the torso length. Lastly, for the Toe Tapping task, the signal represents the Euclidian distance between the toe and the mid-shoulder, normalized by the torso length. VisionMD automatically detects the movement’s start, peak, and end, and users can manually adjust the detected points if necessary. Finally, Kinematic features such as movement amplitude, speed, and rhythm are computed from the time-series signal and can be exported in CSV format. Table 2 presents the list of all kinematics features derived by VisionMD for the different movement tasks.
VisionMD – Installation and User Guide
The VisionMD backend is implemented in Python, while the frontend is developed in JavaScript. The source code is available at www.VisionMD.ai has been verified to be compatible with a wide range of operating systems, including Windows, macOS, and Linux. Running the source code requires Python to be installed on the system.
A stand-alone version of VisionMD is available for both Windows and macOS. This version requires no additional software installation and is ready for use immediately after download, offering a seamless and hassle-free experience.
Video tutorials are available for both single-task (3:14 min long) and multi-task (5:42 min long) workflows. These tutorials provide comprehensive guidance on processing custom videos and downloading the resulting kinematic features, covering all necessary steps in detail. These tutorials are available at www.VisionMD.ai.
Sample videos from a healthy subject performing the different motor tasks that can be processed by VisionMD are available to help users familiarize themselves with the platform and practice processing videos to extract kinematic features. These videos are available at www.VisionMD.ai.
Participants
To evaluate the clinical utility of VisionMD, we analyzed two datasets of PD patients aiming to quantify the effects of different PD therapies on motor function.
Deep Brain Stimulation (DBS) Dataset
This dataset included videos of 12 persons with PD performing four of the MDS-UPDRS Part III motor tasks, including: Finger Tapping, Hand Movement, Leg Agility, and Toe Tapping. Each patient was recorded twice: (1) with the deep brain stimulator (DBS) turned ON (DBS-ON), and (2) with it turned OFF (DBS-OFF). Videos were recorded after an overnight withdrawal of any anti-parkinsonian medication. Subjects arrived at the recording session with their DBS turned ON and performed the first recording session (DBS-ON). The DBS was then turned OFF and patients waited 15 min before performing the second recording session (DBS OFF). Patients performed all the tasks with their right and left body sides. Videos were recorded using a standard video camera at 60 frames per second. All recording occurred at the University of Florida, Florida, USA.
Medication Dataset
This dataset included videos of 12 persons with PD performing the Finger Tapping test. Each patient was recorded twice: (1) after at least 12 h of overnight withdrawal from their dopaminergic medication (MED-OFF), and (2) after administering 1.5 times the levodopa equivalent of their usual morning dose (MED-ON). Patients performed the Finger Tapping test with the left and right hands. This approach follows the standardized Levodopa challenge protocol to evaluate the patients’ motor responsiveness to Levodopa. Videos were recorded using a standard video camera at 60 frames per second. All recording occurred at the University of Würzburg, Würzburg, Germany.
Patients in both datasets provided written informed consent before participating in the recording session, and the protocols were approved by the local IRB.
Data Analysis
Motor tasks videos were analyzed using VisionMD, extracting 23 features relevant for evaluating motor dysfunction. Paired t-tests were conducted to compare ON and OFF conditions for each feature across both datasets. To account for multiple comparisons, p-values were adjusted using false discovery rate (Benjamini-Hochberg correction).
Assessing Inter-Rater Reliability and Minimal Detectable Change
To assess the inter-rater reliability of VisionMD, two groups of raters were recruited: (i) three experienced movement disorder neurologists and (ii) three medical students with limited experience. None of the participants had prior exposure to VisionMD. After viewing a standardized video tutorial, the participants independently analyzed three Finger Tapping videos using VisionMD. All analyses were performed on a personal computer (MacBook Pro 14”, equipped with an Apple M3 Pro chip and 18 GB of RAM). To evaluate the reliability of our measurements, we calculated the Intraclass Correlation Coefficient (ICC) for each attribute using the Pingouin statistical library in Python18. We employed the ICC3 model, which assesses absolute agreement among a fixed set of raters.
For comparison with the traditional clinical scoring, a separate group of five expert neurologists, each with at least eight years of specialization in movement disorders, independently scored the same three Finger Tapping videos. Clinical scores were assigned on a 0–4 scale following the MDS-UPDRS Part III criteria. Again, the ICC was calculated using the the Pingouin statistical library.
We calculated the Minimal Detectable Change (MDC) to determine the smallest change in measurements that can be confidently interpreted as genuine and not attributable to measurement error19. We began by assessing the reliability of our measurements using the Intraclass Correlation Coefficient (ICC), which quantifies the consistency of scores across multiple raters. A higher ICC indicates greater reliability.
We then computed the Standard Error of Measurement (SEM) for each attribute using the relationship SEM = SD × √(1–ICC), where SD represents the standard deviation of the attribute scores. The SEM estimates the measurement precision by reflecting the extent of variability due to measurement error. The MDC was calculated to establish the threshold for significant change at a 95% confidence level using the formula MDC = 1.96 × √2 × SEM. This calculation incorporates a Z-score of 1.96 for the desired confidence level and a factor of √2 to account for variability between two measurements (e.g., baseline and follow-up). To facilitate comparison across different attributes, the MDC values were expressed as percentages relative to each attribute’s mean score.


Responses